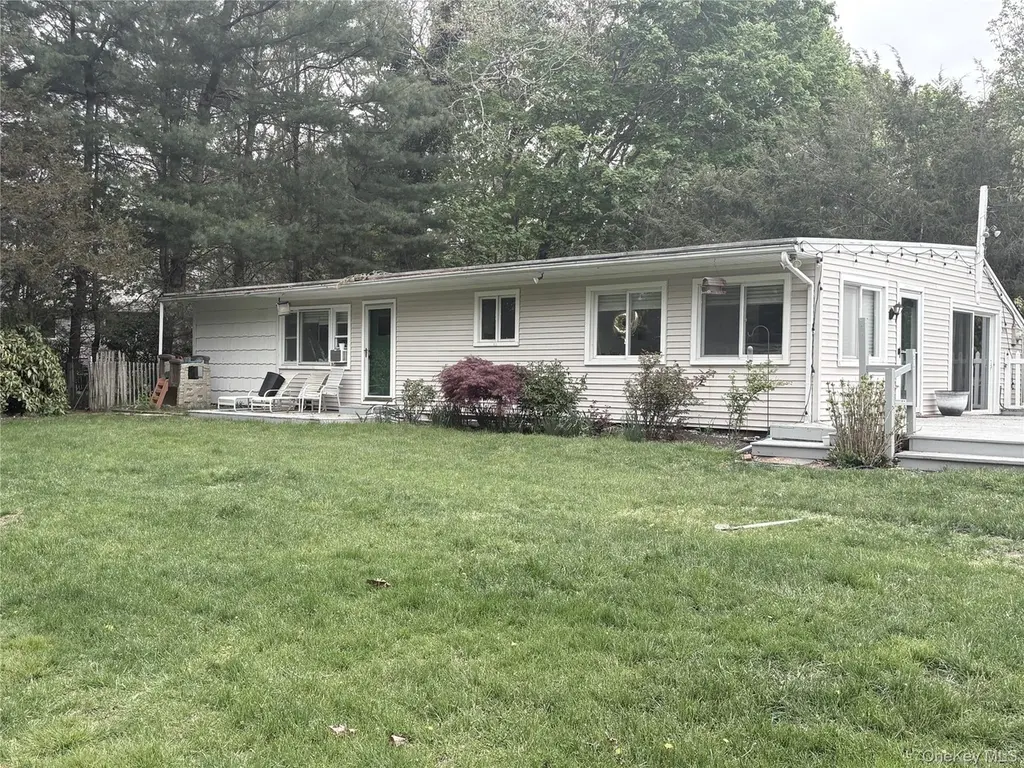
531 Montauk Hwy · Quiogue, NY
Flood risk 4/10 · Minor
- FEMA flood zone
- X (unshaded)
- Chance of flooding over 30 yrs
- 0.24%
- Est. flood insurance / yr
- $473 – $860
Fire risk 1/10 · Minimal
- Est. fire insurance / yr
- $691 – $1,283
Heat risk 4/10 · Minor
- Hot days now (above 90°F)
- 7 days/yr
- Hot days in 30 yrs
- 20 days/yr
Wind risk 8/10 · Major
- Chance of severe wind over 30 yrs
- 80.0%
Air-quality risk 2/10 · Minimal
- Unhealthy air days now
- 2 days/yr
- Unhealthy air days in 30 yrs
- 2 days/yr
Risk factors via First Street. Map © Google.
Why this score? — see what drove the A grade
The composite is a weighted blend of 9 inputs, each scored 0–100. Each bar is that input's sub-score; the figure is the points it added to the 100-point composite (weight × sub-score).
- Cash flow +30.0/30.0
- ARV discount +10.5/15.0
- 1% rule +10.0/10.0
- DSCR +10.0/10.0
- Appreciation +10.0/10.0
- Schools +6.6/10.0
- Livability +3.0/5.0
- Rent growth +2.5/5.0
- Condition / age +2.5/5.0
$975,000
🖨 Deal sheet 📄 Offer letter ✓ Due diligence
Listing remarks
Looking for a place to call your own in Quiogue Hamlet of Westhampton Beach, this three bedroom one bath ranch nestled on just shy of a quarter acre on a quiet flag lot offers privacy and comfort. This home also offers a spacious living room and dining area great for entertaining. A one car garage convenient for parking or storage. Adjacent properties MLS# 992544 and MLS# 992470 are also listed for sale, presenting a potential opportunity for expansion or investment.
Key facts
- 0.23 acre lot
- Garage
- Built 1994
Property features AI
Exterior
- Parking: Driveway; One garage space
- Utilities: Cesspool septic; Cable connected; Electricity connected; Propane; Private trash collection
- Home design: Single-family residence
- Construction: Frame construction
- Exterior features: Frame construction; Not waterfront
Interior
- Kitchen: Dishwasher; Microwave; Range; Refrigerator
- Bedrooms: Total rooms: 6 (includes bedroom(s) on the first floor)
- Bathrooms: One full bathroom
- Heating & cooling: Oil heating; Wall/window air conditioning units
- Interior features: First-floor bedroom; First-floor full bathroom; Ceiling fans; Storage space; Partially finished basement with Bilco door access
Neighborhood map
What this means for you Summary
Snapshot
- This is a 3-bed/1.0-bath single-family listed at $975k.
Deal economics
- At list price, monthly cash flow is $9k ($112k/yr) — positive.
- The deal already cash-flows at list — no discount required.
- Meets the 1% rule at list price ($19k rent vs $975k).
- Recommended offer: $946k (3.0% below list) — sets the bar for market timing.
Location & tenants
- Location reads 59/100 on livability (#1,023 in NY) — a working-class tenant base; expect higher turnover. Strengths: crime A+, employment A+, housing B; Watch: amenities F, commute F, cost of living F.
- Westhampton Beach Union Free School District (suburban): math 72% / reading 75% proficiency, ranked #81 of 590 in NY (top 14%) — strong family-tenant draw, lease renewals of 3-5y typical.
- Zoned schools: Westhampton Beach Elementary School (math 67% / reading 67%, grade B+, #525 of 2,108 statewide, top 27%, 356 students, 43% FRL); Westhampton Middle School (math 61% / reading 63%, grade B+, #136 of 729 statewide, top 20%, 434 students, 26% FRL); Westhampton Beach Senior High School (math 90% / reading 96%, grade A+, #147 of 1,100 statewide, top 14%, 964 students, 24% FRL).
- Market conditions: 112 active listings in the ZIP; 12 comparable units currently listed for rent nearby; rentals at typical pace (median 25d on market — plan ~3-4 weeks tenant-placement turnaround); high-income renter base; 1,366 units permitted in Suffolk County in 2024 (216 in 5+ unit buildings).
- At $19,239/mo this rent would consume 184% of the median local household income ($125k/yr) (locally 43% of renters already pay >50% of income on rent) — very limited rent-growth headroom before tenants either downsize or default.
Forward outlook
- In year one you build about $104k of equity ($7k loan paydown + $98k appreciation (10.0% local appreciation)).
- Suffolk County population projected to shrink 5% by 2050 — rents likely to lag national; underwrite the cash flow, not the appreciation.
- At projected returns (10.0% appreciation + 3.0% rent growth), your $273k cash investment doubles in ~2 years — after that, you're playing with house money.
- By year 2, paydown + projected appreciation supports a ~$168k cash-out refi (75% LTV) — recoverable capital for the next deal without selling this one.
Negotiation context
- It's been on market 50 days — a 3% lower offer ($946k) is reasonable based on typical stale-listing flexibility.
- 5 sale attempts since 2y ago with the ask held roughly flat each time — persistent listings suggest the price (not the market) is what's stuck; bring a comps-based counter.
Risks & watch-outs
- Climate carrying-cost: severe wind risk, 80% chance of damaging wind over 30y — expect insurance premiums to compound above CPI over the hold.
Questions for the listing agent
- It's been on market 50 days. Have you received any prior offers? Is the seller open to a 3% concession, seller financing, or rate buy-down credit?
- Is there a deadline driving the sale (1031 exchange, divorce, estate, relocation)? That informs how much negotiation room exists.
- Schools are D-rated, which usually means shorter tenancies and higher turnover. Who's the typical renter profile here, and what's been the actual vacancy rate?
- What's the average days-on-market for RENTAL listings here right now (not sales)? A rising rental-DOM trend means longer vacancies and softer asking-rent achievability than the comps imply.
- What's the recent tenant-quality profile in this submarket — average credit score on applications, eviction rate, late-payment / NSF rate, and stable-employment percentage? A property-management company in the area should have these aggregated.
- How much new for-sale + rental construction is in the pipeline within 1–3 miles? Heavy new supply typically softens prices + rents 12–24 months out; constrained supply supports both.
Investment metrics
- 1% rule
- 1.97% ✓
- Cap rate
- 17.78%
- Cash-on-cash
- 41.04%
- DSCR
- 2.83
- GRM
- 4.2
CMA / ARV
- ARV (median comp)
- $1,043,809
- List price
- $975,000
- Delta
- -6.59%
- Verdict
- FAIR
- Comps
- 8 within 1.0 mi
Show comp detail 3 sales within ~0.75 mi
| Address | Dist | Beds/Ba | Sqft | Sold | Price | $/sf | Match |
|---|---|---|---|---|---|---|---|
| 15 Fairview Ave | 0.18mi | 4/2.0 (+1) | 1,454 (+14%) | 11mo | $800,000 | $550 | 50 |
| 51 Peters Ln | 0.44mi | 3/2.0 | 1,200 (-6%) | 22mo | $935,000 | $779 | 47 |
| 77 Peters Ln | 0.53mi | 4/2.0 (+1) | 1,170 (-8%) | 15mo | $700,000 | $598 | 40 |
Match score weights: distance 35% · size 25% · config 20% · recency 20%. Top-matched comps best support the ARV.
Projected returns pro-forma
10.0% appreciation · 3.0% rent growth · sell at horizon
- IRR
- 56.1%
- Equity multiple
- 5.12×
- Total profit
- $1,125,439
- Equity at exit
- $878,357
- IRR
- 49.6%
- Equity multiple
- 11.43×
- Total profit
- $2,846,089
- Equity at exit
- $1,894,211
Cash invested: $273,000 (down + closing). Projections, not guarantees.
Landlord ↔ Tenant lean methodology
- Overall (STATE)
- 15 Strongly Tenant-Friendly
- State New York
- 15 Strongly Tenant-Friendly · D+10
- County
- — inherits STATE
- City
- — inherits STATE
ZIP-level market 11978
- Home prices YoY
- 2.9%
- Active inventory
- 112
- Price-to-rent
- 4.2×
Monthly cashflow live
- Estimated rent
- $19,239 medium interval (Pro) →
- Mortgage (P&I)
- −$5,113
- Tax from tax record
- −$343 /mo · $4,115/yr
- Insurance
- −$406
- HOA
- −$0
- Vacancy / Maint / Mgmt
- −$4,040
- Net cashflow
- $9,337
Break-even live
UW: 25.0% down · 7.5% · 30yr · 1.5% tax · 5.0% vac · 8.0% maint · 8.0% mgmt
Financing live
Cash to close
- Down payment
- $243,750
- Closing costs
- $29,250
- Reserves months
- —
- Total cash needed
- —
Loan-product check · same deal, 3 products live
Conventional
25% down · 7.5% · 30yr
- Down + closing
- —
- Monthly P&I
- —
- Monthly cashflow
- —
- DSCR
- —
- Eligible?
- —
Personal DTI + credit; lowest rate.
DSCR
20% down · 8.5% · 30yr
- Down + closing
- —
- Monthly P&I
- —
- Monthly cashflow
- —
- DSCR
- —
- Eligible?
- —
No personal income docs; deal must DSCR.
Hard money
10% down · 12.0% · 12mo
- Down + closing
- —
- Monthly P&I
- —
- Monthly cashflow
- —
- DSCR
- —
- Eligible?
- —
Short-term bridge; refi at stabilization.
Rent comps 12 comps
| Address | Beds | Baths | Sqft | Rent | $/sqft | DOM | Units | Dist |
|---|---|---|---|---|---|---|---|---|
| 9 Ocame Ave Westhampton Beach, NY | 4.0 | 3.0 | 1823 | $20,000 | $10.97 | 43d | 1 | 0.16mi |
| 44 Griffing Ave Westhampton Beach, NY | 4.0 | 4.5 | 1825 | $12,000 | $6.58 | 19d | 1 | 0.58mi |
| 243 Sunset Ave Westhampton Beach, NY | 4.0 | 2.0 | 1566 | $28,000 | $17.88 | 3d | 1 | 0.84mi |
| 4 Morris Ct Westhampton Beach, NY | 4.0 | 3.5 | 1504 | $30,000 | $19.95 | 24d | 1 | 0.85mi |
| 50 Hazelwood Ave Westhampton Beach, NY | 3.0 | 2.0 | 1112 | $20,000 | $17.99 | 24d | 1 | 0.89mi |
| 188 Main St Westhampton Beach, NY | 2.0 | 2.5 | 1400 | $5,000 | $3.57 | 22d | 1 | 0.91mi |
| 35 Maple St Westhampton Beach, NY | 3.0 | 2.5 | 1696 | $28,000 | $16.51 | 43d | 1 | 0.99mi |
| 14 Park Cir Quogue, NY | 3.0 | 2.0 | 1300 | $20,000 | $15.38 | 24d | 1 | 1.14mi |
| 3013 Mitchell Rd Westhampton Beach, NY | 2.0 | 3.5 | 1500 | $20,000 | $13.33 | 24d | 1 | 1.21mi |
| 3047 Mitchell Rd Westhampton Beach, NY | 2.0 | 2.5 | 1500 | $65,000 | $43.33 | 24d | 1 | 1.23mi |
| 3041 Mitchell Rd Westhampton Beach, NY | 2.0 | 3.0 | 1550 | $15,000 | $9.68 | 43d | 1 | 1.24mi |
| 1 Watersedge Dr Quogue, NY | 2.0 | 2.5 | 1835 | $25,000 | $13.62 | 19d | 1 | 1.38mi |
Listing history 24 events
-
2026-06-18days on market $975,000 Active 50 DOM
-
2026-06-17days on market $975,000 Active 49 DOM
-
2026-06-16days on market $975,000 Active 48 DOM
-
2026-06-15days on market $975,000 Active 47 DOM
-
2026-06-13days on market $975,000 Active 45 DOM
-
2026-06-09days on market $975,000 Active 41 DOM
-
2026-06-08days on market $975,000 Active 40 DOM
-
2026-06-07days on market $975,000 Active 39 DOM
-
2026-06-04days on market $975,000 Active 36 DOM
-
2026-06-03days on market $975,000 Active 35 DOM
-
2026-06-02days on market $975,000 Active 34 DOM
-
2026-06-02price $975,000 Active 33 DOM
-
2026-06-01days on market $999,000 Active 33 DOM
-
2026-05-31days on market $999,000 Active 32 DOM
-
2026-04-28$999,000 Active 472-char remark
-
2025-02-27historical $3,900
-
2024-12-06$3,900
-
2024-05-18historical $35,000
-
2024-05-11$35,000
-
2024-05-08historical $35,000
-
2024-04-29historical $35,000
-
2024-04-29$35,000
-
2024-04-28price $4,200
-
2024-04-09$4,500
ⓘ Source: listings_history table (triggers on properties + properties_extension) + one-shot
backfill from property_details.listing_events for pre-trigger history.
Tax reassessment forecast NY · Partial reset (capped growth)
- Current annual tax
- $4,115 · $343/mo
- Projected year-2 tax
- $10,296 · $858/mo
- Expected delta
- +$6,181/yr (+$515/mo · 150.2%)
ⓘ Screening estimate from a state-policy table — verify with the county assessor before closing.
Climate risk First Street
- Flood 4/10 Moderate FEMA zone X (unshaded) · 24% chance over 30 yrs
- Wildfire 1/10 Low
- Heat 4/10 Moderate 7 d/yr ≥90°F today · 20 d/yr by 30 yrs out
- Wind 8/10 Severe 80% chance of damaging wind over 30 yrs
- Air quality 2/10 Low 2 unhealthy d/yr today · 2 by 30 yrs out
Nearby sold comps map
Loading sold comps map…
Walkable amenities ~0.75 mi
Loading nearby amenities…
Taxation est. · year 1
- Rental income
- $230,873
- − Mortgage interest
- −$54,615
- − Property taxes
- −$4,115
- − Insurance
- −$4,875
- − Repairs & maintenance
- −$18,470
- − Management
- −$18,470
- − Depreciation
- −$28,364
- Taxable income
- $101,964
- Est. tax owed @ 24.0%
- −$24,471
- After-tax cash flow
- $87,572/yr
For passive investors: Depreciation is non-cash, so a rental often shows a tax loss while cash-flowing — sheltering income. Rental losses are passive: they offset passive income freely, and up to $25,000/yr can offset ordinary (W-2) income if you actively participate and your MAGI is under $100k (phasing out to $0 by $150k); unused losses carry forward. On sale, claimed depreciation is recaptured at up to 25%, and gains may owe capital-gains tax (a 1031 exchange can defer both). Figures are a year-1 estimate at your 24.0% rate — not tax advice; consult a CPA.
Schools (NCES district)
- District
- Westhampton Beach Union Free School District
- NCES district ID
- 3631020
- Math proficiency
- 72% ▼ -5.00%
- Reading proficiency
- 75% ▲ 3.00%
- Median HH income
- $88,137
- Composite
- 65.91/100
- National rank
- #444
- State rank
- #81 of 590 in NY
Livability — Quiogue
- Score
- 59/100
- State rank
- #1023
- US rank
- #19962
Category grades
Schools grade is shown separately in the Schools card above.
Census & demographics
- Census place
- Quiogue, NY
- County
- Suffolk County · 679,920 people
- City population
- 4,376
- Metro
- New York-Newark-Jersey City, NY-NJ-PA
- Population (ZIP)
- 4,705
- Household income
- $125,179
- Rent vs Own
- Severe rent burden
- 43.0
Population outlook (Suffolk County) Hauer SSP2
- Today (2025)
- 1,505,262 people
- By 2030
- 1,498,318 · -0.5%
- By 2040
- 1,471,101 · -2.3%
- By 2050
- 1,424,848 · -5.3%
- By 2075
- 1,337,157 · -11.2%
- By 2100
- 1,217,720 · -19.1%
Race, ethnicity, and origin ACS 2023
- Neighborhood character
- Predominantly White (72%)
- Race & ethnicity
- White 72% Two or more races 14% Hispanic / Latino 11% Black 6% Asian 2%
- Hispanic origin (detail)
- Puerto Rican 1%
- Common ancestry
- Romanian 7% Scotch-Irish 2% Italian 2%
- Foreign-born
- 14% · Canada, Jamaica, China
- Languages at home
- 84% English-only · Spanish 10% Other Indo-European 2% Russian/Polish/Slavic 1%
Political lean MEDSL · Suffolk
- 2024 margin
- Lean R (+10.0) · D 45.0% · R 55.0%
- 2008→2024 swing
- -16.0pp toward R · 2008: 6.0pp · 2024: -10.0pp
- All cycles
- 2024: R+10.0 2020: R+0.0 2016: R+8.2 2012: D+2.9 2008: D+6.0
Not yet ingested
- Civics
- —
Market trends
- HPI YoY
- ▲ 13.02%
- Current HPI
- 460.3964
- Rent YoY
- —
- Metro
- New York-Newark-Jersey City, NY-NJ-PA
- State GDP YoY
- ▲ 2.60%
- F500 in state
- 92
Industry mix (Fortune 500 HQ in NY)
| Industry | F500 HQs | Revenue |
|---|---|---|
| Financial Services | 10 | $950B |
|
||
| Consumer Goods | 9 | $162B |
|
||
| Insurance | 4 | $225B |
|
||
| Telecommunications | 2 | $144B |
|
||
| Pharmaceuticals | 2 | $112B |
|
||
| Media / Entertainment | 2 | $69B |
|
||
Price history
+21566.7% since first listed11 events — show timeline
- 2026-06-01 Price Changed $975,000 OneKey® MLS as Distributed by MLS Grid
- 2026-04-28 Listed $999,000 OneKey® MLS as Distributed by MLS Grid
- 2025-02-27 Rental Removed $3,900 ONEKEY
- 2024-12-06 Listed for Rent $3,900 ONEKEY
- 2024-05-18 Rental Removed $35,000 ONEKEY
- 2024-05-11 Listed for Rent $35,000 ONEKEY
- 2024-05-08 Rental Removed $35,000 ONEKEY
- 2024-04-29 Rental Removed $35,000 ONEKEY
- 2024-04-29 Listed for Rent $35,000 ONEKEY
- 2024-04-28 Price Changed $4,200 ONEKEY
- 2024-04-09 Listed for Rent $4,500 ONEKEY
Property tax history
+1.6%/yrLatest (2022): $4,115 · +0.0% YoY. Source: county tax records.
Cash-flow waterfall
monthlySold comps — $/sqft
last 12 mo · ≤1 miLoading sold comps…