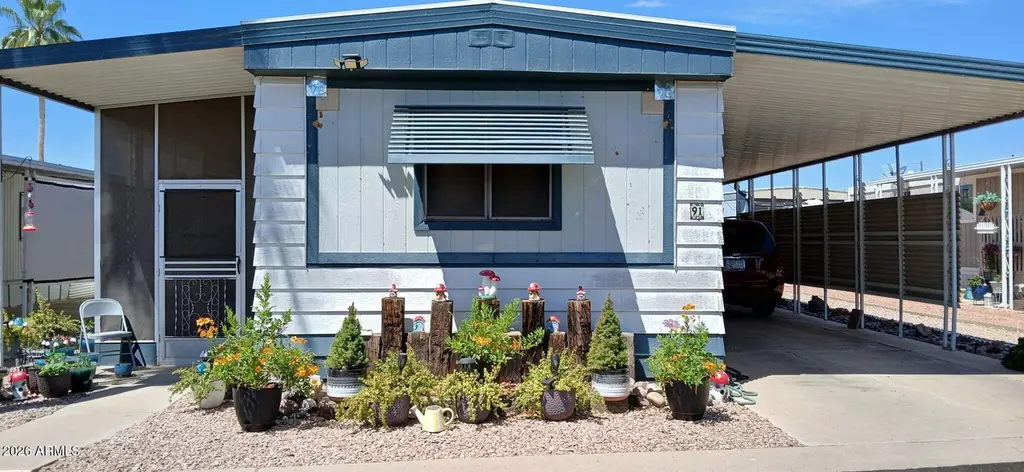
200 E Knox Rd #91 · Chandler, AZ
Flood risk 1/10 · Minimal
- FEMA flood zone
- X (shaded)
- Chance of flooding over 30 yrs
- 0.0%
- Est. flood insurance / yr
- $507 – $1,088
Fire risk 1/10 · Minimal
- Est. fire insurance / yr
- $610 – $1,132
Heat risk 9/10 · Severe
- Hot days now (above 111°F)
- 6 days/yr
- Hot days in 30 yrs
- 15 days/yr
Wind risk 1/10 · Minimal
- Chance of severe wind over 30 yrs
- —
Air-quality risk 2/10 · Minimal
- Unhealthy air days now
- 0 days/yr
- Unhealthy air days in 30 yrs
- 1 days/yr
Risk factors via First Street. Map © Google.
Why this score? — see what drove the C+ grade
The composite is a weighted blend of 9 inputs, each scored 0–100. Each bar is that input's sub-score; the figure is the points it added to the 100-point composite (weight × sub-score).
- Cash flow +30.0/30.0
- 1% rule +10.0/10.0
- DSCR +10.0/10.0
- Schools +4.8/10.0
- Livability +3.9/5.0
- Condition / age +2.2/5.0
- Rent growth +2.1/5.0
- ARV discount +0.0/15.0
- Appreciation +0.0/10.0
$77,700
🖨 Deal sheet 📄 Offer letter ✓ Due diligence
Listing remarks MLS
***LOCATION LOCATION LOCATION***2 BEDROOM,2 FULL BATH, NEW DUAL PANE WINDOWS, CENTRAL AC,TANDEM 2 CAR COVERED PARKING,***LOT RENT $553.00***home is a quick drive to shops, restaurants and casinos. Generous amenities in this 55+ park include heated saltwater pool, spa, clubhouse, billiards, shuffleboard, Bingo, and group activities.
Key facts
- 2 parking spots
- Community pool
- Built 1981
Property features AI
Finance
- HOA & community: Land lease of $615 per month; No association fees included; Community features include pool and community spa (heated)
Exterior
- Parking: 2 covered parking spaces; 2 carport spaces
- Utilities: City water; Public sewer
- Home design: Manufactured/mobile home; Leasehold ownership
- Construction: Vinyl siding; Wood frame construction; Composition roof
- Exterior features: Screened-in patio(s); Outdoor storage; Gravel/stone front; Gravel/stone back
Interior
- Kitchen: Laminate countertops; Pantry; Eat-in kitchen; Dishwasher; Disposal
- Bedrooms: 2 possible bedrooms
- Flooring: Linoleum; Tile
- Bathrooms: 2 full bathrooms
- Heating & cooling: Electric heating; Central air conditioning; Ceiling fans
- Interior features: High-speed internet; Master bedroom on the ground floor; Eat-in kitchen; 9+ foot flat ceilings; No interior steps; Pantry; 3/4 bath in master bedroom; Laminate counters; Dishwasher; Disposal
- Laundry & utility: Indoor laundry
Neighborhood map
What this means for you Summary
Snapshot
- This is a 2-bed/2.0-bath manufactured listed at $78k. Condition is rated fair.
Deal economics
- At list price, monthly cash flow is $768 ($9k/yr) — positive.
- The deal already cash-flows at list — no discount required.
- Meets the 1% rule at list price ($2k rent vs $78k).
- Recommended offer: $77k (1.5% below list) — sets the bar for market timing.
- Cap rate 18.2% vs local median 3.3% in Chandler — top-decile yield for the area; either an underpriced asset or a hidden risk that comps aren't pricing in. Stress-test before assuming the spread holds.
Location & tenants
- Location reads 78/100 on livability (#9 in AZ, #2,508 nationally) — a middle-class / working-renter tenant base. Strengths: employment A+, housing A+, crime A-; Watch: health & safety D, cost of living D-.
- Chandler Unified District #80 (4242) (suburban): math 49% / reading 57% proficiency, ranked #31 of 249 in AZ (top 12%) — acceptable for families but not a draw, mixed tenant base, ~2y average lease.
- Market conditions: Rents soft (-1.7%/yr); 182 active listings in the ZIP; 40 comparable units currently listed for rent nearby; rentals at typical pace (median 19d on market — plan ~3-4 weeks tenant-placement turnaround); solid renter incomes; 36,011 units permitted in Maricopa County in 2024 (12,801 in 5+ unit buildings).
Forward outlook
- Local home prices are declining (-3.0%/yr); year-one equity from $537 of loan paydown is wiped out by about $2k of value loss. Plan a longer hold.
- Maricopa County population projected at +38% by 2050 — long-run rental-demand tailwind backs the buy-and-hold thesis.
- At projected returns (-3.0% appreciation + 0.0% rent growth), your $22k cash investment doubles in ~3 years — after that, you're playing with house money.
Negotiation context
- It's been on market 22 days — a 2% lower offer ($77k) is reasonable based on typical stale-listing flexibility.
- 3 sale attempts since 2y ago with the ask held roughly flat each time — persistent listings suggest the price (not the market) is what's stuck; bring a comps-based counter.
- Current owner paid $40k; list at $78k implies a 94% gain — meaningful room to come down on a strong offer.
Risks & watch-outs
- Climate carrying-cost: extreme-heat days projected 6→15/yr by 2055 (HVAC capex compounding) — expect insurance premiums to compound above CPI over the hold.
Questions for the listing agent
- Have any recent inspections been done? Can we get a copy of the seller's disclosures and any deferred-maintenance estimates?
- Is there a deadline driving the sale (1031 exchange, divorce, estate, relocation)? That informs how much negotiation room exists.
- Schools are B-rated — typically a magnet for longer-tenancy family renters. What's the average tenant stay here, and is there a school-zone premium baked into asking?
- What's the average days-on-market for RENTAL listings here right now (not sales)? A rising rental-DOM trend means longer vacancies and softer asking-rent achievability than the comps imply.
- What's the recent tenant-quality profile in this submarket — average credit score on applications, eviction rate, late-payment / NSF rate, and stable-employment percentage? A property-management company in the area should have these aggregated.
- How much new for-sale + rental construction is in the pipeline within 1–3 miles? Heavy new supply typically softens prices + rents 12–24 months out; constrained supply supports both.
Investment metrics
- 1% rule
- 2.13% ✓
- Cap rate
- 18.15%
- Cash-on-cash
- 42.36%
- DSCR
- 2.88
- GRM
- 3.9
CMA / ARV
- ARV (on-the-fly)
- $63,700
- Comps found
- 8
Show comp detail 8 sales within ~0.75 mi
| Address | Dist | Beds/Ba | Sqft | Sold | Price | $/sf | Match |
|---|---|---|---|---|---|---|---|
| 200 E Knox Rd #43 | 0.06mi | 2/2.0 | 990 (+1%) | 10mo | $80,000 | $81 | 87 |
| 200 E Knox Rd #116 | 0.06mi | 2/2.0 | 980 (0%) | 15mo | $6,000 | $6 | 85 |
| 200 E Knox Rd #47 | 0.06mi | 2/2.0 | 1,024 (+4%) | 12mo | $40,000 | $39 | 79 |
| 200 E Knox Rd #145 | 0.00mi | 2/2.0 | 840 (-14%) | 1mo | $38,500 | $46 | 75 |
| 200 E Knox Rd #18 | 0.06mi | 2/2.0 | 1,056 (+8%) | 12mo | $52,900 | $50 | 74 |
| 200 E Knox Rd #60 | 0.06mi | 2/2.0 | 1,056 (+8%) | 18mo | $68,900 | $65 | 70 |
| 501 E Ray Rd #211 | 0.64mi | 3/2.0 (+1) | 924 (-6%) | 10mo | $65,000 | $70 | 47 |
| 555 W Warner Rd #55 | 0.75mi | 3/2.0 (+1) | 1,104 (+13%) | 3mo | $74,955 | $68 | 37 |
Match score weights: distance 35% · size 25% · config 20% · recency 20%. Top-matched comps best support the ARV.
Projected returns pro-forma
-3.0% appreciation · 0.0% rent growth · sell at horizon
- IRR
- 35.6%
- Equity multiple
- 2.45×
- Total profit
- $31,503
- Equity at exit
- $11,585
- IRR
- 40.8%
- Equity multiple
- 4.30×
- Total profit
- $71,806
- Equity at exit
- $6,718
Cash invested: $21,756 (down + closing). Projections, not guarantees.
Landlord ↔ Tenant lean methodology
- Overall (STATE)
- 87 Strongly Landlord-Friendly
- State Arizona
- 87 Strongly Landlord-Friendly · R+3
- County
- — inherits STATE
- City
- — inherits STATE
ZIP-level market 85225
- Home prices YoY
- -28.1%
- Rents YoY
- -1.7%
- Active inventory
- 182
- Price-to-rent
- 3.9×
Monthly cashflow live
- Estimated rent
- $1,652 high interval (Pro) →
- Mortgage (P&I)
- −$407
- Tax est. 1.5%
- −$97 /mo · $1,166/yr
- Insurance
- −$32
- HOA
- −$0
- Vacancy / Maint / Mgmt
- −$347
- Net cashflow
- $768
Break-even live
UW: 25.0% down · 7.5% · 30yr · 1.5% tax · 5.0% vac · 8.0% maint · 8.0% mgmt
Financing live
Cash to close
- Down payment
- $19,425
- Closing costs
- $2,331
- Reserves months
- —
- Total cash needed
- —
Loan-product check · same deal, 3 products live
Conventional
25% down · 7.5% · 30yr
- Down + closing
- —
- Monthly P&I
- —
- Monthly cashflow
- —
- DSCR
- —
- Eligible?
- —
Personal DTI + credit; lowest rate.
DSCR
20% down · 8.5% · 30yr
- Down + closing
- —
- Monthly P&I
- —
- Monthly cashflow
- —
- DSCR
- —
- Eligible?
- —
No personal income docs; deal must DSCR.
Hard money
10% down · 12.0% · 12mo
- Down + closing
- —
- Monthly P&I
- —
- Monthly cashflow
- —
- DSCR
- —
- Eligible?
- —
Short-term bridge; refi at stabilization.
Rent comps 40 comps
| Address | Beds | Baths | Sqft | Rent | $/sqft | DOM | Units | Dist |
|---|---|---|---|---|---|---|---|---|
| 98 W Orchid Ln Unit 98-03 Chandler, AZ | 2.0 | 1.0 | 800 | $1,025 | $1.28 | 44d | 1 | 0.38mi |
| 300 E Warner Rd Chandler, AZ | 1.0–3.0 | 1.0–2.0 | 1030 | $1,606 | $1.56 | 2d | 28 | 0.47mi |
| 250 E Ray Rd Chandler, AZ | 1.0–3.0 | 1.0–2.0 | 1073 | $2,729 | $2.54 | 19d | 11 | 0.51mi |
| 1970 N Hartford St #4 Chandler, AZ | 2.0 | 1.5 | 849 | $1,650 | $1.94 | 44d | 1 | 0.64mi |
| 1970 N Hartford St #99 Chandler, AZ | 2.0 | 2.5 | 1098 | $1,850 | $1.68 | 5d | 1 | 0.64mi |
| 1970 N Hartford St #99 Chandler, AZ | 2.0 | 2.5 | 1098 | $1,850 | $1.68 | 11d | 1 | 0.64mi |
| 1970 N Hartford St #4 Chandler, AZ | 2.0 | 1.5 | 849 | $1,650 | $1.94 | 24d | 1 | 0.64mi |
| 1320 N McQueen Rd Chandler, AZ | 2.0 | 2.0 | 883 | $1,427 | $1.62 | 5d | 1 | 0.69mi |
| 1320 N McQueen Rd Chandler, AZ | 2.0 | 2.0 | 851 | $1,387 | $1.63 | 24d | 1 | 0.69mi |
| 1320 N McQueen Rd Chandler, AZ | 1.0 | 1.0 | 604 | $1,112 | $1.84 | 20d | 1 | 0.69mi |
| 235 E Ray Rd Chandler, AZ | 2.0–3.0 | 2.0 | 1031 | $1,559 | $1.51 | 2d | 9 | 0.71mi |
| 1600 N Saba St #163 Chandler, AZ | 2.0 | 1.5 | 870 | $1,550 | $1.78 | 11d | 1 | 0.73mi |
| 1600 N Saba St #115 Chandler, AZ | 2.0 | 1.5 | 870 | $1,368 | $1.57 | 24d | 1 | 0.73mi |
| 433 W Ray Rd Chandler, AZ | 2.0 | 1.0 | 770 | $1,000 | $1.30 | 44d | 1 | 0.76mi |
| 123 E Corporate Pl Chandler, AZ | 1.0–3.0 | 1.0–2.0 | 1285 | $2,642 | $2.06 | 5d | 91 | 0.80mi |
| 1320 N McQueen Rd Unit A1 Chandler, AZ | 1.0 | 1.0 | 604 | $1,087 | $1.80 | 22d | 1 | 0.83mi |
| 1320 N McQueen Rd Unit B1 Chandler, AZ | 2.0 | 2.0 | 851 | $1,227 | $1.44 | 24d | 1 | 0.83mi |
| 771 N Delaware St Chandler, AZ | 2.0 | 1.0 | 645 | $1,400 | $2.17 | 22d | 1 | 0.86mi |
| 2222 N McQueen Rd Chandler, AZ | 1.0 | 1.0 | 880 | $1,462 | $1.66 | 22d | 1 | 0.93mi |
| 2222 N McQueen Rd Chandler, AZ | 1.0 | 1.0 | 880 | $1,689 | $1.92 | 3d | 1 | 0.93mi |
| 822 W Knox Rd Chandler, AZ | 2.0 | 1.0 | 850 | $1,375 | $1.62 | 4d | 1 | 0.97mi |
| 1351 N Pleasant Dr Unit 1545831P Chandler, AZ | 1.0 | 1.0 | 990 | $2,029 | $2.05 | 13d | 1 | 0.98mi |
| 699 W Ray Rd #5 Chandler, AZ | 2.0 | 1.0 | 825 | $1,149 | $1.39 | 11d | 1 | 0.98mi |
| 860 N McQueen Rd #1073 Chandler, AZ | 2.0 | 2.5 | 1122 | $1,799 | $1.60 | 13d | 1 | 1.07mi |
| 1351 N Pleasant Dr Chandler, AZ | 2.0 | 1.5–2.0 | 1121 | $2,535 | $2.26 | 11d | 3 | 1.07mi |
| 1287 N Alma School Rd Chandler, AZ | 1.0–2.0 | 1.0–2.0 | 968 | $1,895 | $1.96 | 17d | 2 | 1.17mi |
| 859 W Ray Rd Apt 3 Chandler, AZ | 2.0 | 1.0 | 832 | $1,050 | $1.26 | 3d | 1 | 1.22mi |
| 859 W Ray Rd Apt 3 Chandler, AZ | 2.0 | 1.0 | 832 | $1,225 | $1.47 | 5d | 1 | 1.22mi |
| 859 W Ray Rd Apt 2 Chandler, AZ | 2.0 | 1.0 | 832 | $1,125 | $1.35 | 22d | 1 | 1.22mi |
| 859 W Ray Rd Apt 2 Chandler, AZ | 2.0 | 1.0 | 832 | $1,125 | $1.35 | 18d | 1 | 1.22mi |
| 498 N Arizona Ave Unit 7 Chandler, AZ | 2.0 | 1.0 | 800 | $1,900 | $2.38 | 44d | 1 | 1.23mi |
| 498 N Arizona Ave Unit 7 Chandler, AZ | 2.0 | 1.0 | 800 | $1,850 | $2.31 | 24d | 1 | 1.23mi |
| 418 N Colorado St Chandler, AZ | 3.0 | 1.0 | 964 | $1,950 | $2.02 | 24d | 1 | 1.29mi |
| 418 N Colorado St Chandler, AZ | 3.0 | 1.0 | 967 | $1,950 | $2.02 | 13d | 1 | 1.29mi |
| 774 E Carla Vista Dr Chandler, AZ | 3.0 | 2.0 | 1076 | $2,010 | $1.87 | 44d | 1 | 1.33mi |
| 373 N Nevada St Unit LCAM373-375 Chandler, AZ | 2.0 | 1.0 | 750 | $1,300 | $1.73 | 18d | 1 | 1.37mi |
| 1300 W Warner Rd Gilbert, AZ | 1.0–3.0 | 1.0–2.0 | 880 | $1,626 | $1.85 | 2d | 25 | 1.37mi |
| 501 E Erie St Chandler, AZ | 2.0 | 1.0 | 675 | $1,895 | $2.81 | 44d | 1 | 1.38mi |
| 501 E Erie St Unit B Chandler, AZ | 2.0 | 1.0 | 675 | $1,750 | $2.59 | 5d | 1 | 1.38mi |
| 337 N Colorado St Unit 100-102 Chandler, AZ | 2.0 | 2.0 | 900 | $2,250 | $2.50 | 44d | 1 | 1.40mi |
Listing history 21 events
-
2026-06-18days on market $77,700 Active 22 DOM
-
2026-06-17days on market $77,700 Active 21 DOM
-
2026-06-16days on market $77,700 Active 20 DOM
-
2026-06-15days on market $77,700 Active 19 DOM
-
2026-06-13days on market $77,700 Active 17 DOM
-
2026-06-13days on market $77,700 Active 16 DOM
-
2026-06-09days on market $77,700 Active 13 DOM
-
2026-06-08days on market $77,700 Active 12 DOM
-
2026-06-07days on market $77,700 Active 11 DOM
-
2026-06-04days on market $77,700 Active 8 DOM
-
2026-06-03days on market $77,700 Active 7 DOM
-
2026-06-02days on market $77,700 Active 6 DOM
-
2026-06-01days on market $77,700 Active 5 DOM
-
2026-05-31days on market $77,700 Active 4 DOM
-
2026-05-27$77,700 Active
-
2024-03-29soldstatus $40,000 Closed 333-char remark
Show marketing remark (333 chars)
***LOCATION LOCATION LOCATION***2 BEDROOM,2 FULL BATH, NEW DUAL PANE WINDOWS, CENTRAL AC,TANDEM 2 CAR COVERED PARKING,***LOT RENT $553.00***home is a quick drive to shops, restaurants and casinos. Generous amenities in this 55+ park include heated saltwater pool, spa, clubhouse, billiards, shuffleboard, Bingo, and group activities.
-
2024-03-06historical Under Contract Accepting Backups 333-char remark
Show marketing remark (333 chars)
***LOCATION LOCATION LOCATION***2 BEDROOM,2 FULL BATH, NEW DUAL PANE WINDOWS, CENTRAL AC,TANDEM 2 CAR COVERED PARKING,***LOT RENT $553.00***home is a quick drive to shops, restaurants and casinos. Generous amenities in this 55+ park include heated saltwater pool, spa, clubhouse, billiards, shuffleboard, Bingo, and group activities.
-
2024-02-21$42,000 Active 333-char remark
Show marketing remark (333 chars)
***LOCATION LOCATION LOCATION***2 BEDROOM,2 FULL BATH, NEW DUAL PANE WINDOWS, CENTRAL AC,TANDEM 2 CAR COVERED PARKING,***LOT RENT $553.00***home is a quick drive to shops, restaurants and casinos. Generous amenities in this 55+ park include heated saltwater pool, spa, clubhouse, billiards, shuffleboard, Bingo, and group activities.
-
2024-02-20soldstatus $40,000 Closed 333-char remark
Show marketing remark (333 chars)
***LOCATION LOCATION LOCATION***2 BEDROOM,2 FULL BATH, NEW DUAL PANE WINDOWS, CENTRAL AC,TANDEM 2 CAR COVERED PARKING,***LOT RENT $553.00***home is a quick drive to shops, restaurants and casinos. Generous amenities in this 55+ park include heated saltwater pool, spa, clubhouse, billiards, shuffleboard, Bingo, and group activities.
-
2024-02-13historical Under Contract Accepting Backups 333-char remark
Show marketing remark (333 chars)
***LOCATION LOCATION LOCATION***2 BEDROOM,2 FULL BATH, NEW DUAL PANE WINDOWS, CENTRAL AC,TANDEM 2 CAR COVERED PARKING,***LOT RENT $553.00***home is a quick drive to shops, restaurants and casinos. Generous amenities in this 55+ park include heated saltwater pool, spa, clubhouse, billiards, shuffleboard, Bingo, and group activities.
-
2024-01-29$42,000 Active 333-char remark
Show marketing remark (333 chars)
***LOCATION LOCATION LOCATION***2 BEDROOM,2 FULL BATH, NEW DUAL PANE WINDOWS, CENTRAL AC,TANDEM 2 CAR COVERED PARKING,***LOT RENT $553.00***home is a quick drive to shops, restaurants and casinos. Generous amenities in this 55+ park include heated saltwater pool, spa, clubhouse, billiards, shuffleboard, Bingo, and group activities.
ⓘ Source: listings_history table (triggers on properties + properties_extension) + one-shot
backfill from property_details.listing_events for pre-trigger history.
Climate risk First Street
- Flood 1/10 Low FEMA zone X (shaded) · 0% chance over 30 yrs
- Wildfire 1/10 Low
- Heat 9/10 Extreme 6 d/yr ≥111°F today · 15 d/yr by 30 yrs out
- Wind 1/10 Low
- Air quality 2/10 Low 0 unhealthy d/yr today · 1 by 30 yrs out
Nearby sold comps map
Loading sold comps map…
Walkable amenities ~0.75 mi
Loading nearby amenities…
Taxation est. · year 1
- Rental income
- $19,821
- − Mortgage interest
- −$4,352
- − Property taxes
- −$1,166
- − Insurance
- −$388
- − Repairs & maintenance
- −$1,586
- − Management
- −$1,586
- − Depreciation
- −$2,260
- Taxable income
- $8,483
- Est. tax owed @ 24.0%
- −$2,036
- After-tax cash flow
- $7,179/yr
For passive investors: Depreciation is non-cash, so a rental often shows a tax loss while cash-flowing — sheltering income. Rental losses are passive: they offset passive income freely, and up to $25,000/yr can offset ordinary (W-2) income if you actively participate and your MAGI is under $100k (phasing out to $0 by $150k); unused losses carry forward. On sale, claimed depreciation is recaptured at up to 25%, and gains may owe capital-gains tax (a 1031 exchange can defer both). Figures are a year-1 estimate at your 24.0% rate — not tax advice; consult a CPA.
Condition & rehab AI · 4 photos
This manufactured home requires moderate repairs and maintenance, including exterior siding, flooring, and windows. Upgrades to these areas would significantly enhance its resale and rental value.
Repairs flagged
- Major exterior siding — Significant wear and tear
- Major flooring — Worn carpet needs replacement
- Major windows — Older windows need replacement
Value-add opportunities
- Resale Paint exterior siding — Enhances curb appeal
- Resale Replace carpet — Fresh carpet improves comfort and value
- Resale Replace windows — Newer windows improve energy efficiency and appearance
Renovation cost estimate screening
| Repair item | Severity | Est. cost |
|---|---|---|
| exterior siding · Significant wear and tear | Major | $15,000–50,000 |
| flooring · Worn carpet needs replacement | Major | $15,000–50,000 |
| windows · Older windows need replacement | Major | $15,000–50,000 |
| Total estimated repair cost · 3 items | $45,000–150,000 |
Value-add ROI direction
- Resale Paint exterior siding — Enhances curb appeal ↑
- Resale Replace carpet — Fresh carpet improves comfort and value ↑
- Resale Replace windows — Newer windows improve energy efficiency and appearance ↑
ⓘ Cost ranges are severity-bucket heuristics (US national rule-of-thumb). Get contractor quotes + a written scope before underwriting a rehab budget.
Schools (NCES district)
- District
- Chandler Unified District #80 (4242)
- NCES district ID
- 0401870
- Math proficiency
- 49% ▼ -8.00%
- Reading proficiency
- 57% ▼ -2.00%
- Median HH income
- $74,048
- Composite
- 47.54/100
- National rank
- #2268
- State rank
- #31 of 249 in AZ
Livability — Chandler
- Score
- 78/100
- State rank
- #9
- US rank
- #2508
Category grades
Schools grade is shown separately in the Schools card above.
Census & demographics
- Census place
- Chandler, AZ
- County
- Maricopa County · 4,537,380 people
- City population
- 299,016
- Metro
- Phoenix-Mesa-Chandler, AZ
- Population (ZIP)
- 72,297
- Household income
- $88,676
- Rent vs Own
- Severe rent burden
- 2327.0
Population outlook (Maricopa County) Hauer SSP2
- Today (2025)
- 4,979,203 people
- By 2030
- 5,378,229 · +8.0%
- By 2040
- 6,156,598 · +23.6%
- By 2050
- 6,872,376 · +38.0%
- By 2075
- 8,401,270 · +68.7%
- By 2100
- 9,247,439 · +85.7%
Race, ethnicity, and origin ACS 2023
- Neighborhood character
- Diverse neighborhood (Simpson 0.65)
- Race & ethnicity
- White 48% Hispanic / Latino 34% Two or more races 16% Black 7% Asian 6% Native American 2%
- Hispanic origin (detail)
- Mexican 29% Puerto Rican 1%
- Common ancestry
- Romanian 2% Lithuanian 2% Portuguese 1%
- Foreign-born
- 16% · Canada, Vietnam, China
- Languages at home
- 72% English-only · Spanish 21% Vietnamese 1% Chinese 1%
Political lean MEDSL · Maricopa
- 2024 margin
- Toss-up / Even · D 47.7% · R 51.2% · Other 1.1%
- 2008→2024 swing
- +7.1pp toward D · 2008: -10.6pp · 2024: -3.5pp
- All cycles
- 2024: R+3.5 2020: D+2.2 2016: R+3.5 2012: R+12.0 2008: R+10.6
Not yet ingested
- Civics
- —
Market trends
- HPI YoY
- ▼ -128.25%
- Current HPI
- 328.8354
- Rent YoY
- ▼ -1.66%
- Metro
- Phoenix-Mesa-Chandler, AZ
- State GDP YoY
- ▲ 4.54%
- F500 in state
- 20
Industry mix (Fortune 500 HQ in AZ)
| Industry | F500 HQs | Revenue |
|---|---|---|
| Technology | 2 | $13B |
|
||
| Mining / Metals | 1 | $23B |
|
||
| Environmental Services | 1 | $16B |
|
||
| Metals / Steel | 1 | $14B |
|
||
| Technology Distribution | 1 | $9B |
|
||
| Homebuilding | 1 | $8B |
|
||
Price history
+85.0% since first listed7 events — show timeline
- 2026-05-27 Listed $77,700 ARMLS
- 2024-03-29 Sold (MLS) $40,000 ARMLS
- 2024-03-06 Contingent — ARMLS
- 2024-02-21 Listed $42,000 ARMLS
- 2024-02-20 Sold (MLS) $40,000 ARMLS
- 2024-02-13 Contingent — ARMLS
- 2024-01-29 Listed $42,000 ARMLS
Cash-flow waterfall
monthlySold comps — $/sqft
last 12 mo · ≤1 miLoading sold comps…