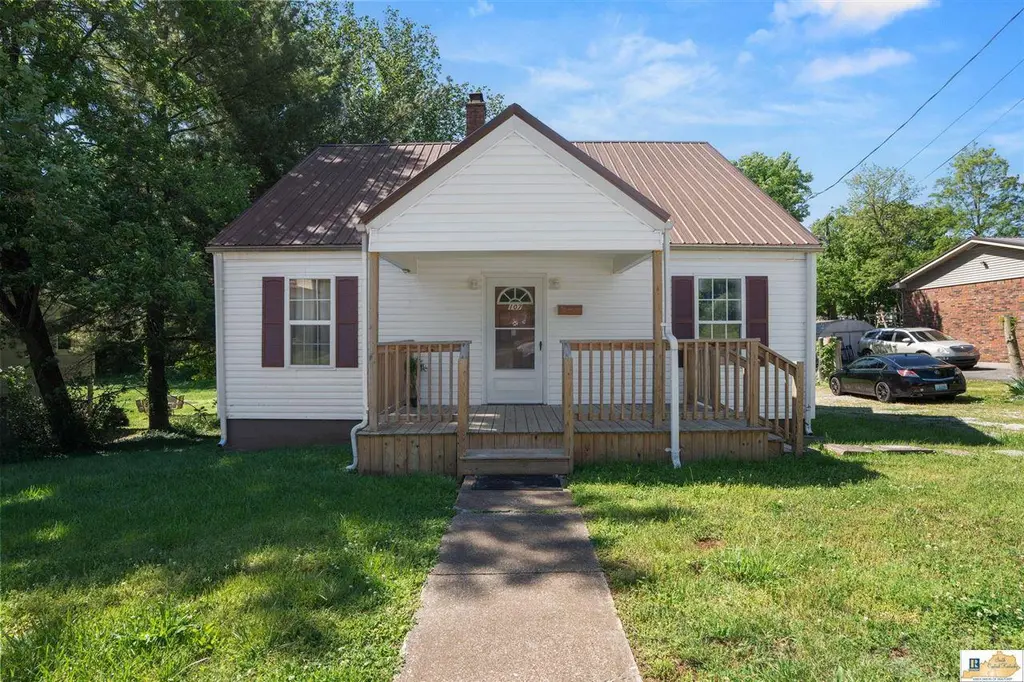
107 W Main St · Horse Cave, KY
Flood risk 1/10 · Minimal
- FEMA flood zone
- X (unshaded)
- Chance of flooding over 30 yrs
- 0.0%
- Est. flood insurance / yr
- $473 – $860
Fire risk 3/10 · Minor
- Est. fire insurance / yr
- $839 – $1,559
Heat risk 5/10 · Moderate
- Hot days now (above 106°F)
- 7 days/yr
- Hot days in 30 yrs
- 20 days/yr
Wind risk 3/10 · Minor
- Chance of severe wind over 30 yrs
- 5.0%
Air-quality risk 2/10 · Minimal
- Unhealthy air days now
- 0 days/yr
- Unhealthy air days in 30 yrs
- 1 days/yr
Risk factors via First Street. Map © Google.
Why this score? — see what drove the D- grade
The composite is a weighted blend of 9 inputs, each scored 0–100. Each bar is that input's sub-score; the figure is the points it added to the 100-point composite (weight × sub-score).
- Cash flow +11.6/30.0
- Appreciation +10.0/10.0
- DSCR +3.4/10.0
- Livability +3.4/5.0
- Rent growth +2.5/5.0
- Condition / age +2.5/5.0
- 1% rule +2.1/10.0
- Schools +1.5/10.0
- ARV discount +0.0/15.0
$159,000
🖨 Deal sheet (PDF) 📄 Offer letter ✓ Due diligence
Listing remarks
Turnkey Downtown Horse Cave Gem – Fully Furnished & Income Ready! Welcome to 107 W Main Street, a charming and versatile home located in the heart of Horse Cave! Offering generous living space with 3 bedrooms and 1 bath, this property blends character, functionality, and opportunity all in one. Step inside to find a flexible layout with multiple living areas and plenty of room to relax or entertain. Whether you’re looking for a primary residence, weekend getaway, or investment property, this home delivers. Investor Alert: This property was most recently used as a successful Airbnb and comes fully furnished, making it truly turnkey and ready to generate income from day on
Key facts
- Spacious yard
- Flexible layout
- Income ready
Tags
Property features AI
Exterior
- Parking: 2-car garage
- Utilities: Public water
- Home design: Single family residence; Residential property
- Construction: Vinyl siding; Shingle roof; Has basement
- Exterior features: Front porch; Outbuilding on the property
Interior
- Kitchen: Microwave, Range, Oven, Refrigerator; Electric water heater
- Flooring: Hardwood; Laminate
- Bathrooms: One full bathroom (main level)
- Heating & cooling: Central heating (electric); Central air conditioning
- Interior features: Dryer, Washer, Microwave, Range, Oven, Refrigerator, Electric water heater; Unfinished basement; Laundry room
- Laundry & utility: Washer and Dryer in laundry room
Neighborhood map
What this means for you Summary
Snapshot
- This is a 2-bed/1.0-bath single-family listed at $159k.
Deal economics
- At list price, monthly cash flow is $-50 ($-605/yr) — negative.
- To cash-flow at today's rent, offer at most $150k (5.6% below list).
- To meet the 1% rule (rent ≥ 1% of price), the offer needs to be $113k (28.7% below list).
- Recommended offer: $113k (28.7% below list) — sets the bar for 1% rule.
- Cap rate 5.9% vs local median 3.7% in Horse Cave — top-decile yield for the area; either an underpriced asset or a hidden risk that comps aren't pricing in. Stress-test before assuming the spread holds.
Location & tenants
- Location reads 67/100 on livability (#206 in KY) — a middle-class / working-renter tenant base. Strengths: crime A+, cost of living A+, housing A+; Watch: amenities F, commute F, employment D-.
- Caverna Independent (rural): math 10% / reading 27% proficiency, ranked #165 of 165 in KY (top 100%) — low school quality limits family demand, transient renter base, plan for 1-2y turnover; 73% free/reduced lunch — lower-income household profile, screen leases tightly.
- Zoned schools: Caverna Elementary School (math 8% / reading 12%, grade F, #648 of 676 statewide, top 98%, 310 students, 78% FRL); Caverna Middle School (math 8% / reading 37%, grade F, #202 of 217 statewide, top 93%, 129 students, 82% FRL); Caverna High School (math 24% / reading 34%, grade F, #127 of 254 statewide, top 58%, 208 students, 78% FRL).
- Market conditions: 56 active listings in the ZIP; 79 units permitted in Hart County in 2024 (60 in 5+ unit buildings).
Forward outlook
- In year one you build about $17k of equity ($1k loan paydown + $16k appreciation (10.0% local appreciation)).
- At projected returns (10.0% appreciation + 3.0% rent growth), your $45k cash investment doubles in ~3 years — after that, you're playing with house money.
- By year 3, paydown + projected appreciation supports a ~$43k cash-out refi (75% LTV) — recoverable capital for the next deal without selling this one.
Negotiation context
- It's been on market 52 days — a 3% lower offer ($154k) is reasonable based on typical stale-listing flexibility.
- Current owner paid $17k; list at $159k implies a 835% gain — meaningful room to come down on a strong offer.
Risks & watch-outs
- Watch-outs: built in 1940 — expect roof / HVAC / electrical / plumbing capex.
- Climate carrying-cost: extreme-heat days projected 7→20/yr by 2055 (HVAC capex compounding) — expect insurance premiums to compound above CPI over the hold.
Questions for the listing agent
- What do current leases actually rent for vs. the listed asking? Can we see a recent rent roll and the last 12 months of T-12 income?
- It's been on market 52 days. Have you received any prior offers? Is the seller open to a 29% concession, seller financing, or rate buy-down credit?
- Built in 1940 — when were the roof, HVAC, electrical panel, plumbing, and water heater last replaced?
- Is there a deadline driving the sale (1031 exchange, divorce, estate, relocation)? That informs how much negotiation room exists.
- Schools are F-rated, which usually means shorter tenancies and higher turnover. Who's the typical renter profile here, and what's been the actual vacancy rate?
- The area grade is low — what's the realistic commute time and amenity access for the typical tenant pool here? Any planned neighborhood developments (good or bad) we should know about?
- What's the average days-on-market for RENTAL listings here right now (not sales)? A rising rental-DOM trend means longer vacancies and softer asking-rent achievability than the comps imply.
- What's the recent tenant-quality profile in this submarket — average credit score on applications, eviction rate, late-payment / NSF rate, and stable-employment percentage? A property-management company in the area should have these aggregated.
- How much new for-sale + rental construction is in the pipeline within 1–3 miles? Heavy new supply typically softens prices + rents 12–24 months out; constrained supply supports both.
Investment metrics
- 1% rule
- 0.71% ✗
- Cap rate
- 5.91%
- Cash-on-cash
- -1.36%
- DSCR
- 0.94
- GRM
- 11.7
CMA / ARV
- ARV (on-the-fly)
- $111,520
- Comps found
- 3
Show comp detail 3 sales within ~0.75 mi
| Address | Dist | Beds/Ba | Sqft | Sold | Price | $/sf | Match |
|---|---|---|---|---|---|---|---|
| 240 Old Dixie Hwy | 0.28mi | 3/1.0 (+1) | 1,276 (-6%) | 6mo | $13,500 | $11 | 67 |
| 302 Green St | 0.65mi | 3/2.0 (+1) | 1,260 (-7%) | 2mo | $180,000 | $143 | 47 |
| 211 Green St | 0.66mi | 3/1.0 (+1) | 1,336 (-2%) | 18mo | $110,000 | $82 | 46 |
Match score weights: distance 35% · size 25% · config 20% · recency 20%. Top-matched comps best support the ARV.
Projected returns pro-forma
10.0% appreciation · 3.0% rent growth · sell at horizon
- IRR
- 23.3%
- Equity multiple
- 2.87×
- Total profit
- $83,309
- Equity at exit
- $143,240
- IRR
- 20.7%
- Equity multiple
- 6.56×
- Total profit
- $247,704
- Equity at exit
- $308,902
Cash invested: $44,520 (down + closing). Projections, not guarantees.
Landlord ↔ Tenant lean methodology
- Overall (STATE)
- 83 Strongly Landlord-Friendly
- State Kentucky
- 83 Strongly Landlord-Friendly · R+16
- County
- — inherits STATE
- City
- — inherits STATE
ZIP-level market 42749
- Home prices YoY
- 13.5%
- Active inventory
- 56
- Price-to-rent
- 11.7×
Monthly cashflow live
- Estimated rent
- $1,134 medium interval (Pro) →
- Mortgage (P&I)
- −$834
- Tax from tax record
- −$46 /mo · $555/yr
- Insurance
- −$66
- HOA
- −$0
- Vacancy / Maint / Mgmt
- −$238
- Net cashflow
- $-50
Break-even live
Sensitivity live
| Price | -10% $40 | -5% $-5 | +0% $-50 | +5% $-95 | +10% $-140 |
|---|---|---|---|---|---|
| Rent | -10% $-140 | -5% $-95 | +0% $-50 | +5% $-6 | +10% $39 |
| Rate | -1.0pp $30 | -0.5pp $-10 | base $-50 | +0.5pp $-92 | +1.0pp $-134 |
UW: 25.0% down · 7.5% · 30yr · 1.5% tax · 5.0% vac · 8.0% maint · 8.0% mgmt
Financing live
Cash to close
- Down payment
- $39,750
- Closing costs
- $4,770
- Reserves months
- —
- Total cash needed
- —
Loan-product check · same deal, 3 products live
Conventional
25% down · 7.5% · 30yr
- Down + closing
- —
- Monthly P&I
- —
- Monthly cashflow
- —
- DSCR
- —
- Eligible?
- —
Personal DTI + credit; lowest rate.
DSCR
20% down · 8.5% · 30yr
- Down + closing
- —
- Monthly P&I
- —
- Monthly cashflow
- —
- DSCR
- —
- Eligible?
- —
No personal income docs; deal must DSCR.
Hard money
10% down · 12.0% · 12mo
- Down + closing
- —
- Monthly P&I
- —
- Monthly cashflow
- —
- DSCR
- —
- Eligible?
- —
Short-term bridge; refi at stabilization.
Listing history 20 events
-
2026-06-22days on market $159,000 Active 52 DOM
-
2026-06-21days on market $159,000 Active 51 DOM
-
2026-06-21days on market $159,000 Active 50 DOM
-
2026-06-18days on market $159,000 Active 48 DOM
-
2026-06-17days on market $159,000 Active 47 DOM
-
2026-06-16days on market $159,000 Active 46 DOM
-
2026-06-15days on market $159,000 Active 45 DOM
-
2026-06-13days on market $159,000 Active 43 DOM
-
2026-06-12days on market $159,000 Active 42 DOM
-
2026-06-09days on market $159,000 Active 39 DOM
-
2026-06-08days on market $159,000 Active 38 DOM
-
2026-06-07days on market $159,000 Active 37 DOM
-
2026-06-07days on market $159,000 Active 36 DOM
-
2026-06-04days on market $159,000 Active 33 DOM
-
2026-06-02days on market $159,000 Active 32 DOM
-
2026-06-01days on market $159,000 Active 31 DOM
-
2026-05-31days on market $159,000 Active 30 DOM
-
2026-05-31days on market $159,000 Active 29 DOM
-
2026-04-14$159,000 Active
-
2000-09-01soldstatus $17,000
ⓘ Source: listings_history table (triggers on properties + properties_extension) + one-shot
backfill from property_details.listing_events for pre-trigger history.
Tax reassessment forecast KY · Resets to sale price
- Current annual tax
- $555 · $46/mo
- Projected year-2 tax
- $1,367 · $114/mo
- Expected delta
- +$812/yr (+$68/mo · 146.4%)
ⓘ Screening estimate from a state-policy table — verify with the county assessor before closing.
Climate risk First Street
- Flood 1/10 Low FEMA zone X (unshaded) · 0% chance over 30 yrs
- Wildfire 3/10 Moderate
- Heat 5/10 Major 7 d/yr ≥106°F today · 20 d/yr by 30 yrs out
- Wind 3/10 Moderate 5% chance of damaging wind over 30 yrs
- Air quality 2/10 Low 0 unhealthy d/yr today · 1 by 30 yrs out
Nearby sold comps map
Loading sold comps map…
Walkable amenities ~0.75 mi
Loading nearby amenities…
Taxation est. · year 1
- Rental income
- $13,609
- − Mortgage interest
- −$8,906
- − Property taxes
- −$555
- − Insurance
- −$795
- − Repairs & maintenance
- −$1,089
- − Management
- −$1,089
- − Depreciation
- −$4,625
- Taxable loss
- −$3,451
- Est. tax savings @ 24.0%
- +$828
- After-tax cash flow
- $223/yr
For passive investors: Depreciation is non-cash, so a rental often shows a tax loss while cash-flowing — sheltering income. Rental losses are passive: they offset passive income freely, and up to $25,000/yr can offset ordinary (W-2) income if you actively participate and your MAGI is under $100k (phasing out to $0 by $150k); unused losses carry forward. On sale, claimed depreciation is recaptured at up to 25%, and gains may owe capital-gains tax (a 1031 exchange can defer both). Figures are a year-1 estimate at your 24.0% rate — not tax advice; consult a CPA.
Schools (NCES district)
- District
- Caverna Independent
- NCES district ID
- 2101110
- Math proficiency
- 10% ▼ -20.00%
- Reading proficiency
- 27% ▼ -21.00%
- Median HH income
- $30,215
- Composite
- 14.71/100
- National rank
- #9399
- State rank
- #165 of 165 in KY
Livability — Horse Cave
- Score
- 67/100
- State rank
- #206
- US rank
- #10135
Category grades
Schools grade is shown separately in the Schools card above.
Census & demographics
- Census place
- Horse Cave, KY
- Population (ZIP)
- 4,835
Population outlook (Hart County) Hauer SSP2
- Today (2025)
- 18,897 people
- By 2030
- 19,008 · +0.6%
- By 2040
- 19,032 · +0.7%
- By 2050
- 18,584 · -1.7%
- By 2075
- 17,303 · -8.4%
- By 2100
- 14,894 · -21.2%
Race, ethnicity, and origin ACS 2023
- Neighborhood character
- Predominantly White (79%)
- Race & ethnicity
- White 79% Black 15% Two or more races 5% Hispanic / Latino 2%
- Common ancestry
- Slovak 2% Polish 1% Italian 1%
- Foreign-born
- 1%
- Languages at home
- 96% English-only · German/W. Germanic 2% Other Asian/Pacific 1% Spanish 1%
Political lean MEDSL · Hart
- 2024 margin
- Solid R (+60.0) · D 19.5% · R 79.6%
- 2008→2024 swing
- -29.1pp toward R · 2008: -30.9pp · 2024: -60.0pp
- All cycles
- 2024: R+60.0 2020: R+53.0 2016: R+49.4 2012: R+29.8 2008: R+30.9
Not yet ingested
- Civics
- —
Market trends
- HPI YoY
- ▲ 40.99%
- Current HPI
- 344.9104
- Rent YoY
- —
- Metro
- —
- State GDP YoY
- ▲ 1.81%
- F500 in state
- 4
Industry mix (Fortune 500 HQ in KY)
| Industry | F500 HQs | Revenue |
|---|---|---|
| Healthcare | 1 | $118B |
|
||
| Food / Beverage | 1 | $7B |
|
||
Price history
+835.3% since first listed2 events — show timeline
- 2026-04-14 Listed $159,000 SCKMLSKY
- 2000-09-01 Sold (Public Records) $17,000 Public Records
Property tax history
+3.7%/yrLatest (2025): $555 · +49.9% YoY. Source: county tax records.
Cash-flow waterfall
monthlySold comps — $/sqft
last 12 mo · ≤1 miLoading sold comps…