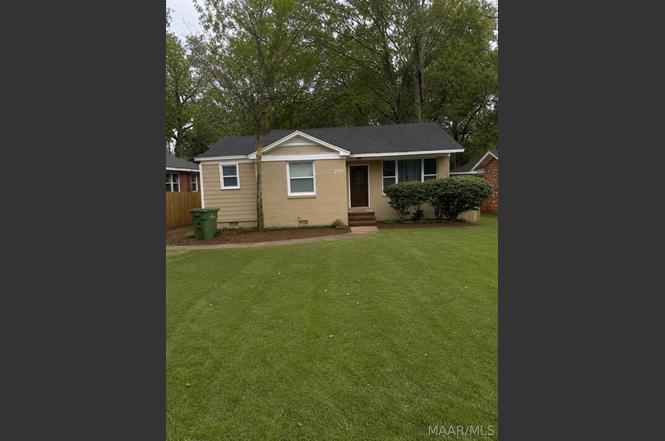
2454 Woodlawn St · Montgomery, AL
Flood risk 1/10 · Minimal
- FEMA flood zone
- X (unshaded)
- Chance of flooding over 30 yrs
- 0.0%
- Est. flood insurance / yr
- $507 – $1,088
Fire risk 1/10 · Minimal
- Est. fire insurance / yr
- $916 – $1,700
Heat risk 7/10 · Major
- Hot days now (above 107°F)
- 7 days/yr
- Hot days in 30 yrs
- 20 days/yr
Wind risk 8/10 · Major
- Chance of severe wind over 30 yrs
- 80.0%
Air-quality risk 3/10 · Minor
- Unhealthy air days now
- 4 days/yr
- Unhealthy air days in 30 yrs
- 4 days/yr
Risk factors via First Street. Map © Google.
Why this score? — see what drove the C+ grade
The composite is a weighted blend of 9 inputs, each scored 0–100. Each bar is that input's sub-score; the figure is the points it added to the 100-point composite (weight × sub-score).
- Cash flow +29.2/30.0
- DSCR +10.0/10.0
- 1% rule +7.0/10.0
- ARV discount +6.8/15.0
- Rent growth +4.1/5.0
- Livability +3.2/5.0
- Condition / age +2.5/5.0
- Schools +1.7/10.0
- Appreciation +0.0/10.0
$115,000
🖨 Deal sheet 📄 Offer letter ✓ Due diligence
Listing remarks MLS
YOU LOOKING FOR AN INVESTMENT OPPURTUNITY? WELL, THIS PROPERTY MAY BE FOR YOU. PROPERTY HAS A CONVENTIONAL FOUNDATION, WITH WOOD AND MASONITE SIDING, DRIVEWAY, PARTIAL FENCE, LIVING ROOM, DINING ROOM, KITCHEN, THREE BEDROOMS AND ONE FULL BATH. CONDITION AND TYPE OF SYSTEMS UNKNOWN. BUYER TO VERIFY SCHOOL ZONES IF NEEDED. PLEASE "DO NOT" USE SHOWING TIME, PROPERTY IS VACANT.
Key facts
- Renovated home
- New sinks
- New kitchen flooring
Tags
Property features AI
Exterior
- Parking: Driveway
- Utilities: Electricity available; Natural gas available; High-speed internet available; Public water; Public sewer
- Home design: Single-story home
- Construction: Masonite and wood siding; Year built per public records
- Exterior features: City lot; Mature trees
Interior
- Flooring: Laminate
- Bathrooms: 1 full bathroom
- Interior features: Laminate flooring
- Laundry & utility: Water heater
Neighborhood map
What this means for you Summary
Snapshot
- This is a 3-bed/1.0-bath single-family listed at $115k.
Deal economics
- At list price, monthly cash flow is $401 ($5k/yr) — positive.
- The deal already cash-flows at list — no discount required.
- Meets the 1% rule at list price ($1k rent vs $115k).
- Cap rate 10.5% vs local median 6.0% in Montgomery — top-decile yield for the area; either an underpriced asset or a hidden risk that comps aren't pricing in. Stress-test before assuming the spread holds.
Location & tenants
- Location reads 65/100 on livability (#138 in AL) — a middle-class / working-renter tenant base. Strengths: cost of living A+, housing A+; Watch: schools C-, employment D, crime F.
- Montgomery County (urban): math 9% / reading 31% proficiency, ranked #106 of 129 in AL (top 82%) — low school quality limits family demand, transient renter base, plan for 1-2y turnover; 70% free/reduced lunch — lower-income household profile, screen leases tightly.
- Market conditions: Rents rising fast (+6.3%/yr); 137 active listings in the ZIP; 40 comparable units currently listed for rent nearby; rentals lingering (median 44d on market — plan ~5-8 weeks vacancy on turnover, expect pricing pressure); 52% of comp listings sitting > 30 days — soft ceiling on asking rent; 460 units permitted in Montgomery County in 2024 (37 in 5+ unit buildings).
Forward outlook
- Local home prices are declining (-3.0%/yr); year-one equity from $795 of loan paydown is wiped out by about $3k of value loss. Plan a longer hold.
- Montgomery County population projected to shrink 8% by 2050 — rents likely to lag national; underwrite the cash flow, not the appreciation.
- At projected returns (-3.0% appreciation + 6.3% rent growth), your $32k cash investment doubles in ~7 years — after that, you're playing with house money.
Negotiation context
- Only 4 days on market — expect competitive offers; lowballing is unlikely to land.
- 12 sale attempts since 25y ago with the ask held roughly flat each time — persistent listings suggest the price (not the market) is what's stuck; bring a comps-based counter.
- Current owner paid $30k; list at $115k implies a 280% gain — meaningful room to come down on a strong offer.
Risks & watch-outs
- Watch-outs: built in 1952 — expect roof / HVAC / electrical / plumbing capex.
- Climate carrying-cost: severe wind risk, 80% chance of damaging wind over 30y; extreme-heat days projected 7→20/yr by 2055 (HVAC capex compounding) — expect insurance premiums to compound above CPI over the hold.
Questions for the listing agent
- Built in 1952 — when were the roof, HVAC, electrical panel, plumbing, and water heater last replaced?
- Is there a deadline driving the sale (1031 exchange, divorce, estate, relocation)? That informs how much negotiation room exists.
- Crime grade is F in this area — have there been break-ins, vandalism, or insurance claims at this property in the last 3 years? What carrier currently insures it and at what premium?
- What's the average days-on-market for RENTAL listings here right now (not sales)? A rising rental-DOM trend means longer vacancies and softer asking-rent achievability than the comps imply.
- What's the recent tenant-quality profile in this submarket — average credit score on applications, eviction rate, late-payment / NSF rate, and stable-employment percentage? A property-management company in the area should have these aggregated.
- How much new for-sale + rental construction is in the pipeline within 1–3 miles? Heavy new supply typically softens prices + rents 12–24 months out; constrained supply supports both.
Investment metrics
- 1% rule
- 1.20% ✓
- Cap rate
- 10.48%
- Cash-on-cash
- 14.95%
- DSCR
- 1.67
- GRM
- 6.9
CMA / ARV
- ARV (on-the-fly)
- $113,319
- Comps found
- 12
Show comp detail 12 sales within ~0.75 mi
| Address | Dist | Beds/Ba | Sqft | Sold | Price | $/sf | Match |
|---|---|---|---|---|---|---|---|
| 2045 Gorgas St | 0.18mi | 3/1.0 | 1,337 (-4%) | 0mo | $120,000 | $90 | 84 |
| 1934 Gorgas St | 0.12mi | 2/2.0 (-1) | 1,347 (-4%) | 2mo | $139,504 | $104 | 78 |
| 1820 Robison Hill Rd | 0.36mi | 3/2.0 | 1,423 (+2%) | 9mo | $115,000 | $81 | 69 |
| 1955 Gorgas St | 0.09mi | 2/2.0 (-1) | 1,536 (+10%) | 2mo | $150,000 | $98 | 69 |
| 1458 Watson Ave | 0.57mi | 3/2.0 | 1,412 (+1%) | 1mo | $160,000 | $113 | 67 |
| 2468 Spruce Cur Curv | 0.33mi | 3/1.0 | 1,263 (-10%) | 6mo | $10,000 | $8 | 64 |
| 1728 Robison Hill Rd | 0.29mi | 3/2.0 | 1,574 (+12%) | 1mo | $65,500 | $42 | 61 |
| 1701 Sylvan Dr | 0.45mi | 3/1.0 | 1,288 (-8%) | 9mo | $126,000 | $98 | 58 |
| 1474 Watson Ave | 0.55mi | 3/2.0 | 1,472 (+5%) | 7mo | $107,000 | $73 | 56 |
| 2121 E 3rd St | 0.46mi | 3/1.0 | 1,600 (+14%) | 4mo | $15,000 | $9 | 52 |
| 2739 Green Oaks Dr | 0.39mi | 3/2.0 | 1,572 (+12%) | 9mo | $122,000 | $78 | 50 |
| 1813 W 3rd St | 0.63mi | 2/1.0 (-1) | 1,218 (-13%) | 6mo | $38,000 | $31 | 40 |
Match score weights: distance 35% · size 25% · config 20% · recency 20%. Top-matched comps best support the ARV.
Projected returns pro-forma
-3.0% appreciation · 6.29% rent growth · sell at horizon
- IRR
- 8.9%
- Equity multiple
- 1.36×
- Total profit
- $11,614
- Equity at exit
- $17,147
- IRR
- 20.5%
- Equity multiple
- 2.98×
- Total profit
- $63,644
- Equity at exit
- $9,943
Cash invested: $32,200 (down + closing). Projections, not guarantees.
Landlord ↔ Tenant lean methodology
- Overall (STATE)
- 90 Strongly Landlord-Friendly
- State Alabama
- 90 Strongly Landlord-Friendly · R+15
- County
- — inherits STATE
- City
- — inherits STATE
ZIP-level market 36106
- Home prices YoY
- -13.1%
- Rents YoY
- 6.3%
- Active inventory
- 137
- Price-to-rent
- 6.9×
Monthly cashflow live
- Estimated rent
- $1,385 high interval (Pro) →
- Mortgage (P&I)
- −$603
- Tax from tax record
- −$42 /mo · $503/yr
- Insurance
- −$48
- HOA
- −$0
- Vacancy / Maint / Mgmt
- −$291
- Net cashflow
- $401
Break-even live
UW: 25.0% down · 7.5% · 30yr · 1.5% tax · 5.0% vac · 8.0% maint · 8.0% mgmt
Financing live
Cash to close
- Down payment
- $28,750
- Closing costs
- $3,450
- Reserves months
- —
- Total cash needed
- —
Loan-product check · same deal, 3 products live
Conventional
25% down · 7.5% · 30yr
- Down + closing
- —
- Monthly P&I
- —
- Monthly cashflow
- —
- DSCR
- —
- Eligible?
- —
Personal DTI + credit; lowest rate.
DSCR
20% down · 8.5% · 30yr
- Down + closing
- —
- Monthly P&I
- —
- Monthly cashflow
- —
- DSCR
- —
- Eligible?
- —
No personal income docs; deal must DSCR.
Hard money
10% down · 12.0% · 12mo
- Down + closing
- —
- Monthly P&I
- —
- Monthly cashflow
- —
- DSCR
- —
- Eligible?
- —
Short-term bridge; refi at stabilization.
Rent comps 40 comps
| Address | Beds | Baths | Sqft | Rent | $/sqft | DOM | Units | Dist |
|---|---|---|---|---|---|---|---|---|
| 2014 Commodore St Montgomery, AL | 3.0 | 2.0 | 1613 | $1,450 | $0.90 | 13d | 1 | 0.09mi |
| 2045 Bullard St Unit 1043526P Montgomery, AL | 3.0 | 2.0 | 1797 | $2,198 | $1.22 | 43d | 1 | 0.19mi |
| 2454 Spruce Curv Montgomery, AL | 3.0 | 1.0 | 988 | $1,100 | $1.11 | 43d | 1 | 0.29mi |
| 2205 E 5th St Montgomery, AL | 3.0 | 1.0 | 1020 | $800 | $0.78 | 43d | 1 | 0.30mi |
| 2226 Carter Hill Rd Montgomery, AL | 2.0 | 1.0 | 1506 | $905 | $0.60 | 43d | 1 | 0.30mi |
| 1842 Gillespie Dr Montgomery, AL | 4.0 | 2.0 | 1620 | $1,650 | $1.02 | 43d | 1 | 0.33mi |
| 1814 Pinecrest Dr Montgomery, AL | 3.0 | 1.0 | 1053 | $990 | $0.94 | 43d | 1 | 0.38mi |
| 1839 Robison Hill Rd Montgomery, AL | 4.0 | 2.0 | 1370 | $1,550 | $1.13 | 21d | 1 | 0.44mi |
| 2736 Chevy Chase Dr Montgomery, AL | 3.0 | 1.0 | 1100 | $1,300 | $1.18 | 43d | 1 | 0.48mi |
| 2020 E 3rd St Montgomery, AL | 2.0 | 1.0 | 1186 | $750 | $0.63 | 21d | 1 | 0.50mi |
| 1425 Blairwood Montgomery, AL | 3.0 | 2.0 | 1700 | $1,850 | $1.09 | 13d | 1 | 0.58mi |
| 1450 Crenshaw Pl S Montgomery, AL | 3.0 | 2.0 | 1641 | $1,775 | $1.08 | 43d | 1 | 0.62mi |
| 1814 Sylvan Dr Montgomery, AL | 3.0 | 2.0 | 1785 | $1,400 | $0.78 | 21d | 1 | 0.63mi |
| 2845 Zelda Rd Montgomery, AL | 2.0 | 2.0 | 1013 | $1,042 | $1.03 | 13d | 3 | 0.68mi |
| 1347 Felder Ave Montgomery, AL | 2.0 | 1.0 | 1000 | $1,095 | $1.09 | 13d | 1 | 0.69mi |
| 1343 Felder Ave Montgomery, AL | 2.0 | 1.0 | 1000 | $1,095 | $1.09 | 13d | 1 | 0.69mi |
| 3136 Harrison Rd Montgomery, AL | 3.0 | 1.5 | 1355 | $1,025 | $0.76 | 43d | 1 | 0.79mi |
| 2000 Cherry St Montgomery, AL | 2.0 | 1.0 | 1106 | $950 | $0.86 | 43d | 1 | 0.84mi |
| 3318 Habersham Rd Montgomery, AL | 3.0 | 2.0 | 1134 | $1,250 | $1.10 | 13d | 1 | 0.94mi |
| 2727 Boultier St Montgomery, AL | 1.0–3.0 | 1.0–2.0 | 1070 | $1,582 | $1.48 | 13d | 3 | 0.97mi |
| 3323 Bedford Ln Montgomery, AL | 3.0 | 2.0 | 1134 | $1,200 | $1.06 | 21d | 1 | 1.06mi |
| 2009 Palmetto St Montgomery, AL | 3.0 | 1.0 | 1487 | $1,050 | $0.71 | 43d | 1 | 1.07mi |
| 3346 Bedford Ln Montgomery, AL | 3.0 | 1.0 | 1134 | $1,295 | $1.14 | 13d | 1 | 1.09mi |
| 3359 Bedford Ln Montgomery, AL | 4.0 | 2.0 | 1786 | $1,600 | $0.90 | 13d | 1 | 1.12mi |
| 1216 Karen Rd Montgomery, AL | 3.0 | 2.0 | 1620 | $1,350 | $0.83 | 13d | 1 | 1.20mi |
| 311 Bradley Dr Montgomery, AL | 3.0 | 1.0 | 1104 | $825 | $0.75 | 43d | 1 | 1.21mi |
| 906 E Fairview Ave Unit 902 Montgomery, AL | 2.0 | 1.0 | 1100 | $995 | $0.90 | 21d | 1 | 1.22mi |
| 1229 Karen Rd Montgomery, AL | 4.0 | 2.0 | 1344 | $1,590 | $1.18 | 43d | 1 | 1.22mi |
| 1117 Karen Rd Montgomery, AL | 3.0 | 1.0 | 1308 | $1,195 | $0.91 | 43d | 1 | 1.29mi |
| 1154 Lakewood Dr Montgomery, AL | 3.0 | 2.0 | 1066 | $1,350 | $1.27 | 43d | 1 | 1.30mi |
| 926 Green Ridge Ct Montgomery, AL | 3.0 | 2.0 | 1665 | $1,381 | $0.83 | 13d | 1 | 1.31mi |
| 2113 Brewton St Montgomery, AL | 3.0 | 1.0 | 1363 | $1,150 | $0.84 | 43d | 1 | 1.31mi |
| 3356 Audubon Rd Montgomery, AL | 2.0 | 1.5 | 1340 | $950 | $0.71 | 43d | 1 | 1.34mi |
| 3456 Harrison Rd Montgomery, AL | 3.0 | 1.0 | 1008 | $1,300 | $1.29 | 43d | 1 | 1.35mi |
| 519 Thorn Pl Montgomery, AL | 2.0 | 1.0 | 1632 | $650 | $0.40 | 21d | 1 | 1.39mi |
| 2004 Capitol Ave Unit 1043879P Montgomery, AL | 4.0 | 2.5 | 1797 | $3,518 | $1.96 | 13d | 1 | 1.40mi |
| 128 S Capitol Pkwy Montgomery, AL | 3.0 | 1.0 | 1550 | $1,500 | $0.97 | 43d | 1 | 1.41mi |
| 122 Oak Forest Dr Montgomery, AL | 3.0 | 1.0 | 1092 | $975 | $0.89 | 21d | 1 | 1.41mi |
| 3256 Montezuma Rd Montgomery, AL | 3.0 | 2.0 | 1515 | $1,450 | $0.96 | 43d | 1 | 1.43mi |
| 428 Thorn Pl Montgomery, AL | 2.0 | 1.0 | 1549 | $1,450 | $0.94 | 43d | 1 | 1.45mi |
Listing history 5 events
-
2026-06-18days on market $115,000 Active 4 DOM
-
2026-06-17days on market $115,000 Active 3 DOM
-
2026-06-16days on market $115,000 Active 2 DOM
-
2026-06-15remarks 620-char remark
-
2026-06-15$115,000 Active 1 DOM
ⓘ Source: listings_history table (triggers on properties + properties_extension) + one-shot
backfill from property_details.listing_events for pre-trigger history.
Tax reassessment forecast AL · Resets to sale price
- Current annual tax
- $503 · $42/mo
- Projected year-2 tax
- $503 · $42/mo
- Expected delta
- $0/yr ($0/mo · 0.0%)
ⓘ Screening estimate from a state-policy table — verify with the county assessor before closing.
Climate risk First Street
- Flood 1/10 Low FEMA zone X (unshaded) · 0% chance over 30 yrs
- Wildfire 1/10 Low
- Heat 7/10 Severe 7 d/yr ≥107°F today · 20 d/yr by 30 yrs out
- Wind 8/10 Severe 80% chance of damaging wind over 30 yrs
- Air quality 3/10 Moderate 4 unhealthy d/yr today · 4 by 30 yrs out
Nearby sold comps map
Loading sold comps map…
Walkable amenities ~0.75 mi
Loading nearby amenities…
Taxation est. · year 1
- Rental income
- $16,620
- − Mortgage interest
- −$6,442
- − Property taxes
- −$503
- − Insurance
- −$575
- − Repairs & maintenance
- −$1,330
- − Management
- −$1,330
- − Depreciation
- −$3,345
- Taxable income
- $3,095
- Est. tax owed @ 24.0%
- −$743
- After-tax cash flow
- $4,072/yr
For passive investors: Depreciation is non-cash, so a rental often shows a tax loss while cash-flowing — sheltering income. Rental losses are passive: they offset passive income freely, and up to $25,000/yr can offset ordinary (W-2) income if you actively participate and your MAGI is under $100k (phasing out to $0 by $150k); unused losses carry forward. On sale, claimed depreciation is recaptured at up to 25%, and gains may owe capital-gains tax (a 1031 exchange can defer both). Figures are a year-1 estimate at your 24.0% rate — not tax advice; consult a CPA.
Schools (NCES district)
- District
- Montgomery County
- NCES district ID
- 0102430
- Math proficiency
- 9% ▼ -21.00%
- Reading proficiency
- 31% ▼ -1.00%
- Median HH income
- $43,902
- Composite
- 17.24/100
- National rank
- #9093
- State rank
- #106 of 129 in AL
Livability — Montgomery
- Score
- 65/100
- State rank
- #138
- US rank
- #13416
Category grades
Schools grade is shown separately in the Schools card above.
Census & demographics
- Census place
- Montgomery, AL
- County
- Montgomery County · 190,016 people
- City population
- 175,913
- Metro
- Montgomery, AL
- Population (ZIP)
- 14,065
- Household income
- $69,087
- Rent vs Own
- Severe rent burden
- 876.0
Population outlook (Montgomery County) Hauer SSP2
- Today (2025)
- 224,008 people
- By 2030
- 221,460 · -1.1%
- By 2040
- 214,179 · -4.4%
- By 2050
- 204,912 · -8.5%
- By 2075
- 177,821 · -20.6%
- By 2100
- 145,134 · -35.2%
Race, ethnicity, and origin ACS 2023
- Neighborhood character
- Diverse neighborhood (Simpson 0.58)
- Race & ethnicity
- White 47% Black 43% Hispanic / Latino 5% Two or more races 4% Asian 1%
- Hispanic origin (detail)
- Mexican 3%
- Common ancestry
- Serbian 2% Slovak 2% Italian 1%
- Foreign-born
- 4% · Canada, China, South Korea
- Languages at home
- 94% English-only · Spanish 3%
Political lean MEDSL · Montgomery
- 2024 margin
- Solid D (+30.7) · D 64.8% · R 34.1% · Other 1.1%
- 2008→2024 swing
- +11.5pp toward D · 2008: 19.2pp · 2024: 30.7pp
- All cycles
- 2024: D+30.7 2020: D+31.5 2016: D+26.2 2012: D+24.3 2008: D+19.2
Not yet ingested
- Civics
- —
Market trends
- HPI YoY
- ▼ -22.82%
- Current HPI
- 151.1822
- Rent YoY
- ▲ 6.29%
- Metro
- Montgomery, AL
- State GDP YoY
- ▲ 2.94%
- F500 in state
- 4
Industry mix (Fortune 500 HQ in AL)
| Industry | F500 HQs | Revenue |
|---|---|---|
| Financial Services | 1 | $8B |
|
||
| Healthcare | 1 | $5B |
|
||
Price history
+92.0% since first listed25 events — show timeline
- 2026-06-14 Price Changed $115,000 MAAR
- 2026-06-14 Listed $115,000 MAAR
- 2026-06-14 Listed $109,900 MAAR
- 2024-05-08 Sold (MLS) $30,250 MAAR
- 2024-04-30 Pending — MAAR
- 2024-04-24 Relisted — MAAR
- 2024-04-21 Price Changed $34,900 MAAR
- 2024-04-01 Price Changed $39,900 MAAR
- 2024-03-15 Price Changed $45,900 MAAR
- 2024-02-26 Listed $49,900 MAAR
- 2023-12-05 Price Changed $40,700 VMLS
- 2023-11-20 Price Changed $49,300 VMLS
- 2023-11-09 Price Changed $62,540 VMLS
- 2023-11-09 Listed $61,480 VMLS
- 2023-03-23 Listed $43,000 VMLS
- 2023-01-27 Price Changed $43,000 VMLS
- 2023-01-11 Price Changed $51,500 VMLS
- 2022-12-23 Listed $61,300 VMLS
- 2006-03-21 Sold (Public Records) $71,100 Public Records
- 2006-02-27 Sold (MLS) $71,000 MAAR
- 2006-01-02 Listed $73,601 MAAR
- 2005-01-10 Listed $68,000 MAAR
- 2002-07-12 Listed $57,757 MAAR
- 2001-08-24 Listed $64,000 MAAR
- 2001-01-15 Listed $59,900 MAAR
Property tax history
-1.1%/yrLatest (2025): $503 · -17.6% YoY. Source: county tax records.
Cash-flow waterfall
monthlySold comps — $/sqft
last 12 mo · ≤1 miLoading sold comps…