17 Pawtucket Ave · Claremont, NH
Flood risk 1/10 · Minimal
- FEMA flood zone
- X (unshaded)
- Chance of flooding over 30 yrs
- 0.0%
- Est. flood insurance / yr
- $507 – $1,088
Fire risk 1/10 · Minimal
- Est. fire insurance / yr
- $507 – $941
Heat risk 3/10 · Minor
- Hot days now (above 93°F)
- 7 days/yr
- Hot days in 30 yrs
- 17 days/yr
Wind risk 3/10 · Minor
- Chance of severe wind over 30 yrs
- 6.0%
Air-quality risk 1/10 · Minimal
- Unhealthy air days now
- 0 days/yr
- Unhealthy air days in 30 yrs
- 0 days/yr
Risk factors via First Street. Map © Google.
Why this score? — see what drove the B grade
The composite is a weighted blend of 9 inputs, each scored 0–100. Each bar is that input's sub-score; the figure is the points it added to the 100-point composite (weight × sub-score).
- Cash flow +30.0/30.0
- 1% rule +10.0/10.0
- DSCR +10.0/10.0
- ARV discount +7.5/15.0
- Appreciation +5.1/10.0
- Livability +3.5/5.0
- Rent growth +2.5/5.0
- Schools +2.5/10.0
- Condition / age +2.5/5.0
$85,000
🖨 Deal sheet 📄 Offer letter ✓ Due diligence
Listing remarks
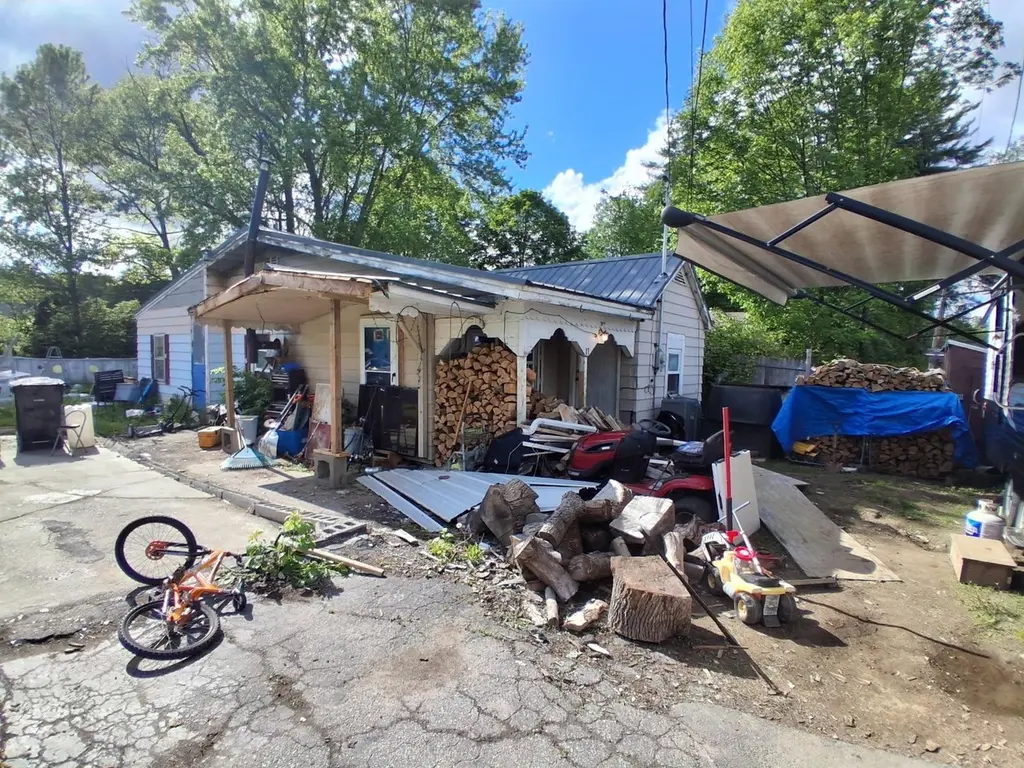
Tired of renting? Come make this ranch your new home. Build instant equity. Needs cosmetics and updates. Priced for work needed.
Key facts
- 6,098 sq ft lot
- Garage
- Built 1947
Property features AI
Finance
- Other: Property assessed in 2025 (assessment details omitted); Tax year 2025 (tax amount omitted)
Exterior
- Parking: One-car garage
- Utilities: Public water; Drywell/Septic for sewer; 200 Amp service with circuit breakers; Cable available; Other utility services; Internet availability unknown
- Home design: Ranch-style home; Existing structure; Facing direction not provided; Single-story entry level not specified
- Construction: Built in 1947; Wood frame construction; Metal roof
- Exterior features: Level lot; Public road frontage; Driveway (other)
Interior
- Bathrooms: One full bathroom
- Heating & cooling: Oil heating; Hot air heat
- Interior features: Four total rooms; Full, unfinished basement with interior access
Neighborhood map
What this means for you Summary
Snapshot
- This is a 3-bed/1.0-bath single-family listed at $85k.
Deal economics
- At list price, monthly cash flow is $758 ($9k/yr) — positive.
- The deal already cash-flows at list — no discount required.
- Meets the 1% rule at list price ($2k rent vs $85k).
- Recommended offer: $84k (1.5% below list) — sets the bar for market timing.
- Cap rate 17.0% vs local median 3.2% in Claremont — top-decile yield for the area; either an underpriced asset or a hidden risk that comps aren't pricing in. Stress-test before assuming the spread holds.
Location & tenants
- Location reads 69/100 on livability (#50 in NH) — a middle-class / working-renter tenant base. Strengths: cost of living A+, health & safety A+, housing A; Watch: employment C-, schools D-, amenities F.
- Claremont School District (town): math 24% / reading 35% proficiency, ranked #85 of 98 in NH (top 87%) — low school quality limits family demand, transient renter base, plan for 1-2y turnover.
- Market conditions: 58 active listings in the ZIP; 4 comparable units currently listed for rent nearby; rentals lingering (median 44d on market — plan ~5-8 weeks vacancy on turnover, expect pricing pressure); 100% of comp listings sitting > 30 days — soft ceiling on asking rent; 98 units permitted in Sullivan County in 2024 (0 in 5+ unit buildings).
- This rent runs 39% of the median local income ($60k/yr) — at the standard rent-burdened threshold; future hikes will face affordability resistance.
Forward outlook
- In year one you build about $759 of equity ($588 loan paydown + $171 appreciation (0.2% local appreciation)).
- Sullivan County population projected at -20% by 2050 — secular population decline; favor cash flow + early exit over multi-decade hold.
- At projected returns (0.2% appreciation + 3.0% rent growth), your $24k cash investment doubles in ~3 years — after that, you're playing with house money.
Negotiation context
- It's been on market 18 days — a 2% lower offer ($84k) is reasonable based on typical stale-listing flexibility.
- Current owner paid $40k; list at $85k implies a 112% gain — meaningful room to come down on a strong offer.
Risks & watch-outs
- Watch-outs: property tax is 4.2% of price; built in 1947 — expect roof / HVAC / electrical / plumbing capex.
Questions for the listing agent
- Built in 1947 — when were the roof, HVAC, electrical panel, plumbing, and water heater last replaced?
- Property tax is high relative to price — has the assessment been appealed recently, and will the sale trigger a re-assessment?
- Is there a deadline driving the sale (1031 exchange, divorce, estate, relocation)? That informs how much negotiation room exists.
- Schools are D-rated, which usually means shorter tenancies and higher turnover. Who's the typical renter profile here, and what's been the actual vacancy rate?
- What's the average days-on-market for RENTAL listings here right now (not sales)? A rising rental-DOM trend means longer vacancies and softer asking-rent achievability than the comps imply.
- What's the recent tenant-quality profile in this submarket — average credit score on applications, eviction rate, late-payment / NSF rate, and stable-employment percentage? A property-management company in the area should have these aggregated.
- How much new for-sale + rental construction is in the pipeline within 1–3 miles? Heavy new supply typically softens prices + rents 12–24 months out; constrained supply supports both.
Investment metrics
- 1% rule
- 2.28% ✓
- Cap rate
- 16.99%
- Cash-on-cash
- 38.21%
- DSCR
- 2.70
- GRM
- 3.6
CMA / ARV
- ARV (on-the-fly)
- $207,019
- Comps found
- 7
Show comp detail 7 sales within ~0.75 mi
| Address | Dist | Beds/Ba | Sqft | Sold | Price | $/sf | Match |
|---|---|---|---|---|---|---|---|
| 16 Providence Ave | 0.03mi | 3/1.0 | 864 (+1%) | 12mo | $255,000 | $295 | 88 |
| 8 Wildwood Ave | 0.29mi | 3/1.0 | 832 (-3%) | 22mo | $200,300 | $241 | 63 |
| 20 Stone Ave | 0.64mi | 3/1.0 | 888 (+3%) | 15mo | $222,000 | $250 | 52 |
| 36 Woonsocket Ave | 0.17mi | 2/1.0 (-1) | 948 (+10%) | 23mo | $150,000 | $158 | 51 |
| 3 Pillsbury St | 0.72mi | 3/1.0 | 918 (+7%) | 16mo | $200,000 | $218 | 41 |
| 396 Sullivan St | 0.46mi | 3/1.0 | 960 (+12%) | 24mo | $175,000 | $182 | 39 |
| 24 Leslie Ave | 0.70mi | 3/1.0 | 972 (+13%) | 14mo | $235,000 | $242 | 34 |
Match score weights: distance 35% · size 25% · config 20% · recency 20%. Top-matched comps best support the ARV.
Projected returns pro-forma
0.2% appreciation · 3.0% rent growth · sell at horizon
- IRR
- 39.5%
- Equity multiple
- 2.96×
- Total profit
- $46,729
- Equity at exit
- $25,542
- IRR
- 42.5%
- Equity multiple
- 5.85×
- Total profit
- $115,497
- Equity at exit
- $31,397
Cash invested: $23,800 (down + closing). Projections, not guarantees.
Landlord ↔ Tenant lean methodology
- Overall (STATE)
- 56 Moderately Landlord-Leaning
- State New Hampshire
- 56 Moderately Landlord-Leaning · D+1
- County
- — inherits STATE
- City
- — inherits STATE
ZIP-level market 03743
- Home prices YoY
- 0.1%
- Active inventory
- 58
- Price-to-rent
- 3.6×
Monthly cashflow live
- Estimated rent
- $1,941 medium interval (Pro) →
- Mortgage (P&I)
- −$446
- Tax from tax record
- −$294 /mo · $3,533/yr
- Insurance
- −$35
- HOA
- −$0
- Vacancy / Maint / Mgmt
- −$408
- Net cashflow
- $758
Break-even live
UW: 25.0% down · 7.5% · 30yr · 1.5% tax · 5.0% vac · 8.0% maint · 8.0% mgmt
Financing live
Cash to close
- Down payment
- $21,250
- Closing costs
- $2,550
- Reserves months
- —
- Total cash needed
- —
Loan-product check · same deal, 3 products live
Conventional
25% down · 7.5% · 30yr
- Down + closing
- —
- Monthly P&I
- —
- Monthly cashflow
- —
- DSCR
- —
- Eligible?
- —
Personal DTI + credit; lowest rate.
DSCR
20% down · 8.5% · 30yr
- Down + closing
- —
- Monthly P&I
- —
- Monthly cashflow
- —
- DSCR
- —
- Eligible?
- —
No personal income docs; deal must DSCR.
Hard money
10% down · 12.0% · 12mo
- Down + closing
- —
- Monthly P&I
- —
- Monthly cashflow
- —
- DSCR
- —
- Eligible?
- —
Short-term bridge; refi at stabilization.
Rent comps 4 comps
| Address | Beds | Baths | Sqft | Rent | $/sqft | DOM | Units | Dist |
|---|---|---|---|---|---|---|---|---|
| 27 School St Apt D Claremont, NH | 2.0 | 1.0 | 600 | $1,850 | $3.08 | 43d | 1 | 0.87mi |
| 109 Pleasant St Unit 203 Claremont, NH | 3.0 | 1.0 | 1100 | $1,850 | $1.68 | 43d | 1 | 0.91mi |
| 15 Highland Ave Claremont, NH | 2.0 | 1.0 | 635 | $1,800 | $2.83 | 43d | 1 | 0.97mi |
| 15 Lincoln Hts Claremont, NH | 2.0–3.0 | 1.0–1.5 | 800 | $2,205 | $2.76 | 43d | 1 | 1.16mi |
Listing history 15 events
-
2026-06-19days on market $85,000 Active 18 DOM
-
2026-06-18days on market $85,000 Active 17 DOM
-
2026-06-17days on market $85,000 Active 16 DOM
-
2026-06-16days on market $85,000 Active 15 DOM
-
2026-06-15days on market $85,000 Active 14 DOM
-
2026-06-14days on market $85,000 Active 12 DOM
-
2026-06-12days on market $85,000 Active 11 DOM
-
2026-06-09days on market $85,000 Active 8 DOM
-
2026-06-08days on market $85,000 Active 7 DOM
-
2026-06-07days on market $85,000 Active 6 DOM
-
2026-06-05days on market $85,000 Active 3 DOM
-
2026-06-03days on market $85,000 Active 2 DOM
-
2026-06-03price $85,000 Active 1 DOM
-
2026-06-01remarks 128-char remark
-
2026-06-01$99,900 Active 1 DOM
ⓘ Source: listings_history table (triggers on properties + properties_extension) + one-shot
backfill from property_details.listing_events for pre-trigger history.
Tax reassessment forecast NH · Partial reset (capped growth)
- Current annual tax
- $3,533 · $294/mo
- Projected year-2 tax
- $3,533 · $294/mo
- Expected delta
- $0/yr ($0/mo · 0.0%)
ⓘ Screening estimate from a state-policy table — verify with the county assessor before closing.
Climate risk First Street
- Flood 1/10 Low FEMA zone X (unshaded) · 0% chance over 30 yrs
- Wildfire 1/10 Low
- Heat 3/10 Moderate 7 d/yr ≥93°F today · 17 d/yr by 30 yrs out
- Wind 3/10 Moderate 6% chance of damaging wind over 30 yrs
- Air quality 1/10 Low 0 unhealthy d/yr today · 0 by 30 yrs out
Nearby sold comps map
Loading sold comps map…
Walkable amenities ~0.75 mi
Loading nearby amenities…
Taxation est. · year 1
- Rental income
- $23,291
- − Mortgage interest
- −$4,761
- − Property taxes
- −$3,533
- − Insurance
- −$425
- − Repairs & maintenance
- −$1,863
- − Management
- −$1,863
- − Depreciation
- −$2,473
- Taxable income
- $8,373
- Est. tax owed @ 24.0%
- −$2,009
- After-tax cash flow
- $7,084/yr
For passive investors: Depreciation is non-cash, so a rental often shows a tax loss while cash-flowing — sheltering income. Rental losses are passive: they offset passive income freely, and up to $25,000/yr can offset ordinary (W-2) income if you actively participate and your MAGI is under $100k (phasing out to $0 by $150k); unused losses carry forward. On sale, claimed depreciation is recaptured at up to 25%, and gains may owe capital-gains tax (a 1031 exchange can defer both). Figures are a year-1 estimate at your 24.0% rate — not tax advice; consult a CPA.
Schools (NCES district)
- District
- Claremont School District
- NCES district ID
- 3302340
- Math proficiency
- 24% ▼ -7.00%
- Reading proficiency
- 35% ▼ -5.00%
- Median HH income
- $43,285
- Composite
- 25.11/100
- National rank
- #7528
- State rank
- #85 of 98 in NH
Livability — Claremont
- Score
- 69/100
- State rank
- #50
- US rank
- #8815
Category grades
Schools grade is shown separately in the Schools card above.
Census & demographics
- Census place
- Claremont, NH
- County
- Sullivan County · 16,826 people
- City population
- 13,704
- Metro
- Lebanon, NH-VT
- Population (ZIP)
- 13,704
- Household income
- $59,625
- Rent vs Own
- Severe rent burden
- 642.0
Population outlook (Sullivan County) Hauer SSP2
- Today (2025)
- 41,322 people
- By 2030
- 39,910 · -3.4%
- By 2040
- 36,447 · -11.8%
- By 2050
- 32,917 · -20.3%
- By 2075
- 25,997 · -37.1%
- By 2100
- 19,479 · -52.9%
Race, ethnicity, and origin ACS 2023
- Neighborhood character
- Predominantly White (87%)
- Race & ethnicity
- White 87% Two or more races 6% Hispanic / Latino 5% Black 1%
- Hispanic origin (detail)
- Puerto Rican 4%
- Common ancestry
- Lithuanian 18% Slovak 4% Romanian 3%
- Foreign-born
- 2% · Canada
- Languages at home
- 97% English-only · Spanish 3%
Political lean MEDSL · Sullivan
- 2024 margin
- Toss-up / Even · D 49.1% · R 49.8% · Other 1.2%
- 2008→2024 swing
- -18.7pp toward R · 2008: 18.0pp · 2024: -0.7pp
- All cycles
- 2024: R+0.7 2020: D+3.6 2016: R+2.6 2012: D+13.3 2008: D+18.0
Not yet ingested
- Civics
- —
Market trends
- HPI YoY
- ▲ 0.20%
- Current HPI
- 337.0004
- Rent YoY
- —
- Metro
- Lebanon, NH-VT
- State GDP YoY
- —
- F500 in state
- 0
Price history
+149.8% since first listed2 events — show timeline
- 2026-06-01 Listed $99,900 PrimeMLS
- 2009-07-24 Sold (Public Records) $40,000 Public Records
Property tax history
+1.1%/yrLatest (2025): $3,533 · +4.4% YoY. Source: county tax records.
Cash-flow waterfall
monthlySold comps — $/sqft
last 12 mo · ≤1 miLoading sold comps…