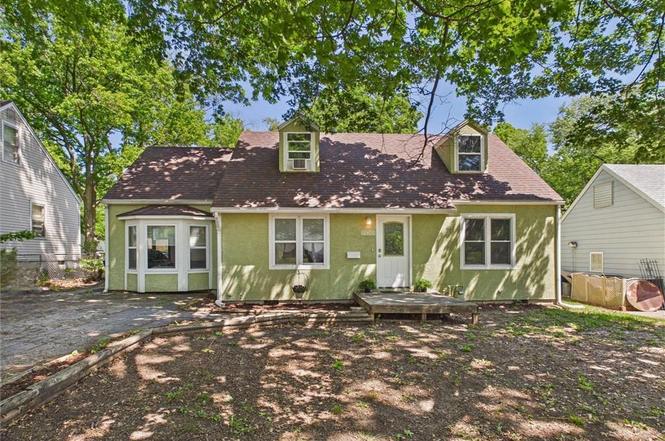
10406 W 56th Ter · Shawnee, KS
Flood risk 1/10 · Minimal
- FEMA flood zone
- X (unshaded)
- Chance of flooding over 30 yrs
- 0.0%
- Est. flood insurance / yr
- $507 – $1,088
Fire risk 1/10 · Minimal
- Est. fire insurance / yr
- $1,154 – $2,142
Heat risk 4/10 · Minor
- Hot days now (above 107°F)
- 7 days/yr
- Hot days in 30 yrs
- 17 days/yr
Wind risk 2/10 · Minimal
- Chance of severe wind over 30 yrs
- —
Air-quality risk 2/10 · Minimal
- Unhealthy air days now
- 2 days/yr
- Unhealthy air days in 30 yrs
- 2 days/yr
Risk factors via First Street. Map © Google.
Why this score? — see what drove the C grade
The composite is a weighted blend of 9 inputs, each scored 0–100. Each bar is that input's sub-score; the figure is the points it added to the 100-point composite (weight × sub-score).
- Cash flow +18.5/30.0
- ARV discount +15.0/15.0
- DSCR +5.8/10.0
- 1% rule +4.7/10.0
- Livability +4.4/5.0
- Schools +3.8/10.0
- Rent growth +2.5/5.0
- Condition / age +2.5/5.0
- Appreciation +0.0/10.0
$199,900
🖨 Deal sheet 📄 Offer letter ✓ Due diligence
Listing remarks MLS
NICE HOME FOR THE MONEY. LARGE TREED YARD. NICE DECK OUT BACK TO ABOVE GROUND POOL. NICE FAMILY ROOM OR USE AS LARGE DINING ROOM. 2 BEDROOMS DOWN 1 UP WITH SITTING AREA.
Key facts
- 8,881 sq ft lot
- Built 1951
- Listed 30 days
Property features AI
Finance
- Other: Property listed as a fixer
Exterior
- Parking: Off-street parking
- Utilities: Public water; Public sewer
- Home design: Single-family residence; Residential property; 1.5-story layout; Entry facing not specified
- Construction: Stucco and frame construction; Composition roof; Built approximately 51–75 years ago; No other structures
- Exterior features: Fixer-up condition; Metal fencing; City lot; Paved road with public maintenance
Interior
- Bedrooms: 3 bedrooms
- Flooring: Carpet; Tile; Wood
- Bathrooms: 1 full bathroom
- Heating & cooling: Natural gas heating; Electric cooling (has central cooling)
- Interior features: Living/dining combo; Crawl space basement
- Laundry & utility: Main-level laundry
Neighborhood map
What this means for you Summary
Snapshot
- This is a 3-bed/1.0-bath single-family listed at $200k.
Deal economics
- At list price, monthly cash flow is $190 ($2k/yr) — positive.
- The deal already cash-flows at list — no discount required.
- To meet the 1% rule (rent ≥ 1% of price), the offer needs to be $194k (3.0% below list).
- Recommended offer: $194k (3.0% below list) — sets the bar for 1% rule.
- Cap rate 7.4% vs local median 3.2% in Shawnee — top-decile yield for the area; either an underpriced asset or a hidden risk that comps aren't pricing in. Stress-test before assuming the spread holds.
Location & tenants
- Location reads 87/100 on livability (#2 in KS, #276 nationally) — a professional / high-income tenant draw. Strengths: commute A+, employment A+, housing A+.
- Shawnee Mission Pub Schools (suburban): math 38% / reading 46% proficiency, ranked #22 of 169 in KS (top 13%) — families likely to look elsewhere, expect single-tenant / working-renter base with shorter leases.
- Zoned schools: Bluejacket-Flint (math 37% / reading 42%, grade F, #321 of 684 statewide, top 52%, 413 students, 48% FRL) — zoned schools average 48% FRL vs 29% district-wide (20 pts higher); higher-poverty schools than district average — tighter screening recommended.
- Market conditions: 80 active listings in the ZIP; 10 comparable units currently listed for rent nearby; rentals leasing fast (median 7d on market — plan ~1-2 weeks tenant-placement turnaround); solid renter incomes; 2,969 units permitted in Johnson County in 2024 (1,066 in 5+ unit buildings).
- This rent runs 31% of the median local income ($76k/yr) — at the standard rent-burdened threshold; future hikes will face affordability resistance.
Forward outlook
- Local home prices are declining (-3.0%/yr); year-one equity from $1k of loan paydown is wiped out by about $6k of value loss. Plan a longer hold.
- Johnson County population projected at +27% by 2050 — long-run rental-demand tailwind backs the buy-and-hold thesis.
Negotiation context
- It's been on market 30 days — a 2% lower offer ($197k) is reasonable based on typical stale-listing flexibility.
- 3 sale attempts since 28y ago with the ask held roughly flat each time — persistent listings suggest the price (not the market) is what's stuck; bring a comps-based counter.
Risks & watch-outs
- Watch-outs: built in 1951 — expect roof / HVAC / electrical / plumbing capex.
Questions for the listing agent
- Built in 1951 — when were the roof, HVAC, electrical panel, plumbing, and water heater last replaced?
- Is there a deadline driving the sale (1031 exchange, divorce, estate, relocation)? That informs how much negotiation room exists.
- Schools are B-rated — typically a magnet for longer-tenancy family renters. What's the average tenant stay here, and is there a school-zone premium baked into asking?
- What's the average days-on-market for RENTAL listings here right now (not sales)? A rising rental-DOM trend means longer vacancies and softer asking-rent achievability than the comps imply.
- What's the recent tenant-quality profile in this submarket — average credit score on applications, eviction rate, late-payment / NSF rate, and stable-employment percentage? A property-management company in the area should have these aggregated.
- How much new for-sale + rental construction is in the pipeline within 1–3 miles? Heavy new supply typically softens prices + rents 12–24 months out; constrained supply supports both.
Investment metrics
- 1% rule
- 0.97% ✗
- Cap rate
- 7.43%
- Cash-on-cash
- 4.08%
- DSCR
- 1.18
- GRM
- 8.6
CMA / ARV
- ARV (on-the-fly)
- $291,168
- Comps found
- 12
Show comp detail 12 sales within ~0.75 mi
| Address | Dist | Beds/Ba | Sqft | Sold | Price | $/sf | Match |
|---|---|---|---|---|---|---|---|
| 9721 W 56th Ter | 0.40mi | 3/2.0 | 1,350 (+0%) | 1mo | $324,950 | $241 | 76 |
| 9719 W 59th Ter | 0.56mi | 3/1.0 | 1,328 (-2%) | 4mo | $295,000 | $222 | 68 |
| 10530 W 59th Ter | 0.42mi | 3/1.5 | 1,454 (+8%) | 2mo | $299,000 | $206 | 64 |
| 11000 W 56th Ter | 0.34mi | 3/1.0 | 1,204 (-11%) | 4mo | $260,000 | $216 | 63 |
| 6017 Mastin St | 0.56mi | 3/2.0 | 1,416 (+5%) | 1mo | $299,000 | $211 | 61 |
| 6001 Melrose Ln | 0.47mi | 3/1.0 | 1,492 (+11%) | 3mo | $270,000 | $181 | 58 |
| 9955 Hocker Dr | 0.35mi | 3/2.0 | 1,474 (+9%) | 9mo | $330,000 | $224 | 57 |
| 5435 Flint St | 0.66mi | 3/2.0 | 1,400 (+4%) | 4mo | $325,000 | $232 | 55 |
| 11223 W 59th St | 0.63mi | 2/1.0 (-1) | 1,259 (-7%) | 1mo | $265,000 | $210 | 53 |
| 9719 W 53rd St | 0.59mi | 4/2.0 (+1) | 1,248 (-7%) | 2mo | $222,500 | $178 | 49 |
| 9520 W 59th Ter | 0.64mi | 3/2.0 | 1,248 (-7%) | 7mo | $339,900 | $272 | 48 |
| 5222 Knox Ave | 0.65mi | 3/2.0 | 1,234 (-8%) | 8mo | $235,000 | $190 | 45 |
Match score weights: distance 35% · size 25% · config 20% · recency 20%. Top-matched comps best support the ARV.
Projected returns pro-forma
-3.0% appreciation · 3.0% rent growth · sell at horizon
- IRR
- -9.9%
- Equity multiple
- 0.64×
- Total profit
- $-20,281
- Equity at exit
- $29,806
- IRR
- -0.5%
- Equity multiple
- 0.96×
- Total profit
- $-2,050
- Equity at exit
- $17,284
Cash invested: $55,972 (down + closing). Projections, not guarantees.
Landlord ↔ Tenant lean methodology
- Overall (STATE)
- 83 Strongly Landlord-Friendly
- State Kansas
- 83 Strongly Landlord-Friendly · R+10
- County
- — inherits STATE
- City
- — inherits STATE
ZIP-level market 66203
- Active inventory
- 80
- Price-to-rent
- 8.6×
Monthly cashflow live
- Estimated rent
- $1,940 high interval (Pro) →
- Mortgage (P&I)
- −$1,048
- Tax from tax record
- −$211 /mo · $2,528/yr
- Insurance
- −$83
- HOA
- −$0
- Vacancy / Maint / Mgmt
- −$407
- Net cashflow
- $190
Break-even live
UW: 25.0% down · 7.5% · 30yr · 1.5% tax · 5.0% vac · 8.0% maint · 8.0% mgmt
Financing live
Cash to close
- Down payment
- $49,975
- Closing costs
- $5,997
- Reserves months
- —
- Total cash needed
- —
Loan-product check · same deal, 3 products live
Conventional
25% down · 7.5% · 30yr
- Down + closing
- —
- Monthly P&I
- —
- Monthly cashflow
- —
- DSCR
- —
- Eligible?
- —
Personal DTI + credit; lowest rate.
DSCR
20% down · 8.5% · 30yr
- Down + closing
- —
- Monthly P&I
- —
- Monthly cashflow
- —
- DSCR
- —
- Eligible?
- —
No personal income docs; deal must DSCR.
Hard money
10% down · 12.0% · 12mo
- Down + closing
- —
- Monthly P&I
- —
- Monthly cashflow
- —
- DSCR
- —
- Eligible?
- —
Short-term bridge; refi at stabilization.
Rent comps 10 comps
| Address | Beds | Baths | Sqft | Rent | $/sqft | DOM | Units | Dist |
|---|---|---|---|---|---|---|---|---|
| 5402 Knox Ave Shawnee, KS | 3.0 | 2.5 | 1250 | $2,450 | $1.96 | 1d | 1 | 0.52mi |
| 5938 Barton Dr Shawnee, KS | 2.0 | 2.0 | 977 | $3,250 | $3.33 | 1d | 1 | 0.65mi |
| 6016 Roger Rd Shawnee, KS | 2.0 | 1.0–2.0 | 951 | $1,794 | $1.89 | 1d | 3 | 0.65mi |
| 11221 W 60th St Apt D Shawnee, KS | 2.0 | 1.0 | 950 | $1,295 | $1.36 | 23d | 1 | 0.70mi |
| 10302 W 62nd St Unit B09 Shawnee, KS | 2.0 | 2.0 | 900 | $1,350 | $1.50 | 23d | 1 | 0.71mi |
| 11210 W 60th Ter Unit D Shawnee, KS | 2.0 | 1.0 | 950 | $1,295 | $1.36 | 7d | 1 | 0.71mi |
| 6101 Nieman Rd Shawnee, KS | 2.0 | 2.0 | 1590 | $2,295 | $1.44 | 1d | 1 | 0.73mi |
| 6115 Nieman Rd Shawnee, KS | 2.0 | 2.0 | 1590 | $2,395 | $1.51 | 7d | 1 | 0.75mi |
| 6527 Reeder St Shawnee, KS | 1.0–2.0 | 1.0–2.0 | 882 | $1,292 | $1.46 | 20d | 9 | 1.30mi |
| 9002 W 64th Ter Merriam, KS | 1.0–2.0 | 1.0–2.0 | 762 | $1,689 | $2.22 | 1d | 14 | 1.39mi |
Listing history 20 events
-
2026-06-15status $199,900 Pending 30 DOM
-
2026-06-13days on market $199,900 Active Under Contract 30 DOM
-
2026-06-13days on market $199,900 Active Under Contract 29 DOM
-
2026-06-09days on market $199,900 Active Under Contract 26 DOM
-
2026-06-08days on market $199,900 Active Under Contract 25 DOM
-
2026-06-07days on market $199,900 Active Under Contract 24 DOM
-
2026-06-05days on market $199,900 Active Under Contract 21 DOM
-
2026-06-03days on market $199,900 Active Under Contract 20 DOM
-
2026-06-02days on market $199,900 Active Under Contract 19 DOM
-
2026-06-01days on market $199,900 Active Under Contract 18 DOM
-
2026-05-31days on market $199,900 Active Under Contract 17 DOM
-
2026-05-18historical Active Under Contract
-
2026-05-15$199,900 Active
-
2026-05-13historical $199,900
-
2002-01-29soldstatus
-
2002-01-28soldstatus 169-char remark
Show marketing remark (169 chars)
NICE HOME FOR THE MONEY. LARGE TREED YARD. NICE DECK OUT BACK TO ABOVE GROUND POOL. NICE FAMILY ROOM OR USE AS LARGE DINING ROOM. 2 BEDROOMS DOWN 1 UP WITH SITTING AREA.
-
2001-12-05$99,950 169-char remark
Show marketing remark (169 chars)
NICE HOME FOR THE MONEY. LARGE TREED YARD. NICE DECK OUT BACK TO ABOVE GROUND POOL. NICE FAMILY ROOM OR USE AS LARGE DINING ROOM. 2 BEDROOMS DOWN 1 UP WITH SITTING AREA.
-
1998-12-11soldstatus
-
1998-12-10soldstatus 213-char remark
Show marketing remark (213 chars)
Super Sharp! Newer Kitchen, Furnace, Ac, Roof, Floor Covering And Paint. Hugh Deck And Nice Pool. Large Treed Yard. 2br Down, 1 Plus Sit Room Or 4th Br Up. Nice Family Room Or Large Dining Rm. Home Shows Great !!
-
1998-09-14$89,500 213-char remark
Show marketing remark (213 chars)
Super Sharp! Newer Kitchen, Furnace, Ac, Roof, Floor Covering And Paint. Hugh Deck And Nice Pool. Large Treed Yard. 2br Down, 1 Plus Sit Room Or 4th Br Up. Nice Family Room Or Large Dining Rm. Home Shows Great !!
ⓘ Source: listings_history table (triggers on properties + properties_extension) + one-shot
backfill from property_details.listing_events for pre-trigger history.
Tax reassessment forecast KS · Resets to sale price
- Current annual tax
- $2,528 · $211/mo
- Projected year-2 tax
- $2,819 · $235/mo
- Expected delta
- +$291/yr (+$24/mo · 11.5%)
ⓘ Screening estimate from a state-policy table — verify with the county assessor before closing.
Climate risk First Street
- Flood 1/10 Low FEMA zone X (unshaded) · 0% chance over 30 yrs
- Wildfire 1/10 Low
- Heat 4/10 Moderate 7 d/yr ≥107°F today · 17 d/yr by 30 yrs out
- Wind 2/10 Low
- Air quality 2/10 Low 2 unhealthy d/yr today · 2 by 30 yrs out
Nearby sold comps map
Loading sold comps map…
Walkable amenities ~0.75 mi
Loading nearby amenities…
Taxation est. · year 1
- Rental income
- $23,275
- − Mortgage interest
- −$11,198
- − Property taxes
- −$2,528
- − Insurance
- −$1,000
- − Repairs & maintenance
- −$1,862
- − Management
- −$1,862
- − Depreciation
- −$5,815
- Taxable loss
- −$988
- Est. tax savings @ 24.0%
- +$237
- After-tax cash flow
- $2,518/yr
For passive investors: Depreciation is non-cash, so a rental often shows a tax loss while cash-flowing — sheltering income. Rental losses are passive: they offset passive income freely, and up to $25,000/yr can offset ordinary (W-2) income if you actively participate and your MAGI is under $100k (phasing out to $0 by $150k); unused losses carry forward. On sale, claimed depreciation is recaptured at up to 25%, and gains may owe capital-gains tax (a 1031 exchange can defer both). Figures are a year-1 estimate at your 24.0% rate — not tax advice; consult a CPA.
Schools (NCES district)
- District
- Shawnee Mission Pub Schools
- NCES district ID
- 2011640
- Math proficiency
- 38% ▼ -6.00%
- Reading proficiency
- 46% ▼ -2.00%
- Median HH income
- $64,923
- Composite
- 37.55/100
- National rank
- #4391
- State rank
- #22 of 169 in KS
Livability — Shawnee
- Score
- 87/100
- State rank
- #2
- US rank
- #276
Category grades
Schools grade is shown separately in the Schools card above.
Census & demographics
- Census place
- Shawnee, KS
- County
- Johnson County · 574,662 people
- City population
- 60,541
- Metro
- Kansas City, MO-KS
- Population (ZIP)
- 19,441
- Household income
- $75,869
- Rent vs Own
- Severe rent burden
- 542.0
Population outlook (Johnson County) Hauer SSP2
- Today (2025)
- 663,396 people
- By 2030
- 702,585 · +5.9%
- By 2040
- 775,386 · +16.9%
- By 2050
- 841,772 · +26.9%
- By 2075
- 994,137 · +49.9%
- By 2100
- 1,073,036 · +61.7%
Race, ethnicity, and origin ACS 2023
- Neighborhood character
- Predominantly White (72%)
- Race & ethnicity
- White 72% Hispanic / Latino 14% Two or more races 7% Black 5% Asian 4%
- Hispanic origin (detail)
- Mexican 9%
- Common ancestry
- Lithuanian 3% Italian 2% Portuguese 2%
- Foreign-born
- 10% · Canada, South Korea
- Languages at home
- 85% English-only · Spanish 10% Other Asian/Pacific 1% Tagalog/Filipino 1%
Political lean MEDSL · Johnson
- 2024 margin
- Lean D (+8.5) · D 53.4% · R 44.9% · Other 1.8%
- 2008→2024 swing
- +17.5pp toward D · 2008: -9.0pp · 2024: 8.5pp
- All cycles
- 2024: D+8.5 2020: D+8.2 2016: R+2.7 2012: R+17.8 2008: R+9.0
Not yet ingested
- Civics
- —
Market trends
- HPI YoY
- ▼ -262.92%
- Current HPI
- 269.0762
- Rent YoY
- —
- Metro
- Kansas City, MO-KS
- State GDP YoY
- —
- F500 in state
- 0
Price history
+123.4% since first listed9 events — show timeline
- 2026-05-18 Contingent — Heartland MLS as Distributed by MLS Grid
- 2026-05-15 Listed $199,900 Heartland MLS as Distributed by MLS Grid
- 2026-05-13 Coming Soon $199,900 Heartland MLS as Distributed by MLS Grid
- 2002-01-29 Sold (Public Records) — Public Records
- 2002-01-28 Sold (MLS) — Heartland MLS as Distributed by MLS Grid
- 2001-12-05 Listed $99,950 Heartland MLS as Distributed by MLS Grid
- 1998-12-11 Sold (Public Records) — Public Records
- 1998-12-10 Sold (MLS) — Heartland MLS as Distributed by MLS Grid
- 1998-09-14 Listed $89,500 Heartland MLS as Distributed by MLS Grid
Property tax history
+4.9%/yrLatest (2025): $2,528 · +7.7% YoY. Source: county tax records.
Cash-flow waterfall
monthlySold comps — $/sqft
last 12 mo · ≤1 miLoading sold comps…