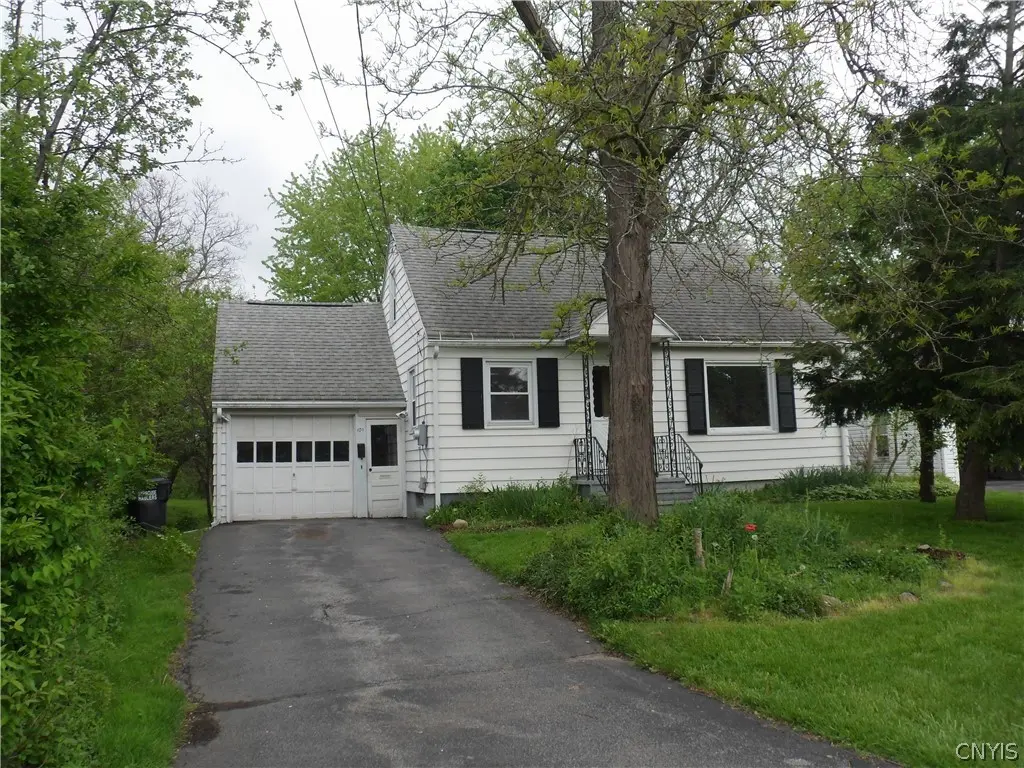
101 Chestnut Hill Dr · Galeville, NY
Flood risk 1/10 · Minimal
- FEMA flood zone
- X (unshaded)
- Chance of flooding over 30 yrs
- 0.0%
- Est. flood insurance / yr
- $473 – $860
Fire risk 1/10 · Minimal
- Est. fire insurance / yr
- $691 – $1,283
Heat risk 3/10 · Minor
- Hot days now (above 96°F)
- 7 days/yr
- Hot days in 30 yrs
- 16 days/yr
Wind risk 1/10 · Minimal
- Chance of severe wind over 30 yrs
- 0.0%
Air-quality risk 2/10 · Minimal
- Unhealthy air days now
- 0 days/yr
- Unhealthy air days in 30 yrs
- 1 days/yr
Risk factors via First Street. Map © Google.
Why this score? — see what drove the C grade
The composite is a weighted blend of 9 inputs, each scored 0–100. Each bar is that input's sub-score; the figure is the points it added to the 100-point composite (weight × sub-score).
- Cash flow +17.5/30.0
- ARV discount +15.0/15.0
- 1% rule +5.9/10.0
- DSCR +5.5/10.0
- Schools +4.3/10.0
- Livability +3.7/5.0
- Rent growth +2.5/5.0
- Condition / age +2.5/5.0
- Appreciation +0.0/10.0
$199,900
🖨 Deal sheet (PDF) 📄 Offer letter ✓ Due diligence
Listing remarks
SHOWINGS START FRIDAY MAY 15TH @ 9:00 AM; Lockbox on front door. PROPERTY BEING SOLD 'AS IS'. SQUARE FOOTAGE IS 1105, PER APPRAISAL. GREAT STARTER HOME! ROOF 2009 ; NEWER ELECTRICAL SERVICE-2015 ; HOT WATER TANK 2019 ; FURNACE AND CENTRAL AIR 2003 ; ALL WALL TO WALL CARPETING ON BOTH FLOORS/STAIRS REMOVED ON MAY 13, 2026. FABULOUS PRIVATE DEEP LOT - 226 FEET. EXTRA STORAGE ABOVE THE GARAGE!
Key facts
- Private deep lot
- Hot water tank 2019
- Roof 2009
Tags
Property features AI
Exterior
- Parking: Attached garage with storage (1 garage space)
- Utilities: Electricity connected (circuit breakers); Public water connected; Sewer connected; Cable available
- Home design: Single-story home; Resale property; City street frontage
- Construction: Aluminum siding; Copper plumbing; Architectural shingle roof; Block foundation; Existing (year built details)
- Exterior features: Blacktop driveway; Open porch
Interior
- Kitchen: Gas range; Gas oven; Refrigerator
- Bedrooms: One bedroom on the main level
- Flooring: Hardwood; Vinyl; Varies
- Bathrooms: One full bathroom (main level)
- Heating & cooling: Gas forced-air heating; Central air conditioning
- Interior features: Separate/formal dining room; Eat-in kitchen; Separate/formal living room; Storage
- Laundry & utility: Washer and dryer in basement; Gas water heater
Neighborhood map
What this means for you Summary
Snapshot
- This is a 3-bed/1.0-bath single-family listed at $200k.
Deal economics
- At list price, monthly cash flow is $152 ($2k/yr) — positive.
- The deal already cash-flows at list — no discount required.
- Meets the 1% rule at list price ($2k rent vs $200k).
- Cap rate 7.2% vs local median 5.1% in Galeville — top-decile yield for the area; either an underpriced asset or a hidden risk that comps aren't pricing in. Stress-test before assuming the spread holds.
Location & tenants
- Location reads 74/100 on livability (#280 in NY, #4,444 nationally) — a middle-class / working-renter tenant base. Strengths: cost of living A+, housing A+, health & safety A; Watch: commute D+, schools D-, amenities F.
- Liverpool Central School District (suburban): math 49% / reading 49% proficiency, ranked #381 of 590 in NY (top 65%) — families likely to look elsewhere, expect single-tenant / working-renter base with shorter leases.
- Market conditions: 68 active listings in the ZIP; 9 comparable units currently listed for rent nearby; rentals at typical pace (median 15d on market — plan ~3-4 weeks tenant-placement turnaround); 616 units permitted in Onondaga County in 2024 (256 in 5+ unit buildings).
Forward outlook
- Local home prices are declining (-3.0%/yr); year-one equity from $1k of loan paydown is wiped out by about $6k of value loss. Plan a longer hold.
- Onondaga County population projected to shrink 9% by 2050 — rents likely to lag national; underwrite the cash flow, not the appreciation.
Negotiation context
- Only 7 days on market — expect competitive offers; lowballing is unlikely to land.
- 2 sale attempts; this cycle's ask is 18% above the opening price — seller raised mid-cycle; expect resistance to lowballs.
Risks & watch-outs
- Watch-outs: property tax is 2.6% of price; built in 1952 — expect roof / HVAC / electrical / plumbing capex.
Questions for the listing agent
- Built in 1952 — when were the roof, HVAC, electrical panel, plumbing, and water heater last replaced?
- Property tax is high relative to price — has the assessment been appealed recently, and will the sale trigger a re-assessment?
- Is there a deadline driving the sale (1031 exchange, divorce, estate, relocation)? That informs how much negotiation room exists.
- Schools are D-rated, which usually means shorter tenancies and higher turnover. Who's the typical renter profile here, and what's been the actual vacancy rate?
- What's the average days-on-market for RENTAL listings here right now (not sales)? A rising rental-DOM trend means longer vacancies and softer asking-rent achievability than the comps imply.
- What's the recent tenant-quality profile in this submarket — average credit score on applications, eviction rate, late-payment / NSF rate, and stable-employment percentage? A property-management company in the area should have these aggregated.
- How much new for-sale + rental construction is in the pipeline within 1–3 miles? Heavy new supply typically softens prices + rents 12–24 months out; constrained supply supports both.
Investment metrics
- 1% rule
- 1.09% ✓
- Cap rate
- 7.21%
- Cash-on-cash
- 3.26%
- DSCR
- 1.15
- GRM
- 7.6
CMA / ARV
- ARV (median comp)
- $247,737
- List price
- $199,900
- Delta
- -19.31%
- Verdict
- UNDERPRICED
- Comps
- 20 within 1.0 mi
Show comp detail 12 sales within ~0.75 mi
| Address | Dist | Beds/Ba | Sqft | Sold | Price | $/sf | Match |
|---|---|---|---|---|---|---|---|
| 122 Frederick Dr | 0.42mi | 3/1.0 | 994 (-1%) | 8mo | $209,000 | $210 | 71 |
| 117 Saslon Park Dr | 0.61mi | 3/2.0 | 988 (-2%) | 2mo | $225,000 | $228 | 63 |
| 110 Longwood Dr | 0.58mi | 3/1.0 | 1,076 (+7%) | 3mo | $240,000 | $223 | 60 |
| 120 Vincent Ave | 0.53mi | 3/1.5 | 1,085 (+8%) | 1mo | $255,000 | $235 | 59 |
| 308 Chestnut Heights Dr | 0.39mi | 3/2.0 | 1,104 (+10%) | 6mo | $225,500 | $204 | 57 |
| 213 Sunflower Dr | 0.49mi | 2/1.0 (-1) | 936 (-7%) | 4mo | $103,000 | $110 | 57 |
| 343 Fairmount Ave | 0.52mi | 3/1.5 | 912 (-10%) | 6mo | $167,000 | $183 | 53 |
| 113 Grandy Dr | 0.65mi | 3/2.0 | 1,104 (+10%) | 0mo | $276,500 | $250 | 49 |
| 321 Glendale Ave | 0.63mi | 4/1.0 (+1) | 1,080 (+7%) | 6mo | $244,000 | $226 | 48 |
| 253 Fairmount Ave | 0.68mi | 3/1.0 | 888 (-12%) | 1mo | $220,000 | $248 | 48 |
| 217 Beechwood Ave | 0.74mi | 3/1.0 | 1,080 (+7%) | 8mo | $240,000 | $222 | 47 |
| 227 Beechwood Ave | 0.69mi | 2/1.0 (-1) | 1,080 (+7%) | 9mo | $140,000 | $130 | 43 |
Match score weights: distance 35% · size 25% · config 20% · recency 20%. Top-matched comps best support the ARV.
Projected returns pro-forma
-3.0% appreciation · 3.0% rent growth · sell at horizon
- IRR
- -11.1%
- Equity multiple
- 0.60×
- Total profit
- $-22,548
- Equity at exit
- $29,806
- IRR
- -1.7%
- Equity multiple
- 0.88×
- Total profit
- $-6,548
- Equity at exit
- $17,284
Cash invested: $55,972 (down + closing). Projections, not guarantees.
Landlord ↔ Tenant lean methodology
- Overall (STATE)
- 15 Strongly Tenant-Friendly
- State New York
- 15 Strongly Tenant-Friendly · D+10
- County
- — inherits STATE
- City
- — inherits STATE
ZIP-level market 13088
- Active inventory
- 68
- Price-to-rent
- 7.6×
Monthly cashflow live
- Estimated rent
- $2,178 high interval (Pro) →
- Mortgage (P&I)
- −$1,048
- Tax from tax record
- −$437 /mo · $5,238/yr
- Insurance
- −$83
- HOA
- −$0
- Vacancy / Maint / Mgmt
- −$457
- Net cashflow
- $152
Break-even live
Sensitivity live
| Price | -10% $265 | -5% $209 | +0% $152 | +5% $96 | +10% $39 |
|---|---|---|---|---|---|
| Rent | -10% $-20 | -5% $66 | +0% $152 | +5% $238 | +10% $324 |
| Rate | -1.0pp $253 | -0.5pp $203 | base $152 | +0.5pp $100 | +1.0pp $48 |
UW: 25.0% down · 7.5% · 30yr · 1.5% tax · 5.0% vac · 8.0% maint · 8.0% mgmt
Financing live
Cash to close
- Down payment
- $49,975
- Closing costs
- $5,997
- Reserves months
- —
- Total cash needed
- —
Loan-product check · same deal, 3 products live
Conventional
25% down · 7.5% · 30yr
- Down + closing
- —
- Monthly P&I
- —
- Monthly cashflow
- —
- DSCR
- —
- Eligible?
- —
Personal DTI + credit; lowest rate.
DSCR
20% down · 8.5% · 30yr
- Down + closing
- —
- Monthly P&I
- —
- Monthly cashflow
- —
- DSCR
- —
- Eligible?
- —
No personal income docs; deal must DSCR.
Hard money
10% down · 12.0% · 12mo
- Down + closing
- —
- Monthly P&I
- —
- Monthly cashflow
- —
- DSCR
- —
- Eligible?
- —
Short-term bridge; refi at stabilization.
Rent comps 9 comps
| Address | Beds | Baths | Sqft | Rent | $/sqft | DOM | Units | Dist |
|---|---|---|---|---|---|---|---|---|
| 629 Old Liverpool Rd Liverpool, NY | 1.0–2.0 | 1.0–2.0 | 1150 | $2,650 | $2.30 | 14d | 1 | 0.20mi |
| 368 Electronics Pkwy Unit 368D Liverpool, NY | 3.0 | 2.0 | 1242 | $1,600 | $1.29 | 44d | 1 | 0.20mi |
| 213 Sunflower Dr Liverpool, NY | 3.0 | 1.0 | 936 | $2,450 | $2.62 | 14d | 1 | 0.48mi |
| 429 Beechwood Ave Liverpool, NY | 3.0 | 1.0 | 900 | $2,000 | $2.22 | 22d | 1 | 0.49mi |
| 24 Town Garden Dr Liverpool, NY | 1.0–2.0 | 1.0 | 825 | $1,435 | $1.74 | 14d | 1 | 0.55mi |
| 130 Old Liverpool Rd Liverpool, NY | 4.0 | 1.0 | 1100 | $1,700 | $1.55 | 14d | 1 | 1.01mi |
| 6715 Buckley Rd Syracuse, NY | 1.0–2.0 | 1.0 | 725 | $2,175 | $3.00 | 14d | 5 | 1.06mi |
| 122 Memphis St Liverpool, NY | 2.0 | 1.5 | 1450 | $2,695 | $1.86 | 14d | 1 | 1.17mi |
| 100 Buckley Rd Liverpool, NY | 1.0–2.0 | 1.0–2.0 | 985 | $3,850 | $3.91 | 14d | 1 | 1.27mi |
Listing history 8 events
-
2026-06-18days on market $199,900 Active 7 DOM
-
2026-06-17days on market $199,900 Active 6 DOM
-
2026-06-16days on market $199,900 Active 5 DOM
-
2026-06-15days on market $199,900 Active 4 DOM
-
2026-06-14pricestatus $199,900 Active 2 DOM
-
2026-06-10remarks 394-char remark
-
2026-05-17status Pending 355-char remark
-
2026-05-14$169,900 Active 355-char remark
ⓘ Source: listings_history table (triggers on properties + properties_extension) + one-shot
backfill from property_details.listing_events for pre-trigger history.
Tax reassessment forecast NY · Partial reset (capped growth)
- Current annual tax
- $5,238 · $437/mo
- Projected year-2 tax
- $5,238 · $437/mo
- Expected delta
- $0/yr ($0/mo · 0.0%)
ⓘ Screening estimate from a state-policy table — verify with the county assessor before closing.
Climate risk First Street
- Flood 1/10 Low FEMA zone X (unshaded) · 0% chance over 30 yrs
- Wildfire 1/10 Low
- Heat 3/10 Moderate 7 d/yr ≥96°F today · 16 d/yr by 30 yrs out
- Wind 1/10 Low 0% chance of damaging wind over 30 yrs
- Air quality 2/10 Low 0 unhealthy d/yr today · 1 by 30 yrs out
Nearby sold comps map
Loading sold comps map…
Walkable amenities ~0.75 mi
Loading nearby amenities…
Taxation est. · year 1
- Rental income
- $26,132
- − Mortgage interest
- −$11,198
- − Property taxes
- −$5,238
- − Insurance
- −$1,000
- − Repairs & maintenance
- −$2,091
- − Management
- −$2,091
- − Depreciation
- −$5,815
- Taxable loss
- −$1,300
- Est. tax savings @ 24.0%
- +$312
- After-tax cash flow
- $2,139/yr
For passive investors: Depreciation is non-cash, so a rental often shows a tax loss while cash-flowing — sheltering income. Rental losses are passive: they offset passive income freely, and up to $25,000/yr can offset ordinary (W-2) income if you actively participate and your MAGI is under $100k (phasing out to $0 by $150k); unused losses carry forward. On sale, claimed depreciation is recaptured at up to 25%, and gains may owe capital-gains tax (a 1031 exchange can defer both). Figures are a year-1 estimate at your 24.0% rate — not tax advice; consult a CPA.
Schools (NCES district)
- District
- Liverpool Central School District
- NCES district ID
- 3617520
- Math proficiency
- 49% ▼ -6.00%
- Reading proficiency
- 49% ▲ 1.00%
- Median HH income
- $59,134
- Composite
- 42.84/100
- National rank
- #3134
- State rank
- #381 of 590 in NY
Livability — Galeville
- Score
- 74/100
- State rank
- #280
- US rank
- #4444
Category grades
Schools grade is shown separately in the Schools card above.
Census & demographics
- Population (ZIP)
- 21,875
Population outlook (Onondaga County) Hauer SSP2
- Today (2025)
- 467,894 people
- By 2030
- 463,381 · -1.0%
- By 2040
- 447,697 · -4.3%
- By 2050
- 426,399 · -8.9%
- By 2075
- 373,661 · -20.1%
- By 2100
- 307,967 · -34.2%
Race, ethnicity, and origin ACS 2023
- Neighborhood character
- Predominantly White (84%)
- Race & ethnicity
- White 84% Hispanic / Latino 5% Two or more races 5% Asian 4% Black 3%
- Hispanic origin (detail)
- Common ancestry
- Romanian 8% Lithuanian 4% Italian 2%
- Foreign-born
- 8% · Canada, Vietnam, China
- Languages at home
- 89% English-only · Spanish 3% Other Indo-European 2% Vietnamese 1%
Political lean MEDSL · Onondaga
- 2024 margin
- D (+17.3) · D 58.6% · R 41.4%
- 2008→2024 swing
- -3.0pp toward R · 2008: 20.3pp · 2024: 17.3pp
- All cycles
- 2024: D+17.3 2020: D+20.6 2016: D+12.8 2012: D+21.1 2008: D+20.3
Not yet ingested
- Civics
- —
Market trends
- HPI YoY
- ▼ -185.59%
- Current HPI
- 334.0109
- Rent YoY
- —
- Metro
- —
- State GDP YoY
- ▲ 2.60%
- F500 in state
- 92
Industry mix (Fortune 500 HQ in NY)
| Industry | F500 HQs | Revenue |
|---|---|---|
| Financial Services | 10 | $950B |
|
||
| Consumer Goods | 9 | $162B |
|
||
| Insurance | 4 | $225B |
|
||
| Telecommunications | 2 | $144B |
|
||
| Pharmaceuticals | 2 | $112B |
|
||
| Media / Entertainment | 2 | $69B |
|
||
Price history
+17.7% since first listed4 events — show timeline
- 2026-06-14 Relisted — CNYIS
- 2026-05-17 Pending — CNYIS
- 2026-05-16 Price Changed $199,900 CNYIS
- 2026-05-14 Listed $169,900 CNYIS
Property tax history
+1.3%/yrLatest (2025): $5,238 · +2.9% YoY. Source: county tax records.
Cash-flow waterfall
monthlySold comps — $/sqft
last 12 mo · ≤1 miLoading sold comps…