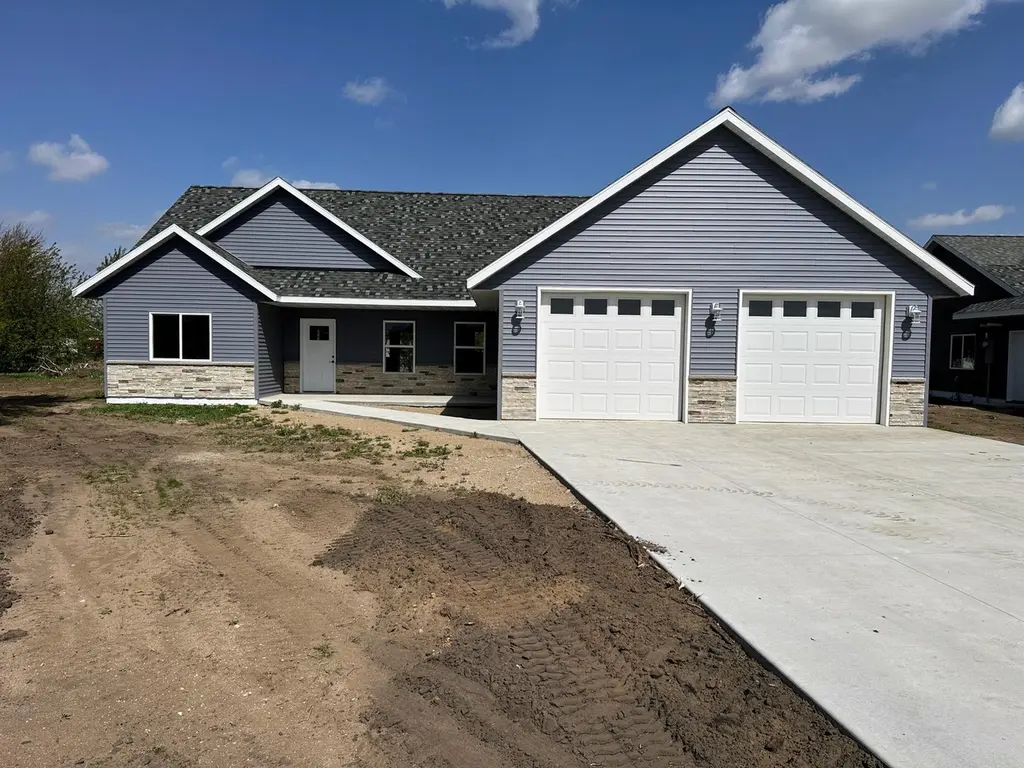
706 11th St NW · Perham, MN
Flood risk 1/10 · Minimal
- FEMA flood zone
- —
- Chance of flooding over 30 yrs
- 0.0%
- Est. flood insurance / yr
- —
Fire risk 3/10 · Minor
- Est. fire insurance / yr
- $888 – $1,650
Heat risk 2/10 · Minimal
- Hot days now (above 97°F)
- 7 days/yr
- Hot days in 30 yrs
- 12 days/yr
Wind risk 2/10 · Minimal
- Chance of severe wind over 30 yrs
- —
Air-quality risk 3/10 · Minor
- Unhealthy air days now
- 2 days/yr
- Unhealthy air days in 30 yrs
- 3 days/yr
Risk factors via First Street. Map © Google.
Why this score? — see what drove the D grade
The composite is a weighted blend of 9 inputs, each scored 0–100. Each bar is that input's sub-score; the figure is the points it added to the 100-point composite (weight × sub-score).
- Cash flow +11.6/30.0
- ARV discount +7.5/15.0
- Schools +4.4/10.0
- Condition / age +4.0/5.0
- Livability +3.5/5.0
- DSCR +3.4/10.0
- 1% rule +3.3/10.0
- Rent growth +2.5/5.0
- Appreciation +0.0/10.0
$374,500
🖨 Deal sheet 📄 Offer letter ✓ Due diligence
Listing remarks
WELCOME to WESTWIND 4TH Addition-where comfort, convenience and modern design come together. Only 6 homes remain (of 30) in this highly desirable development, so now is the time to make your move! This newly built one-level home features 3 bedrooms, 2 bathrooms, and an inviting open floor plan with vaulted ceilings that create a bright and spacious feel throughout. The kitchen is designed for everyday living and entertaining with a center island, large pantry and stainless steel appliances. The private primary suite offers a walk-in closet and it's own bathroom for added comfort and convenience. Additional highlights include a maintenance-free exterior, attached & insulated garage, hi
Key facts
- Open floor plan
- Large pantry
- Vaulted ceilings
Tags
Property features AI
Finance
- Other: Above-grade finished area ~1,588 (single-level); Lot dimensions noted; lot has underground utilities
Exterior
- Parking: Attached garage; 2-car garage; Garage dimensions approximately 26 x 28; Concrete surface; 8-ft garage door height, 9-ft door width
- Utilities: City water connected; City sewer connected; Natural gas; Electric service with circuit breakers (Ottertail Power)
- Home design: Residential single-story home (one level); New construction; Accessible design with no internal stairs
- Construction: Built as new construction; Asphalt roof; Slab foundation
- Exterior features: Vinyl exterior; Patio; Underground utilities; City street frontage with curbs and paved streets; Publicly maintained road
Interior
- Kitchen: Range; Microwave; Dishwasher; Refrigerator
- Bedrooms: 3 bedrooms, all on the main level
- Bathrooms: One full bathroom on the main floor; 3/4 primary bathroom
- Heating & cooling: Forced air heating; Central air conditioning; Electric water heater
- Interior features: Air-to-air exchanger; Informal dining room; No basement; All living facilities on one level; Main floor bedroom; Main floor laundry; No internal stairs (single-level, accessible design)
- Laundry & utility: Main level laundry; Electric dryer hookup
Neighborhood map
What this means for you Summary
Snapshot
- This is a 3-bed/2.0-bath other listed at $374k. Condition is rated good.
Deal economics
- At list price, monthly cash flow is $-119 ($-1k/yr) — negative.
- To cash-flow at today's rent, offer at most $357k (4.6% below list).
- To meet the 1% rule (rent ≥ 1% of price), the offer needs to be $312k (16.6% below list).
- Recommended offer: $312k (16.6% below list) — sets the bar for 1% rule.
Location & tenants
- Location reads 70/100 on livability (#328 in MN) — a middle-class / working-renter tenant base. Strengths: crime A+, cost of living A+, health & safety A+; Watch: amenities F, commute F, employment F.
- Perham-Dent Public School District (town): math 45% / reading 57% proficiency, ranked #110 of 301 in MN (top 36%) — acceptable for families but not a draw, mixed tenant base, ~2y average lease.
- Market conditions: 92 active listings in the ZIP; 2 comparable units currently listed for rent nearby; 140 units permitted in Otter Tail County in 2024 (48 in 5+ unit buildings).
Forward outlook
- Local home prices are declining (-3.0%/yr); year-one equity from $3k of loan paydown is wiped out by about $11k of value loss. Plan a longer hold.
Negotiation context
- It's been on market 35 days — a 3% lower offer ($363k) is reasonable based on typical stale-listing flexibility.
Questions for the listing agent
- What do current leases actually rent for vs. the listed asking? Can we see a recent rent roll and the last 12 months of T-12 income?
- It's been on market 35 days. Have you received any prior offers? Is the seller open to a 17% concession, seller financing, or rate buy-down credit?
- Is there a deadline driving the sale (1031 exchange, divorce, estate, relocation)? That informs how much negotiation room exists.
- Schools are B-rated — typically a magnet for longer-tenancy family renters. What's the average tenant stay here, and is there a school-zone premium baked into asking?
- The area grade is low — what's the realistic commute time and amenity access for the typical tenant pool here? Any planned neighborhood developments (good or bad) we should know about?
- What's the average days-on-market for RENTAL listings here right now (not sales)? A rising rental-DOM trend means longer vacancies and softer asking-rent achievability than the comps imply.
- What's the recent tenant-quality profile in this submarket — average credit score on applications, eviction rate, late-payment / NSF rate, and stable-employment percentage? A property-management company in the area should have these aggregated.
- How much new for-sale + rental construction is in the pipeline within 1–3 miles? Heavy new supply typically softens prices + rents 12–24 months out; constrained supply supports both.
Investment metrics
- 1% rule
- 0.83% ✗
- Cap rate
- 5.91%
- Cash-on-cash
- -1.37%
- DSCR
- 0.94
- GRM
- 10.0
CMA / ARV
No comps found within radius.
Projected returns pro-forma
-3.0% appreciation · 3.0% rent growth · sell at horizon
- IRR
- -18.5%
- Equity multiple
- 0.35×
- Total profit
- $-68,238
- Equity at exit
- $55,839
- IRR
- -10.9%
- Equity multiple
- 0.34×
- Total profit
- $-69,016
- Equity at exit
- $32,380
Cash invested: $104,860 (down + closing). Projections, not guarantees.
Landlord ↔ Tenant lean methodology
- Overall (STATE)
- 46 Balanced
- State Minnesota
- 46 Balanced · D+2
- County
- — inherits STATE
- City
- — inherits STATE
ZIP-level market 56573
- Home prices YoY
- -15.8%
- Active inventory
- 92
- Price-to-rent
- 10.0×
Monthly cashflow live
- Estimated rent
- $3,125 medium interval (Pro) →
- Mortgage (P&I)
- −$1,964
- Tax est. 1.5%
- −$468 /mo · $5,618/yr
- Insurance
- −$156
- HOA
- −$0
- Vacancy / Maint / Mgmt
- −$656
- Net cashflow
- $-119
Break-even live
UW: 25.0% down · 7.5% · 30yr · 1.5% tax · 5.0% vac · 8.0% maint · 8.0% mgmt
Financing live
Cash to close
- Down payment
- $93,625
- Closing costs
- $11,235
- Reserves months
- —
- Total cash needed
- —
Loan-product check · same deal, 3 products live
Conventional
25% down · 7.5% · 30yr
- Down + closing
- —
- Monthly P&I
- —
- Monthly cashflow
- —
- DSCR
- —
- Eligible?
- —
Personal DTI + credit; lowest rate.
DSCR
20% down · 8.5% · 30yr
- Down + closing
- —
- Monthly P&I
- —
- Monthly cashflow
- —
- DSCR
- —
- Eligible?
- —
No personal income docs; deal must DSCR.
Hard money
10% down · 12.0% · 12mo
- Down + closing
- —
- Monthly P&I
- —
- Monthly cashflow
- —
- DSCR
- —
- Eligible?
- —
Short-term bridge; refi at stabilization.
Rent comps 2 comps
| Address | Beds | Baths | Sqft | Rent | $/sqft | DOM | Units | Dist |
|---|---|---|---|---|---|---|---|---|
| 812 7th St SW Unit A Perham, MN | 3.0 | 2.0 | 1602 | $3,750 | $2.34 | 44d | 1 | 1.11mi |
| 812 7th St SW Unit B Perham, MN | 3.0 | 2.0 | 1602 | $2,500 | $1.56 | 44d | 1 | 1.11mi |
Listing history 16 events
-
2026-06-18days on market $374,500 Active 35 DOM
-
2026-06-17days on market $374,500 Active 34 DOM
-
2026-06-16days on market $374,500 Active 33 DOM
-
2026-06-15days on market $374,500 Active 32 DOM
-
2026-06-13days on market $374,500 Active 30 DOM
-
2026-06-12days on market $374,500 Active 29 DOM
-
2026-06-09days on market $374,500 Active 26 DOM
-
2026-06-08days on market $374,500 Active 25 DOM
-
2026-06-07days on market $374,500 Active 24 DOM
-
2026-06-07days on market $374,500 Active 23 DOM
-
2026-06-04days on market $374,500 Active 20 DOM
-
2026-06-02days on market $374,500 Active 19 DOM
-
2026-06-01days on market $374,500 Active 18 DOM
-
2026-05-31days on market $374,500 Active 17 DOM
-
2026-05-31days on market $374,500 Active 16 DOM
-
2026-05-14$374,500 Active 1030-char remark
ⓘ Source: listings_history table (triggers on properties + properties_extension) + one-shot
backfill from property_details.listing_events for pre-trigger history.
Climate risk First Street
- Flood 1/10 Low 0% chance over 30 yrs
- Wildfire 3/10 Moderate
- Heat 2/10 Low 7 d/yr ≥97°F today · 12 d/yr by 30 yrs out
- Wind 2/10 Low
- Air quality 3/10 Moderate 2 unhealthy d/yr today · 3 by 30 yrs out
Nearby sold comps map
Loading sold comps map…
Walkable amenities ~0.75 mi
Loading nearby amenities…
Taxation est. · year 1
- Rental income
- $37,500
- − Mortgage interest
- −$20,978
- − Property taxes
- −$5,618
- − Insurance
- −$1,872
- − Repairs & maintenance
- −$3,000
- − Management
- −$3,000
- − Depreciation
- −$10,895
- Taxable loss
- −$7,862
- Est. tax savings @ 24.0%
- +$1,887
- After-tax cash flow
- $455/yr
For passive investors: Depreciation is non-cash, so a rental often shows a tax loss while cash-flowing — sheltering income. Rental losses are passive: they offset passive income freely, and up to $25,000/yr can offset ordinary (W-2) income if you actively participate and your MAGI is under $100k (phasing out to $0 by $150k); unused losses carry forward. On sale, claimed depreciation is recaptured at up to 25%, and gains may owe capital-gains tax (a 1031 exchange can defer both). Figures are a year-1 estimate at your 24.0% rate — not tax advice; consult a CPA.
Condition & rehab AI · 5 photos
This newly built home in a desirable development offers a good condition with modern amenities and a good layout. It is move-in ready with minimal updates needed to enhance its value.
Value-add opportunities
- Both Landscaping and curb appeal improvements — Enhances curb appeal and can attract more buyers.
- Both Add a smart home system — Improves convenience and can be a selling point for buyers.
- Both Install smart lighting — Enhances energy efficiency and can be a selling point for buyers.
Renovation cost estimate screening
Value-add ROI direction
- Both Landscaping and curb appeal improvements — Enhances curb appeal and can attract more buyers. ↑
- Both Add a smart home system — Improves convenience and can be a selling point for buyers. ↑
- Both Install smart lighting — Enhances energy efficiency and can be a selling point for buyers. ↑
ⓘ Cost ranges are severity-bucket heuristics (US national rule-of-thumb). Get contractor quotes + a written scope before underwriting a rehab budget.
Schools (NCES district)
- District
- Perham-Dent Public School District
- NCES district ID
- 2728230
- Math proficiency
- 45% ▼ -14.00%
- Reading proficiency
- 57% ▼ -5.00%
- Median HH income
- $50,712
- Composite
- 43.64/100
- National rank
- #2966
- State rank
- #110 of 301 in MN
Livability — Perham
- Score
- 70/100
- State rank
- #328
- US rank
- #7425
Category grades
Schools grade is shown separately in the Schools card above.
Census & demographics
- Census place
- Perham, MN
- Population (ZIP)
- 6,868
Population outlook (Otter Tail County) Hauer SSP2
- Today (2025)
- 58,183 people
- By 2030
- 58,267 · +0.1%
- By 2040
- 57,999 · -0.3%
- By 2050
- 57,183 · -1.7%
- By 2075
- 57,638 · -0.9%
- By 2100
- 54,697 · -6.0%
Race, ethnicity, and origin ACS 2023
- Neighborhood character
- Predominantly White (86%)
- Race & ethnicity
- White 86% Hispanic / Latino 9% Two or more races 6% Black 1%
- Hispanic origin (detail)
- Mexican 2% Dominican 1%
- Common ancestry
- Portuguese 18% Romanian 6% Lithuanian 3%
- Foreign-born
- 5% · Canada
- Languages at home
- 92% English-only · Spanish 7%
Political lean MEDSL · Otter Tail
- 2024 margin
- Solid R (+34.2) · D 32.1% · R 66.3% · Other 1.6%
- 2008→2024 swing
- -21.3pp toward R · 2008: -12.9pp · 2024: -34.2pp
- All cycles
- 2024: R+34.2 2020: R+32.5 2016: R+35.9 2012: R+21.2 2008: R+12.9
Not yet ingested
- Civics
- —
Market trends
- HPI YoY
- ▼ -42.48%
- Current HPI
- 225.7071
- Rent YoY
- —
- Metro
- —
- State GDP YoY
- ▲ 2.41%
- F500 in state
- 34
Industry mix (Fortune 500 HQ in MN)
| Industry | F500 HQs | Revenue |
|---|---|---|
| Healthcare | 2 | $407B |
|
||
| Retail | 2 | $150B |
|
||
| Consumer Goods | 2 | $32B |
|
||
| Industrial Machinery | 2 | $6B |
|
||
| Agriculture | 1 | $40B |
|
||
| Healthcare / Medical Devices | 1 | $32B |
|
||
Price history
1 event — show timeline
- 2026-05-14 Listed $374,500 NORTHSTARMLS as Distributed by MLS Grid
Property tax history
+33.9%/yrLatest (2025): $172 · +41.0% YoY. Source: county tax records.
Cash-flow waterfall
monthlySold comps — $/sqft
last 12 mo · ≤1 miLoading sold comps…