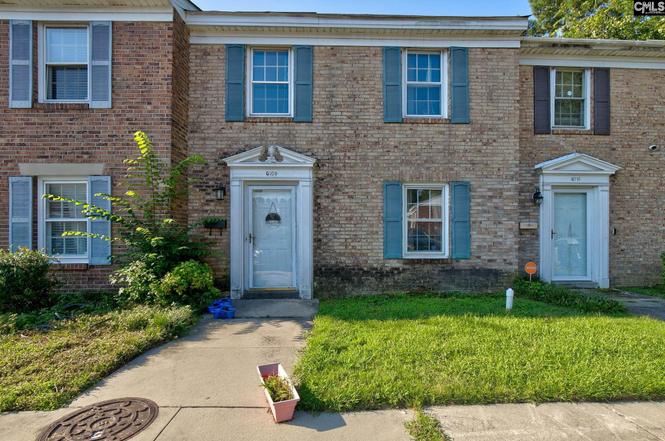
7602 Hunt Club Rd Unit Q109 · Woodfield, SC
Flood risk No data
- FEMA flood zone
- —
- Chance of flooding over 30 yrs
- —
- Est. flood insurance / yr
- —
Fire risk No data
- Est. fire insurance / yr
- —
Heat risk No data
- Hot days now (above threshold)
- —
- Hot days in 30 yrs
- —
Wind risk No data
- Chance of severe wind over 30 yrs
- —
Air-quality risk No data
- Unhealthy air days now
- —
- Unhealthy air days in 30 yrs
- —
Risk factors via First Street. Map © Google.
Why this score? — see what drove the C+ grade
The composite is a weighted blend of 9 inputs, each scored 0–100. Each bar is that input's sub-score; the figure is the points it added to the 100-point composite (weight × sub-score).
- Cash flow +24.8/30.0
- 1% rule +10.0/10.0
- DSCR +8.0/10.0
- ARV discount +7.5/15.0
- Schools +3.6/10.0
- Livability +3.2/5.0
- Rent growth +2.6/5.0
- Condition / age +2.5/5.0
- Appreciation +0.0/10.0
$89,500
🖨 Deal sheet 📄 Offer letter ✓ Due diligence
Listing remarks
All investors Dream! Tenant in place transferable with This property, and the terms of its sale. . Start receiving income . .. This property will not last long Bring all offers to the table Sold AS Is Disclaimer: CMLS has not reviewed and, therefore, does not endorse vendors who may appear in listings.
Key facts
- $381 HOA
- Parking
- Community pool
Property features AI
Finance
- Other: Directions: I-77 to Decker Blvd, continue on Decker Blvd, right on O'Neil Ct, right onto Hunt Club Rd, right onto Worthing Dr (Creekside subdivision), left on Hunt End Ct — building will be on the right.
- HOA & community: Property is part of an association; Association amenities include clubhouse, pool, playground, tennis courts, common area maintenance, road maintenance, street light maintenance, sewer, and trash service
Exterior
- Parking: One parking space
- Utilities: Public sewer
- Home design: Two-story property
- Construction: Slab foundation
- Exterior features: Brick exterior above foundation; Paved road access; Public water
Interior
- Kitchen: Formica countertops; Tile kitchen floor
- Bedrooms: Master bedroom on the main level
- Flooring: Tile flooring in dining area and kitchen
- Bathrooms: Two full bathrooms; One half bathroom; Two additional full bathrooms
- Heating & cooling: Central heating; Central air conditioning
- Interior features: Formal dining room with molding and tile flooring; Tile countertops in kitchen
Neighborhood map
What this means for you Summary
Snapshot
- This is a 3-bed/2.5-bath condo listed at $90k.
Deal economics
- At list price, monthly cash flow is $189 ($2k/yr) — positive.
- The deal already cash-flows at list — no discount required.
- Meets the 1% rule at list price ($2k rent vs $90k).
- Recommended offer: $79k (12.0% below list) — sets the bar for market timing.
Location & tenants
- Location reads 63/100 on livability (#165 in SC) — a middle-class / working-renter tenant base. Strengths: cost of living A+, housing A+; Watch: employment D+, crime D-, amenities F.
- Richland 02 (suburban): math 35% / reading 47% proficiency, ranked #29 of 80 in SC (top 36%) — families likely to look elsewhere, expect single-tenant / working-renter base with shorter leases.
- Zoned schools: Jackson Creek Elementary (math 26% / reading 24%, grade F, #447 of 597 statewide, top 76%, 545 students, 100% FRL) — zoned schools average 100% FRL vs 38% district-wide (62 pts higher); higher-poverty schools than district average — tighter screening recommended.
- Zoned-school proficiency averages 25% at this address vs 41% district-wide (-16 pts) — the specific schools serving this property underperform the Richland 02 average; the district grade overstates school quality for this exact location.
- Market conditions: Rents flat; 341 active listings in the ZIP; 23 comparable units currently listed for rent nearby; rentals at typical pace (median 23d on market — plan ~3-4 weeks tenant-placement turnaround); 3,472 units permitted in Richland County in 2024 (1,096 in 5+ unit buildings).
Forward outlook
- Local home prices are declining (-3.0%/yr); year-one equity from $619 of loan paydown is wiped out by about $3k of value loss. Plan a longer hold.
- Richland County population projected at +30% by 2050 — long-run rental-demand tailwind backs the buy-and-hold thesis.
Negotiation context
- It's been on market 275 days — a 12% lower offer ($79k) is reasonable based on typical stale-listing flexibility.
Risks & watch-outs
- Watch-outs: HOA is 25% of rent.
Questions for the listing agent
- It's been on market 275 days. Have you received any prior offers? Is the seller open to a 12% concession, seller financing, or rate buy-down credit?
- Built in 1973 — when were the roof, HVAC, electrical panel, plumbing, and water heater last replaced?
- What does the HOA fee cover, when was the last increase, and are there any pending special assessments or reserve-fund shortfalls?
- Any open or pending special assessments — roof, HVAC, plumbing, elevator, façade? What's the per-unit balance and payoff schedule, and is the seller paying it off at close or rolling it to the buyer?
- Why hasn't it sold? Are there any deal-killer items the seller is aware of (foundation, flood, title, zoning, code violations)?
- Is there a deadline driving the sale (1031 exchange, divorce, estate, relocation)? That informs how much negotiation room exists.
- Schools are D-rated, which usually means shorter tenancies and higher turnover. Who's the typical renter profile here, and what's been the actual vacancy rate?
- Crime grade is D in this area — have there been break-ins, vandalism, or insurance claims at this property in the last 3 years? What carrier currently insures it and at what premium?
- What's the average days-on-market for RENTAL listings here right now (not sales)? A rising rental-DOM trend means longer vacancies and softer asking-rent achievability than the comps imply.
- What's the recent tenant-quality profile in this submarket — average credit score on applications, eviction rate, late-payment / NSF rate, and stable-employment percentage? A property-management company in the area should have these aggregated.
- How much new apartment / multifamily construction is in the pipeline within 1–3 miles? Heavy new supply (>2% of stock underway) typically softens rents 12–24 months out; light construction supports rent growth.
Investment metrics
- 1% rule
- 1.68% ✓
- Cap rate
- 8.82%
- Cash-on-cash
- 9.03%
- DSCR
- 1.40
- GRM
- 5.0
CMA / ARV
No comps found within radius.
Projected returns pro-forma
-3.0% appreciation · 0.21% rent growth · sell at horizon
- IRR
- -7.1%
- Equity multiple
- 0.75×
- Total profit
- $-6,340
- Equity at exit
- $13,345
- IRR
- -3.6%
- Equity multiple
- 0.80×
- Total profit
- $-4,948
- Equity at exit
- $7,738
Cash invested: $25,060 (down + closing). Projections, not guarantees.
Landlord ↔ Tenant lean methodology
- Overall (STATE)
- 90 Strongly Landlord-Friendly
- State South Carolina
- 90 Strongly Landlord-Friendly · R+6
- County
- — inherits STATE
- City
- — inherits STATE
ZIP-level market 29223
- Rents YoY
- 0.2%
- Active inventory
- 341
- Price-to-rent
- 5.0×
Monthly cashflow live
- Estimated rent
- $1,504 high interval (Pro) →
- Mortgage (P&I)
- −$469
- Tax est. 1.5%
- −$112 /mo · $1,342/yr
- Insurance
- −$37
- HOA
- −$381
- Vacancy / Maint / Mgmt
- −$316
- Net cashflow
- $189
Break-even live
UW: 25.0% down · 7.5% · 30yr · 1.5% tax · 5.0% vac · 8.0% maint · 8.0% mgmt
Financing live
Cash to close
- Down payment
- $22,375
- Closing costs
- $2,685
- Reserves months
- —
- Total cash needed
- —
Loan-product check · same deal, 3 products live
Conventional
25% down · 7.5% · 30yr
- Down + closing
- —
- Monthly P&I
- —
- Monthly cashflow
- —
- DSCR
- —
- Eligible?
- —
Personal DTI + credit; lowest rate.
DSCR
20% down · 8.5% · 30yr
- Down + closing
- —
- Monthly P&I
- —
- Monthly cashflow
- —
- DSCR
- —
- Eligible?
- —
No personal income docs; deal must DSCR.
Hard money
10% down · 12.0% · 12mo
- Down + closing
- —
- Monthly P&I
- —
- Monthly cashflow
- —
- DSCR
- —
- Eligible?
- —
Short-term bridge; refi at stabilization.
Rent comps 23 comps
| Address | Beds | Baths | Sqft | Rent | $/sqft | DOM | Units | Dist |
|---|---|---|---|---|---|---|---|---|
| 7602 Hunt Club Rd Unit I-104 Columbia, SC | 2.0 | 2.5 | 1200 | $1,295 | $1.08 | 18d | 1 | 0.06mi |
| 7602 Hunt Club Rd Columbia, SC | 1.0–2.0 | 1.0–2.5 | 950 | $1,295 | $1.36 | 23d | 2 | 0.07mi |
| 7502 Hunt Club Rd Columbia, SC | 1.0–2.0 | 1.0–2.0 | 825 | $1,305 | $1.58 | 3d | 22 | 0.17mi |
| 7502 Hunt Club Rd Columbia, SC | 1.0–3.0 | 1.0–2.0 | 875 | $1,515 | $1.73 | 23d | 1 | 0.17mi |
| 300 Meredith Sq Columbia, SC | 2.0–3.0 | 2.0–2.5 | 1258 | $1,499 | $1.19 | 23d | 1 | 0.22mi |
| 7501 Brookfield Rd Columbia, SC | 1.0–3.0 | 1.0–2.5 | 1097 | $1,249 | $1.14 | 23d | 1 | 0.31mi |
| 7400 Hunt Club Rd Columbia, SC | 1.0–3.0 | 1.0–2.0 | 1087 | $1,200 | $1.10 | 23d | 1 | 0.38mi |
| 7006 Brookfield Rd Columbia, SC | 1.0–3.0 | 1.0–2.0 | 1090 | $1,295 | $1.19 | 11d | 7 | 0.62mi |
| 8720 Windsor Lake Blvd Columbia, SC | 1.0–3.0 | 1.0–2.0 | 967 | $1,415 | $1.46 | 23d | 15 | 0.63mi |
| 1630 Edgemore Rd Unit 1 Columbia, SC | 3.0 | 2.0 | 1225 | $1,650 | $1.35 | 23d | 1 | 0.78mi |
| 2102 Long Shadow Ln Columbia, SC | 2.0 | 1.5 | 1150 | $1,300 | $1.13 | 3d | 1 | 0.78mi |
| 6905 Cleaton Rd Columbia, SC | 3.0 | 2.5–3.0 | 1546 | $1,925 | $1.25 | 23d | 3 | 0.81mi |
| 1310 Oakcrest Dr Columbia, SC | 1.0–3.0 | 1.0–2.0 | 1110 | $1,848 | $1.66 | 3d | 27 | 0.86mi |
| 1000 Windsor Shores Dr Columbia, SC | 1.0–3.0 | 1.0–2.0 | 1011 | $1,590 | $1.57 | 23d | 1 | 0.96mi |
| 1741 Springfield Ave Columbia, SC | 3.0 | 1.0 | 1582 | $930 | $0.59 | 11d | 1 | 1.05mi |
| 1633 Overhill Rd Columbia, SC | 3.0 | 1.5 | 1052 | $1,661 | $1.58 | 23d | 1 | 1.05mi |
| 1817 E Boundary Rd Columbia, SC | 4.0 | 2.0 | 1200 | $1,895 | $1.58 | 11d | 1 | 1.08mi |
| 6837 N Trenholm Rd Columbia, SC | 1.0–3.0 | 1.0–2.0 | 1105 | $1,985 | $1.80 | 3d | 30 | 1.10mi |
| 1725 Cheltenham Ln Columbia, SC | 3.0 | 2.0 | 1444 | $1,675 | $1.16 | 23d | 1 | 1.20mi |
| 117 Greenfield Rd Columbia, SC | 3.0 | 2.0 | 2055 | $1,981 | $0.96 | 23d | 1 | 1.26mi |
| 1718 Horseshoe Dr Apt B Columbia, SC | 2.0 | 1.5 | 1050 | $1,300 | $1.24 | 11d | 1 | 1.28mi |
| 3611 Ranch Rd Columbia, SC | 2.0–3.0 | 2.0 | 1400 | $1,400 | $1.00 | 3d | 3 | 1.29mi |
| 3630 Ranch Rd Unit 3-8 Columbia, SC | 2.0 | 2.0 | 1400 | $1,250 | $0.89 | 23d | 1 | 1.40mi |
HOA detail condo
- Monthly dues
- $381 · $4,572/yr
- Assessments
- None detected in remarks — confirm with the listing agent.
Listing history 4 events
-
2026-05-13historical Active - Contingent
-
2025-09-23price $89,500
-
2025-09-11price $99,500
-
2025-08-26$105,000 Active
ⓘ Source: listings_history table (triggers on properties + properties_extension) + one-shot
backfill from property_details.listing_events for pre-trigger history.
Nearby sold comps map
Loading sold comps map…
Walkable amenities ~0.75 mi
Loading nearby amenities…
Taxation est. · year 1
- Rental income
- $18,048
- − Mortgage interest
- −$5,013
- − Property taxes
- −$1,342
- − Insurance
- −$448
- − Repairs & maintenance
- −$1,444
- − Management
- −$1,444
- − HOA
- −$4,572
- − Depreciation
- −$2,604
- Taxable income
- $1,181
- Est. tax owed @ 24.0%
- −$283
- After-tax cash flow
- $1,980/yr
For passive investors: Depreciation is non-cash, so a rental often shows a tax loss while cash-flowing — sheltering income. Rental losses are passive: they offset passive income freely, and up to $25,000/yr can offset ordinary (W-2) income if you actively participate and your MAGI is under $100k (phasing out to $0 by $150k); unused losses carry forward. On sale, claimed depreciation is recaptured at up to 25%, and gains may owe capital-gains tax (a 1031 exchange can defer both). Figures are a year-1 estimate at your 24.0% rate — not tax advice; consult a CPA.
Schools (NCES district)
- District
- Richland 02
- NCES district ID
- 4503390
- Math proficiency
- 35% ▼ -15.00%
- Reading proficiency
- 47% ▼ -5.00%
- Median HH income
- $59,684
- Composite
- 36.2/100
- National rank
- #4730
- State rank
- #29 of 80 in SC
Livability — Woodfield
- Score
- 63/100
- State rank
- #165
- US rank
- #15019
Category grades
Schools grade is shown separately in the Schools card above.
Census & demographics
- Census place
- Woodfield, SC
- County
- Richland County · 389,530 people
- Metro
- Columbia, SC
- Population (ZIP)
- 53,074
- Household income
- $62,408
- Rent vs Own
- Severe rent burden
- 2857.0
Population outlook (Richland County) Hauer SSP2
- Today (2025)
- 459,667 people
- By 2030
- 487,524 · +6.1%
- By 2040
- 542,035 · +17.9%
- By 2050
- 595,371 · +29.5%
- By 2075
- 732,998 · +59.5%
- By 2100
- 820,415 · +78.5%
Race, ethnicity, and origin ACS 2023
- Neighborhood character
- Diverse neighborhood (Simpson 0.60)
- Race & ethnicity
- Black 57% White 23% Hispanic / Latino 11% Two or more races 6% Asian 4%
- Hispanic origin (detail)
- Mexican 5% Puerto Rican 2%
- Common ancestry
- Slovak 1% Serbian 1% Italian 1%
- Foreign-born
- 10% · Canada, South Korea
- Languages at home
- 86% English-only · Spanish 8% Other Indo-European 2% Korean 1%
Political lean MEDSL · Richland
- 2024 margin
- Solid D (+34.6) · D 66.4% · R 31.8% · Other 1.8%
- 2008→2024 swing
- +5.7pp toward D · 2008: 28.9pp · 2024: 34.6pp
- All cycles
- 2024: D+34.6 2020: D+38.3 2016: D+32.9 2012: D+33.3 2008: D+28.9
Not yet ingested
- Civics
- —
Market trends
- HPI YoY
- ▼ -135.96%
- Current HPI
- 195.3158
- Rent YoY
- ▲ 0.21%
- Metro
- Columbia, SC
- State GDP YoY
- ▲ 4.51%
- F500 in state
- 2
Industry mix (Fortune 500 HQ in SC)
| Industry | F500 HQs | Revenue |
|---|---|---|
| Packaging | 1 | $7B |
|
||
Price history
-14.8% since first listed4 events — show timeline
- 2026-05-13 Contingent — Consolidated MLS
- 2025-09-23 Price Changed $89,500 Consolidated MLS
- 2025-09-11 Price Changed $99,500 Consolidated MLS
- 2025-08-26 Listed $105,000 Consolidated MLS
Cash-flow waterfall
monthlySold comps — $/sqft
last 12 mo · ≤1 miLoading sold comps…