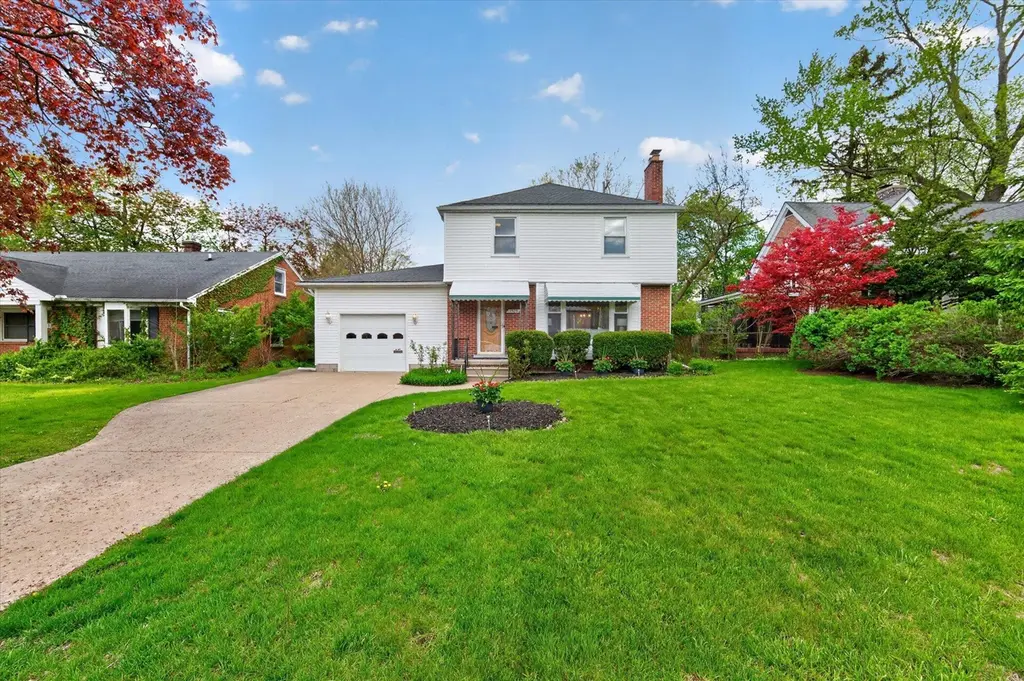
1509 E Stadium Blvd · Ann Arbor, MI
Flood risk 1/10 · Minimal
- FEMA flood zone
- X (unshaded)
- Chance of flooding over 30 yrs
- 0.0%
- Est. flood insurance / yr
- $473 – $860
Fire risk 1/10 · Minimal
- Est. fire insurance / yr
- $784 – $1,456
Heat risk 3/10 · Minor
- Hot days now (above 100°F)
- 7 days/yr
- Hot days in 30 yrs
- 15 days/yr
Wind risk 2/10 · Minimal
- Chance of severe wind over 30 yrs
- —
Air-quality risk 2/10 · Minimal
- Unhealthy air days now
- 1 days/yr
- Unhealthy air days in 30 yrs
- 2 days/yr
Risk factors via First Street. Map © Google.
Why this score? — see what drove the C- grade
The composite is a weighted blend of 9 inputs, each scored 0–100. Each bar is that input's sub-score; the figure is the points it added to the 100-point composite (weight × sub-score).
- ARV discount +15.0/15.0
- Cash flow +14.8/30.0
- Schools +6.5/10.0
- DSCR +4.5/10.0
- Livability +4.4/5.0
- 1% rule +4.0/10.0
- Rent growth +2.8/5.0
- Condition / age +2.5/5.0
- Appreciation +0.0/10.0
$599,000
🖨 Deal sheet 📄 Offer letter ✓ Due diligence
Listing remarks MLS
Welcome to Burns Park living at its finest, where timeless charm meets modern convenience in one of Ann Arbor's most sought-after neighborhoods. Located at 1509 E Stadium Blvd, this beautifully maintained, turnkey home offers the space, flexibility, and thoughtful updates today's buyers are searching for. With 5 bedrooms (which includes a versatile bonus room accessed through one of the bedrooms) this home adapts effortlessly to your lifestyle, whether you need a home office, nursery, or private retreat. A rare and highly desirable feature, the first-floor accessible primary suite with a barrier free shower provides accessibility and ease, complemented by a convenient main-level laundry. Downstairs, a finished basement expands your living space even further and includes a second laundry area, perfect for busy households. Step outside to enjoy your fully fenced backyard, ideal for entertaining, pets, or play.
Key facts
- Barrier free shower
- Finished basement
- Main-level laundry
Tags
Neighborhood map
What this means for you Summary
Snapshot
- This is a 5-bed/2.5-bath single-family listed at $599k.
Deal economics
- At list price, monthly cash flow is $168 ($2k/yr) — positive.
- The deal already cash-flows at list — no discount required.
- To meet the 1% rule (rent ≥ 1% of price), the offer needs to be $538k (10.1% below list).
- Recommended offer: $538k (10.1% below list) — sets the bar for 1% rule.
- Cap rate 6.6% vs local median 2.5% in Ann Arbor — top-decile yield for the area; either an underpriced asset or a hidden risk that comps aren't pricing in. Stress-test before assuming the spread holds.
Location & tenants
- Location reads 88/100 on livability (#10 in MI, #155 nationally) — a professional / high-income tenant draw. Strengths: schools A+, amenities A+, commute A+; Watch: cost of living D.
- Ann Arbor Public Schools (urban): math 71% / reading 81% proficiency, ranked #6 of 540 in MI (top 1%) — strong family-tenant draw, lease renewals of 3-5y typical.
- Market conditions: Rents rising (+1.3%/yr); 149 active listings in the ZIP; 9 comparable units currently listed for rent nearby; rentals lingering (median 44d on market — plan ~5-8 weeks vacancy on turnover, expect pricing pressure); 56% of comp listings sitting > 30 days — soft ceiling on asking rent; 996 units permitted in Washtenaw County in 2024 (492 in 5+ unit buildings).
- At $5,384/mo this rent would consume 101% of the median local household income ($64k/yr) (locally 5044% of renters already pay >50% of income on rent) — very limited rent-growth headroom before tenants either downsize or default.
Forward outlook
- Local home prices are declining (-3.0%/yr); year-one equity from $4k of loan paydown is wiped out by about $18k of value loss. Plan a longer hold.
- Washtenaw County population projected at +25% by 2050 — long-run rental-demand tailwind backs the buy-and-hold thesis.
Negotiation context
- Only 1 days on market — expect competitive offers; lowballing is unlikely to land.
- 5 sale attempts with the ask held roughly flat each time — persistent listings suggest the price (not the market) is what's stuck; bring a comps-based counter.
Risks & watch-outs
- Watch-outs: built in 1950 — expect roof / HVAC / electrical / plumbing capex.
Questions for the listing agent
- Built in 1950 — when were the roof, HVAC, electrical panel, plumbing, and water heater last replaced?
- Is there a deadline driving the sale (1031 exchange, divorce, estate, relocation)? That informs how much negotiation room exists.
- Schools are A-rated — typically a magnet for longer-tenancy family renters. What's the average tenant stay here, and is there a school-zone premium baked into asking?
- What's the average days-on-market for RENTAL listings here right now (not sales)? A rising rental-DOM trend means longer vacancies and softer asking-rent achievability than the comps imply.
- What's the recent tenant-quality profile in this submarket — average credit score on applications, eviction rate, late-payment / NSF rate, and stable-employment percentage? A property-management company in the area should have these aggregated.
- How much new for-sale + rental construction is in the pipeline within 1–3 miles? Heavy new supply typically softens prices + rents 12–24 months out; constrained supply supports both.
Investment metrics
- 1% rule
- 0.90% ✗
- Cap rate
- 6.63%
- Cash-on-cash
- 1.20%
- DSCR
- 1.05
- GRM
- 9.3
CMA / ARV
- ARV (median comp)
- $898,366
- List price
- $599,000
- Delta
- -27.66%
- Verdict
- UNDERPRICED
- Comps
- 20 within 1.0 mi
Show comp detail 12 sales within ~0.75 mi
| Address | Dist | Beds/Ba | Sqft | Sold | Price | $/sf | Match |
|---|---|---|---|---|---|---|---|
| 1615 E Stadium Blvd | 0.14mi | 4/2.5 (-1) | 2,064 (-4%) | 2mo | $500,000 | $242 | 80 |
| 2505 Brockman Blvd | 0.48mi | 5/2.0 | 2,180 (+1%) | 2mo | $800,000 | $367 | 72 |
| 1605 E Stadium Blvd | 0.09mi | 4/2.5 (-1) | 2,407 (+11%) | 1mo | $650,000 | $270 | 70 |
| 1006 Granger Ave | 0.47mi | 5/3.5 | 2,080 (-4%) | 7mo | $910,000 | $438 | 62 |
| 1914 Crestland Dr | 0.53mi | 5/2.5 | 2,204 (+2%) | 14mo | $624,100 | $283 | 60 |
| 1704 Shadford Rd | 0.21mi | 4/2.5 (-1) | 2,454 (+14%) | 6mo | $1,070,000 | $436 | 58 |
| 1054 Ferdon Rd | 0.52mi | 4/2.0 (-1) | 2,118 (-2%) | 11mo | $800,000 | $378 | 56 |
| 1210 Henry St | 0.28mi | 4/3.5 (-1) | 1,887 (-13%) | 1mo | $647,000 | $343 | 56 |
| 1215 Brooklyn Ave | 0.33mi | 4/2.0 (-1) | 1,884 (-13%) | 6mo | $623,500 | $331 | 51 |
| 2107 Ferdon Rd | 0.40mi | 4/2.0 (-1) | 2,391 (+11%) | 6mo | $633,000 | $265 | 51 |
| 1506 Golden Ave | 0.40mi | 4/3.5 (-1) | 1,906 (-12%) | 14mo | $780,000 | $409 | 41 |
| 929 Olivia Ave | 0.67mi | 5/2.5 | 2,478 (+15%) | 12mo | $1,125,000 | $454 | 34 |
Match score weights: distance 35% · size 25% · config 20% · recency 20%. Top-matched comps best support the ARV.
Projected returns pro-forma
-3.0% appreciation · 1.28% rent growth · sell at horizon
- IRR
- -16.3%
- Equity multiple
- 0.43×
- Total profit
- $-95,456
- Equity at exit
- $89,313
- IRR
- -11.3%
- Equity multiple
- 0.37×
- Total profit
- $-105,436
- Equity at exit
- $51,791
Cash invested: $167,720 (down + closing). Projections, not guarantees.
Landlord ↔ Tenant lean methodology
- Overall (STATE)
- 62 Landlord-Friendly
- State Michigan
- 62 Landlord-Friendly · EVEN
- County
- — inherits STATE
- City
- — inherits STATE
ZIP-level market 48104
- Rents YoY
- 1.3%
- Active inventory
- 149
- Price-to-rent
- 9.3×
Monthly cashflow live
- Estimated rent
- $5,384 high interval (Pro) →
- Mortgage (P&I)
- −$3,141
- Tax from tax record
- −$694 /mo · $8,329/yr
- Insurance
- −$250
- HOA
- −$0
- Vacancy / Maint / Mgmt
- −$1,131
- Net cashflow
- $168
Break-even live
UW: 25.0% down · 7.5% · 30yr · 1.5% tax · 5.0% vac · 8.0% maint · 8.0% mgmt
Financing live
Cash to close
- Down payment
- $149,750
- Closing costs
- $17,970
- Reserves months
- —
- Total cash needed
- —
Loan-product check · same deal, 3 products live
Conventional
25% down · 7.5% · 30yr
- Down + closing
- —
- Monthly P&I
- —
- Monthly cashflow
- —
- DSCR
- —
- Eligible?
- —
Personal DTI + credit; lowest rate.
DSCR
20% down · 8.5% · 30yr
- Down + closing
- —
- Monthly P&I
- —
- Monthly cashflow
- —
- DSCR
- —
- Eligible?
- —
No personal income docs; deal must DSCR.
Hard money
10% down · 12.0% · 12mo
- Down + closing
- —
- Monthly P&I
- —
- Monthly cashflow
- —
- DSCR
- —
- Eligible?
- —
Short-term bridge; refi at stabilization.
Rent comps 9 comps
| Address | Beds | Baths | Sqft | Rent | $/sqft | DOM | Units | Dist |
|---|---|---|---|---|---|---|---|---|
| 1119 Granger Ave Ann Arbor, MI | 4.0 | 2.0 | 2200 | $3,900 | $1.77 | 21d | 1 | 0.41mi |
| 1102 S Forest Ave Ann Arbor, MI | 6.0 | 2.0 | 1911 | $8,400 | $4.40 | 21d | 1 | 0.58mi |
| 2225 S State St Ann Arbor, MI | 1.0–4.0 | 1.0–3.5 | 1242 | $3,539 | $2.85 | 14d | 25 | 0.69mi |
| 524 S Forest Ave Unit 524-A Ann Arbor, MI | 6.0 | 2.0 | 1650 | $8,250 | $5.00 | 44d | 1 | 1.04mi |
| 616 Monroe St Unit 616-C Ann Arbor, MI | 6.0 | 2.0 | 1436 | $8,020 | $5.58 | 44d | 1 | 1.05mi |
| 911 S Main St Ann Arbor, MI | 6.0 | 6.0 | 1775 | $1,300 | $0.73 | 44d | 1 | 1.23mi |
| 911 S Main St Unit 201 Ann Arbor, MI | 6.0 | 6.0 | 1824 | $8,100 | $4.44 | 44d | 1 | 1.24mi |
| 720 S Main St Ann Arbor, MI | 4.0 | 1.0 | 1800 | $3,550 | $1.97 | 44d | 1 | 1.32mi |
| 600 S Main St Ann Arbor, MI | 4.0 | 2.0 | 1455 | $5,030 | $3.46 | 14d | 3 | 1.38mi |
Listing history 17 events
-
2026-06-18pricedays on market $599,000 Active 1 DOM
Show marketing remark (921 chars)
Welcome to Burns Park living at its finest, where timeless charm meets modern convenience in one of Ann Arbor's most sought-after neighborhoods. Located at 1509 E Stadium Blvd, this beautifully maintained, turnkey home offers the space, flexibility, and thoughtful updates today's buyers are searching for. With 5 bedrooms (which includes a versatile bonus room accessed through one of the bedrooms) this home adapts effortlessly to your lifestyle, whether you need a home office, nursery, or private retreat. A rare and highly desirable feature, the first-floor accessible primary suite with a barrier free shower provides accessibility and ease, complemented by a convenient main-level laundry. Downstairs, a finished basement expands your living space even further and includes a second laundry area, perfect for busy households. Step outside to enjoy your fully fenced backyard, ideal for entertaining, pets, or play.
-
2026-06-15days on market $649,900 Active 38 DOM
-
2026-06-14days on market $649,900 Active 36 DOM
-
2026-06-10days on market $649,900 Active 33 DOM
-
2026-06-09days on market $649,900 Active 32 DOM
-
2026-06-08days on market $649,900 Active 31 DOM
-
2026-06-07days on market $649,900 Active 30 DOM
-
2026-06-03days on market $649,900 Active 26 DOM
-
2026-06-02days on market $649,900 Active 25 DOM
-
2026-06-01days on market $649,900 Active 24 DOM
-
2026-05-31days on market $649,900 Active 23 DOM
-
2026-05-30days on market $649,900 Active 22 DOM
-
2026-05-08$672,900 Active 1439-char remark
-
2026-05-08$672,900 Active 1450-char remark
-
2026-05-08$672,900 Active
-
2026-05-04historical $672,900
-
2026-05-04historical $672,900 1450-char remark
ⓘ Source: listings_history table (triggers on properties + properties_extension) + one-shot
backfill from property_details.listing_events for pre-trigger history.
Tax reassessment forecast MI · Partial reset (capped growth)
- Current annual tax
- $8,329 · $694/mo
- Projected year-2 tax
- $8,777 · $731/mo
- Expected delta
- +$448/yr (+$37/mo · 5.4%)
ⓘ Screening estimate from a state-policy table — verify with the county assessor before closing.
Climate risk First Street
- Flood 1/10 Low FEMA zone X (unshaded) · 0% chance over 30 yrs
- Wildfire 1/10 Low
- Heat 3/10 Moderate 7 d/yr ≥100°F today · 15 d/yr by 30 yrs out
- Wind 2/10 Low
- Air quality 2/10 Low 1 unhealthy d/yr today · 2 by 30 yrs out
Nearby sold comps map
Loading sold comps map…
Walkable amenities ~0.75 mi
Loading nearby amenities…
Taxation est. · year 1
- Rental income
- $64,605
- − Mortgage interest
- −$33,553
- − Property taxes
- −$8,329
- − Insurance
- −$2,995
- − Repairs & maintenance
- −$5,168
- − Management
- −$5,168
- − Depreciation
- −$17,425
- Taxable loss
- −$8,034
- Est. tax savings @ 24.0%
- +$1,928
- After-tax cash flow
- $3,948/yr
For passive investors: Depreciation is non-cash, so a rental often shows a tax loss while cash-flowing — sheltering income. Rental losses are passive: they offset passive income freely, and up to $25,000/yr can offset ordinary (W-2) income if you actively participate and your MAGI is under $100k (phasing out to $0 by $150k); unused losses carry forward. On sale, claimed depreciation is recaptured at up to 25%, and gains may owe capital-gains tax (a 1031 exchange can defer both). Figures are a year-1 estimate at your 24.0% rate — not tax advice; consult a CPA.
Schools (NCES district)
- District
- Ann Arbor Public Schools
- NCES district ID
- 2602820
- Math proficiency
- 71% ▲ 5.00%
- Reading proficiency
- 81% ▲ 11.00%
- Median HH income
- $60,768
- Composite
- 65.34/100
- National rank
- #487
- State rank
- #6 of 540 in MI
Livability — Ann Arbor
- Score
- 88/100
- State rank
- #10
- US rank
- #155
Category grades
Schools grade is shown separately in the Schools card above.
Census & demographics
- Census place
- Ann Arbor, MI
- County
- Washtenaw County · 306,860 people
- City population
- 163,747
- Metro
- Ann Arbor, MI
- Population (ZIP)
- 43,979
- Household income
- $64,231
- Rent vs Own
- Severe rent burden
- 5044.0
Population outlook (Washtenaw County) Hauer SSP2
- Today (2025)
- 402,878 people
- By 2030
- 424,104 · +5.3%
- By 2040
- 464,633 · +15.3%
- By 2050
- 504,728 · +25.3%
- By 2075
- 614,463 · +52.5%
- By 2100
- 676,181 · +67.8%
Race, ethnicity, and origin ACS 2023
- Neighborhood character
- Predominantly White (74%)
- Race & ethnicity
- White 74% Asian 12% Two or more races 6% Hispanic / Latino 5% Black 5%
- Common ancestry
- Romanian 7% Italian 3% Lithuanian 3%
- Foreign-born
- 13% · China, Canada, South Korea
- Languages at home
- 83% English-only · Chinese 4% Other Indo-European 3% Spanish 3%
Political lean MEDSL · Washtenaw
- 2024 margin
- Solid D (+44.4) · D 71.0% · R 26.6% · Other 2.4%
- 2008→2024 swing
- +3.5pp toward D · 2008: 41.0pp · 2024: 44.4pp
- All cycles
- 2024: D+44.4 2020: D+46.6 2016: D+41.5 2012: D+36.0 2008: D+41.0
Not yet ingested
- Civics
- —
Market trends
- HPI YoY
- ▼ -489.48%
- Current HPI
- 246.6752
- Rent YoY
- ▲ 1.28%
- Metro
- Ann Arbor, MI
- State GDP YoY
- ▲ 1.37%
- F500 in state
- 28
Industry mix (Fortune 500 HQ in MI)
| Industry | F500 HQs | Revenue |
|---|---|---|
| Automotive Parts | 3 | $48B |
|
||
| Automotive | 2 | $372B |
|
||
| Chemicals | 1 | $45B |
|
||
| Automotive Retail | 1 | $29B |
|
||
| Healthcare / Medical Devices | 1 | $23B |
|
||
| Automotive Technology | 1 | $20B |
|
||
Price history
-11.0% since first listed10 events — show timeline
- 2026-06-18 Listed $599,000 REALCOMP
- 2026-06-18 Listed $599,000 MiRealSource-MiMLS
- 2026-06-18 Listed $599,000 SW Michigan MLS
- 2026-06-15 Listing Removed — MiRealSource-MiMLS
- 2026-05-24 Price Changed $649,900 MiRealSource-MiMLS
- 2026-05-23 Price Changed $649,900 REALCOMP
- 2026-05-23 Price Changed $649,900 SW Michigan MLS
- 2026-05-08 Listed $672,900 REALCOMP
- 2026-05-08 Listed $672,900 MiRealSource-MiMLS
- 2026-05-04 Coming Soon — MiRealSource-MiMLS
Property tax history
+3.7%/yrLatest (2025): $8,329 · +2.4% YoY. Source: county tax records.
Cash-flow waterfall
monthlySold comps — $/sqft
last 12 mo · ≤1 miLoading sold comps…