3119 Bailey Ave Unit 3D · New York, NY
Flood risk 1/10 · Minimal
- FEMA flood zone
- X (unshaded)
- Chance of flooding over 30 yrs
- 0.0%
- Est. flood insurance / yr
- $507 – $1,088
Fire risk 1/10 · Minimal
- Est. fire insurance / yr
- $691 – $1,283
Heat risk 6/10 · Moderate
- Hot days now (above 99°F)
- 7 days/yr
- Hot days in 30 yrs
- 14 days/yr
Wind risk 6/10 · Moderate
- Chance of severe wind over 30 yrs
- 27.0%
Air-quality risk 3/10 · Minor
- Unhealthy air days now
- 3 days/yr
- Unhealthy air days in 30 yrs
- 4 days/yr
Risk factors via First Street. Map © Google.
Why this score? — see what drove the D grade
The composite is a weighted blend of 9 inputs, each scored 0–100. Each bar is that input's sub-score; the figure is the points it added to the 100-point composite (weight × sub-score).
- Cash flow +7.5/30.0
- ARV discount +7.5/15.0
- 1% rule +6.7/10.0
- Rent growth +5.0/5.0
- Schools +5.0/10.0
- Condition / age +4.0/5.0
- Livability +3.8/5.0
- DSCR +1.6/10.0
- Appreciation +0.0/10.0
$320,000
🖨 Deal sheet (PDF) 📄 Offer letter ✓ Due diligence
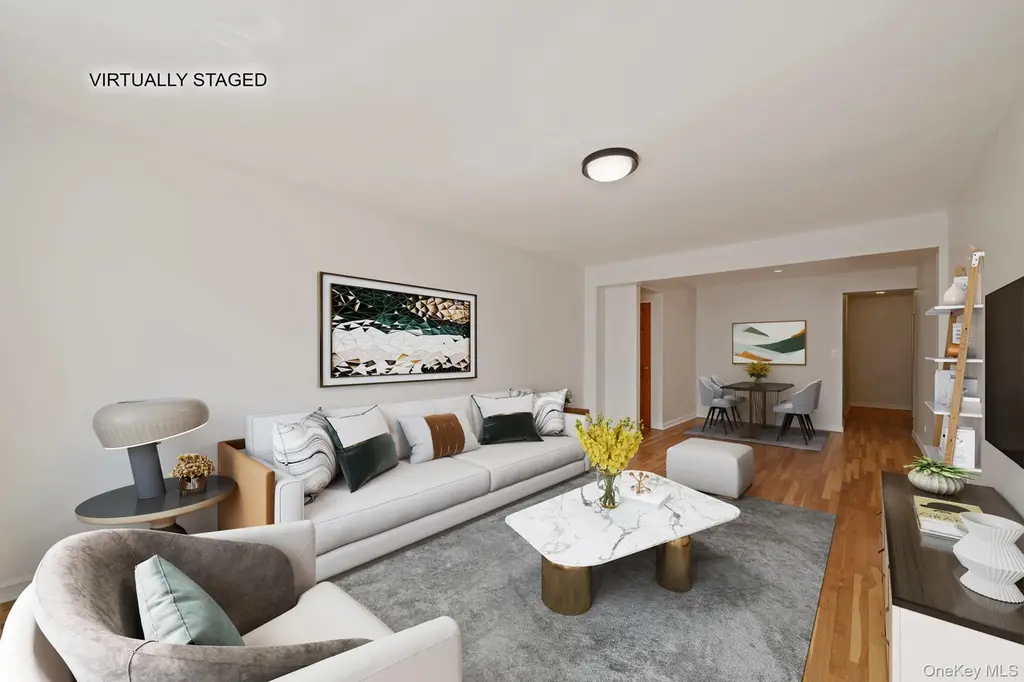
Listing remarks MLS
A Hidden Gem within the vibrant community of Kingsbridge, positioned right outside of Riverdale. This sophisticated fully renovated two bedroom offers both western and eastern light exposures, plank glossy hard wood floors, well equipped kitchen with brand new stainless steal appliances and well designed bathroom also with its own upgrades. The bedrooms are generously sized and ready to be purposed. The building and grounds in general are well maintained, with amenities such as laundry, live in super, and parking via waiting list. The neighborhood is quite pedestrian with eateries, retail, market, cleaners and so many other conveniences all along Broadway, including the 1 train and an array of bus options. Then of course there's the neighborhood Kingsbridge Little League baseball team which finds its home here further adding to the charm of the community.
Key facts
- Live in super
- Fully renovated
- Laundry
Tags
Property features AI
Exterior
- Parking: Parking lot (no carport)
- Utilities: Public sewer; Cable available; Electricity connected; Natural gas connected; Sewer connected; Trash collection (private); Water connected
- Home design: Stock cooperative
- Construction: Brick construction
- Exterior features: Brick construction; Not waterfront
Interior
- Kitchen: Oven; Range; Refrigerator; Stainless steel appliances
- Bedrooms: 5 total rooms (bedroom count not specified)
- Bathrooms: 1 full bathroom
- Heating & cooling: Baseboard heating; Wall/window AC units
- Interior features: Elevator; Galley-style kitchen; Natural woodwork; No pets allowed; Entry level is 1
Neighborhood map
What this means for you Summary
Snapshot
- This is a 2-bed/1.0-bath condo listed at $320k. Condition is rated good.
Deal economics
- At list price, monthly cash flow is $-395 ($-5k/yr) — negative.
- The deal already cash-flows at list — no discount required.
- Meets the 1% rule at list price ($4k rent vs $320k).
- Cap rate 4.8% vs local median 2.6% in New York — top-decile yield for the area; either an underpriced asset or a hidden risk that comps aren't pricing in. Stress-test before assuming the spread holds.
Location & tenants
- Location reads 75/100 on livability (#268 in NY, #4,188 nationally) — a middle-class / working-renter tenant base. Strengths: amenities A+, commute A+, health & safety A; Watch: crime F, cost of living F.
- Market conditions: Rents rising fast (+11.6%/yr); 345 active listings in the ZIP; 2 comparable units currently listed for rent nearby; 6,929 units permitted in Bronx County in 2024 (6,829 in 5+ unit buildings).
- At $3,753/mo this rent would consume 60% of the median local household income ($75k/yr) (locally 5586% of renters already pay >50% of income on rent) — very limited rent-growth headroom before tenants either downsize or default.
Forward outlook
- Local home prices are declining (-3.0%/yr); year-one equity from $2k of loan paydown is wiped out by about $10k of value loss. Plan a longer hold.
- Bronx County population projected at +21% by 2050 — long-run rental-demand tailwind backs the buy-and-hold thesis.
Negotiation context
- Only 14 days on market — expect competitive offers; lowballing is unlikely to land.
- 2 sale attempts with the ask held roughly flat each time — persistent listings suggest the price (not the market) is what's stuck; bring a comps-based counter.
Risks & watch-outs
- Watch-outs: HOA is 31% of rent.
- Climate carrying-cost: major wind risk, 27% chance of damaging wind over 30y; extreme-heat days projected 7→14/yr by 2055 (HVAC capex compounding) — expect insurance premiums to compound above CPI over the hold.
Questions for the listing agent
- What do current leases actually rent for vs. the listed asking? Can we see a recent rent roll and the last 12 months of T-12 income?
- Built in 1961 — when were the roof, HVAC, electrical panel, plumbing, and water heater last replaced?
- What does the HOA fee cover, when was the last increase, and are there any pending special assessments or reserve-fund shortfalls?
- Any open or pending special assessments — roof, HVAC, plumbing, elevator, façade? What's the per-unit balance and payoff schedule, and is the seller paying it off at close or rolling it to the buyer?
- Is there a deadline driving the sale (1031 exchange, divorce, estate, relocation)? That informs how much negotiation room exists.
- Schools are B-rated — typically a magnet for longer-tenancy family renters. What's the average tenant stay here, and is there a school-zone premium baked into asking?
- Crime grade is F in this area — have there been break-ins, vandalism, or insurance claims at this property in the last 3 years? What carrier currently insures it and at what premium?
- The area grade is low — what's the realistic commute time and amenity access for the typical tenant pool here? Any planned neighborhood developments (good or bad) we should know about?
- What's the average days-on-market for RENTAL listings here right now (not sales)? A rising rental-DOM trend means longer vacancies and softer asking-rent achievability than the comps imply.
- What's the recent tenant-quality profile in this submarket — average credit score on applications, eviction rate, late-payment / NSF rate, and stable-employment percentage? A property-management company in the area should have these aggregated.
- How much new apartment / multifamily construction is in the pipeline within 1–3 miles? Heavy new supply (>2% of stock underway) typically softens rents 12–24 months out; light construction supports rent growth.
Investment metrics
- 1% rule
- 1.17% ✓
- Cap rate
- 4.81%
- Cash-on-cash
- -5.28%
- DSCR
- 0.76
- GRM
- 7.1
CMA / ARV
No comps found within radius.
Projected returns pro-forma
-3.0% appreciation · 8.0% rent growth · sell at horizon
- IRR
- -16.6%
- Equity multiple
- 0.37×
- Total profit
- $-56,389
- Equity at exit
- $47,713
- IRR
- 1.4%
- Equity multiple
- 1.13×
- Total profit
- $11,905
- Equity at exit
- $27,668
Cash invested: $89,600 (down + closing). Projections, not guarantees.
Landlord ↔ Tenant lean methodology
- Overall (CITY)
- 0 Strongly Tenant-Friendly
- State New York
- 15 Strongly Tenant-Friendly · D+10
- County
- — inherits STATE
- City New York
- 0 Strongly Tenant-Friendly · D+34
ZIP-level market 10463
- Rents YoY
- 11.6%
- Active inventory
- 345
- Price-to-rent
- 7.1×
Monthly cashflow live
- Estimated rent
- $3,753 medium interval (Pro) →
- Mortgage (P&I)
- −$1,678
- Tax est. 1.5%
- −$400 /mo · $4,800/yr
- Insurance
- −$133
- HOA est. from 2 same-building comps
- −$1,148
- Vacancy / Maint / Mgmt
- −$788
- Net cashflow
- $-395
Break-even live
Sensitivity live
| Price | -10% $-173 | -5% $-284 | +0% $-395 | +5% $-505 | +10% $-616 |
|---|---|---|---|---|---|
| Rent | -10% $-691 | -5% $-543 | +0% $-395 | +5% $-246 | +10% $-98 |
| Rate | -1.0pp $-233 | -0.5pp $-313 | base $-395 | +0.5pp $-477 | +1.0pp $-562 |
UW: 25.0% down · 7.5% · 30yr · 1.5% tax · 5.0% vac · 8.0% maint · 8.0% mgmt
Financing live
Cash to close
- Down payment
- $80,000
- Closing costs
- $9,600
- Reserves months
- —
- Total cash needed
- —
Loan-product check · same deal, 3 products live
Conventional
25% down · 7.5% · 30yr
- Down + closing
- —
- Monthly P&I
- —
- Monthly cashflow
- —
- DSCR
- —
- Eligible?
- —
Personal DTI + credit; lowest rate.
DSCR
20% down · 8.5% · 30yr
- Down + closing
- —
- Monthly P&I
- —
- Monthly cashflow
- —
- DSCR
- —
- Eligible?
- —
No personal income docs; deal must DSCR.
Hard money
10% down · 12.0% · 12mo
- Down + closing
- —
- Monthly P&I
- —
- Monthly cashflow
- —
- DSCR
- —
- Eligible?
- —
Short-term bridge; refi at stabilization.
Rent comps 2 comps
| Address | Beds | Baths | Sqft | Rent | $/sqft | DOM | Units | Dist |
|---|---|---|---|---|---|---|---|---|
| 2600 Netherland Ave Bronx, NY | 1.0–3.0 | 1.0–2.5 | 1132 | $3,938 | $3.48 | 23d | 3 | 0.68mi |
| 405 W 206th St Unit 1202E New York, NY | 3.0 | 2.0 | 900 | $6,250 | $6.94 | 26d | 1 | 1.36mi |
HOA detail condo
- Monthly dues
- $0 · $0/yr
- Likely covers
- landscaping
- Assessments
- None detected in remarks — confirm with the listing agent.
Listing history 5 events
-
2026-06-02status $320,000 Pending 14 DOM
-
2026-06-01days on market $320,000 Active 14 DOM
-
2026-05-31days on market $320,000 Active 13 DOM
-
2026-05-22$320,000 Active 867-char remark
Show marketing remark (867 chars)
A Hidden Gem within the vibrant community of Kingsbridge, positioned right outside of Riverdale. This sophisticated fully renovated two bedroom offers both western and eastern light exposures, plank glossy hard wood floors, well equipped kitchen with brand new stainless steal appliances and well designed bathroom also with its own upgrades. The bedrooms are generously sized and ready to be purposed. The building and grounds in general are well maintained, with amenities such as laundry, live in super, and parking via waiting list. The neighborhood is quite pedestrian with eateries, retail, market, cleaners and so many other conveniences all along Broadway, including the 1 train and an array of bus options. Then of course there's the neighborhood Kingsbridge Little League baseball team which finds its home here further adding to the charm of the community.
-
2026-05-18$320,000 Active
ⓘ Source: listings_history table (triggers on properties + properties_extension) + one-shot
backfill from property_details.listing_events for pre-trigger history.
Climate risk First Street
- Flood 1/10 Low FEMA zone X (unshaded) · 0% chance over 30 yrs
- Wildfire 1/10 Low
- Heat 6/10 Major 7 d/yr ≥99°F today · 14 d/yr by 30 yrs out
- Wind 6/10 Major 27% chance of damaging wind over 30 yrs
- Air quality 3/10 Moderate 3 unhealthy d/yr today · 4 by 30 yrs out
Nearby sold comps map
Loading sold comps map…
Walkable amenities ~0.75 mi
Loading nearby amenities…
Taxation est. · year 1
- Rental income
- $45,036
- − Mortgage interest
- −$17,925
- − Property taxes
- −$4,800
- − Insurance
- −$1,600
- − Repairs & maintenance
- −$3,603
- − Management
- −$3,603
- − HOA
- −$13,776
- − Depreciation
- −$9,309
- Taxable loss
- −$9,580
- Est. tax savings @ 24.0%
- +$2,299
- After-tax cash flow
- $-2,436/yr
For passive investors: Depreciation is non-cash, so a rental often shows a tax loss while cash-flowing — sheltering income. Rental losses are passive: they offset passive income freely, and up to $25,000/yr can offset ordinary (W-2) income if you actively participate and your MAGI is under $100k (phasing out to $0 by $150k); unused losses carry forward. On sale, claimed depreciation is recaptured at up to 25%, and gains may owe capital-gains tax (a 1031 exchange can defer both). Figures are a year-1 estimate at your 24.0% rate — not tax advice; consult a CPA.
Condition & rehab AI · 13 photos
This fully renovated two-bedroom townhouse offers modern amenities and a well-maintained interior, making it a great investment opportunity.
Value-add opportunities
- Both Painting the exterior brick — Enhances curb appeal and can increase both resale and rental value
- Both Upgrading the kitchen cabinets — Modernizes the space and can increase both resale and rental value
- Both Adding smart home features — Improves convenience and can increase both resale and rental value
Renovation cost estimate screening
Value-add ROI direction
- Both Painting the exterior brick — Enhances curb appeal and can increase both resale and rental value ↑
- Both Upgrading the kitchen cabinets — Modernizes the space and can increase both resale and rental value ↑
- Both Adding smart home features — Improves convenience and can increase both resale and rental value ↑
ⓘ Cost ranges are severity-bucket heuristics (US national rule-of-thumb). Get contractor quotes + a written scope before underwriting a rehab budget.
Schools (NCES district)
No district data.
Livability — New York
- Score
- 75/100
- State rank
- #268
- US rank
- #4188
Category grades
Schools grade is shown separately in the Schools card above.
Census & demographics
- Census place
- New York, NY
- County
- Bronx County · 1,197,324 people
- City population
- 7,731,280
- Metro
- New York-Newark-Jersey City, NY-NJ-PA
- Population (ZIP)
- 69,470
- Household income
- $74,974
- Rent vs Own
- Severe rent burden
- 5586.0
Population outlook (Bronx County) Hauer SSP2
- Today (2025)
- 1,607,353 people
- By 2030
- 1,681,852 · +4.6%
- By 2040
- 1,824,421 · +13.5%
- By 2050
- 1,945,470 · +21.0%
- By 2075
- 2,187,887 · +36.1%
- By 2100
- 2,244,136 · +39.6%
Race, ethnicity, and origin ACS 2023
- Neighborhood character
- Diverse neighborhood (Simpson 0.65)
- Race & ethnicity
- Hispanic / Latino 50% White 30% Two or more races 17% Black 12% Asian 4% Native American 2%
- Hispanic origin (detail)
- Mexican 3% Puerto Rican 12% Cuban 1% Dominican 25%
- Common ancestry
- Scotch-Irish 3% Romanian 2% Lithuanian 1%
- Foreign-born
- 30% · Canada, Jamaica, China
- Languages at home
- 50% English-only · Spanish 40% Other Indo-European 3% Russian/Polish/Slavic 2%
Political lean MEDSL · Bronx
- 2024 margin
- Solid D (+45.4) · D 72.7% · R 27.3%
- 2008→2024 swing
- -32.3pp toward R · 2008: 77.8pp · 2024: 45.4pp
- All cycles
- 2024: D+45.4 2020: D+67.6 2016: D+79.1 2012: D+82.9 2008: D+77.8
Not yet ingested
- Civics
- —
Market trends
- HPI YoY
- ▼ -294.75%
- Current HPI
- 168.0211
- Rent YoY
- ▲ 11.60%
- Metro
- New York-Newark-Jersey City, NY-NJ-PA
- State GDP YoY
- ▲ 2.60%
- F500 in state
- 92
Industry mix (Fortune 500 HQ in NY)
| Industry | F500 HQs | Revenue |
|---|---|---|
| Financial Services | 10 | $950B |
|
||
| Consumer Goods | 9 | $162B |
|
||
| Insurance | 4 | $225B |
|
||
| Telecommunications | 2 | $144B |
|
||
| Pharmaceuticals | 2 | $112B |
|
||
| Media / Entertainment | 2 | $69B |
|
||
Price history
+0.0% since first listed2 events — show timeline
- 2026-05-22 Listed $320,000 RLS at REBNY
- 2026-05-18 Listed $320,000 OneKey® MLS as Distributed by MLS Grid
Cash-flow waterfall
monthlySold comps — $/sqft
last 12 mo · ≤1 miLoading sold comps…