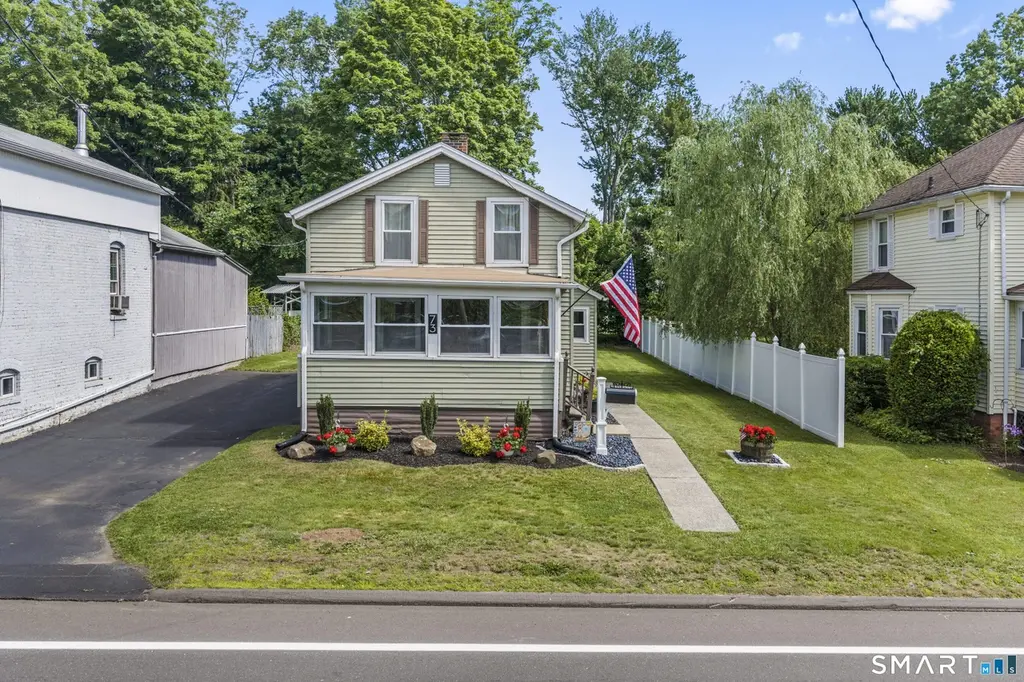
73 Main St · Berlin, CT
Flood risk 1/10 · Minimal
- FEMA flood zone
- X (unshaded)
- Chance of flooding over 30 yrs
- 0.0%
- Est. flood insurance / yr
- $473 – $860
Fire risk 1/10 · Minimal
- Est. fire insurance / yr
- $829 – $1,539
Heat risk 5/10 · Moderate
- Hot days now (above 98°F)
- 7 days/yr
- Hot days in 30 yrs
- 16 days/yr
Wind risk 6/10 · Moderate
- Chance of severe wind over 30 yrs
- 27.0%
Air-quality risk 3/10 · Minor
- Unhealthy air days now
- 3 days/yr
- Unhealthy air days in 30 yrs
- 4 days/yr
Risk factors via First Street. Map © Google.
Why this score? — see what drove the C grade
The composite is a weighted blend of 9 inputs, each scored 0–100. Each bar is that input's sub-score; the figure is the points it added to the 100-point composite (weight × sub-score).
- Cash flow +19.9/30.0
- ARV discount +15.0/15.0
- DSCR +6.3/10.0
- 1% rule +5.2/10.0
- Schools +4.8/10.0
- Rent growth +2.5/5.0
- Livability +2.5/5.0
- Condition / age +2.5/5.0
- Appreciation +0.0/10.0
$250,000
🖨 Deal sheet 📄 Offer letter ✓ Due diligence
Listing remarks
Charming Colonial located in the heart of Berlin offering 7 rooms, 3 bedrooms, and 1 full bath. This home is filled with character and presents an excellent opportunity for buyers looking to add their own personal touches while building equity. The main level features an enclosed front porch, living room, dining room, kitchen, and a flexible office space ideal for working from home or additional living area. Upstairs are three bedrooms and a full bath. Situated on a level . 18-acre lot with a spacious backyard, the property offers plenty of room for outdoor enjoyment and future improvements. Additional features include thermopane windows throughout, public water and sewer, paved driveway wi
Key facts
- Spacious backyard
- Paved driveway
- Thermopane windows
Tags
Property features AI
Exterior
- Parking: Driveway; 4 total parking spaces
- Utilities: Public water connected; Public sewer connected; Domestic hot water
- Home design: Single-family home; Frame construction; Green exterior
- Construction: Asphalt shingle roof; Aluminum siding; Brick and concrete foundation
- Exterior features: Enclosed porch and open porch; Sidewalk; Gutters; Exterior lighting; Lightly wooded, level lot; Paved driveway
Interior
- Kitchen: Oven/Range; Refrigerator
- Bedrooms: 3 bedrooms
- Bathrooms: 1 full bathroom
- Heating & cooling: Radiator heat (oil-fired); Fuel tank located in basement; Storm doors and thermopane windows for energy efficiency
- Interior features: Pre-wired for cable; Full unfinished basement with hatchway access
- Laundry & utility: Washer; Laundry areas on main level and lower level
Neighborhood map
What this means for you Summary
Snapshot
- This is a 3-bed/1.0-bath single-family listed at $250k.
Deal economics
- At list price, monthly cash flow is $303 ($4k/yr) — positive.
- The deal already cash-flows at list — no discount required.
- Meets the 1% rule at list price ($3k rent vs $250k).
Location & tenants
- Location reads: area grade C — affects rentability + tenant quality, not the cash-flow math above.
- Berlin School District (suburban): math 47% / reading 58% proficiency, ranked #69 of 153 in CT (top 45%) — acceptable for families but not a draw, mixed tenant base, ~2y average lease; only 10% free/reduced lunch — higher-income household profile.
- Zoned schools: Berlin High School (math 38% / reading 69%, grade C-, #78 of 194 statewide, top 40%, 858 students, 18% FRL).
- Market conditions: 63 active listings in the ZIP; 7 comparable units currently listed for rent nearby; rentals lingering (median 44d on market — plan ~5-8 weeks vacancy on turnover, expect pricing pressure); 71% of comp listings sitting > 30 days — soft ceiling on asking rent; high-income renter base; 1,867 units permitted in Capitol Planning Region in 2024 (1,399 in 5+ unit buildings).
Forward outlook
- Local home prices are declining (-3.0%/yr); year-one equity from $2k of loan paydown is wiped out by about $8k of value loss. Plan a longer hold.
Negotiation context
- Only 5 days on market — expect competitive offers; lowballing is unlikely to land.
Risks & watch-outs
- Watch-outs: built in 1895 — expect roof / HVAC / electrical / plumbing capex.
- Climate carrying-cost: major wind risk, 27% chance of damaging wind over 30y; extreme-heat days projected 7→16/yr by 2055 (HVAC capex compounding) — expect insurance premiums to compound above CPI over the hold.
Questions for the listing agent
- Built in 1895 — when were the roof, HVAC, electrical panel, plumbing, and water heater last replaced?
- Is there a deadline driving the sale (1031 exchange, divorce, estate, relocation)? That informs how much negotiation room exists.
- What's the average days-on-market for RENTAL listings here right now (not sales)? A rising rental-DOM trend means longer vacancies and softer asking-rent achievability than the comps imply.
- What's the recent tenant-quality profile in this submarket — average credit score on applications, eviction rate, late-payment / NSF rate, and stable-employment percentage? A property-management company in the area should have these aggregated.
- How much new for-sale + rental construction is in the pipeline within 1–3 miles? Heavy new supply typically softens prices + rents 12–24 months out; constrained supply supports both.
Investment metrics
- 1% rule
- 1.02% ✓
- Cap rate
- 7.75%
- Cash-on-cash
- 5.20%
- DSCR
- 1.23
- GRM
- 8.1
CMA / ARV
- ARV (on-the-fly)
- $338,181
- Comps found
- 12
Show comp detail 12 sales within ~0.75 mi
| Address | Dist | Beds/Ba | Sqft | Sold | Price | $/sf | Match |
|---|---|---|---|---|---|---|---|
| 26 York Rd | 0.44mi | 3/1.0 | 1,042 (-0%) | 7mo | $375,000 | $360 | 73 |
| 96 Homecrest Dr | 0.32mi | 2/1.0 (-1) | 1,062 (+1%) | 9mo | $350,000 | $330 | 70 |
| 34 York Rd | 0.43mi | 3/1.0 | 1,066 (+2%) | 10mo | $340,000 | $319 | 68 |
| 471 New Britain Rd | 0.54mi | 3/1.5 | 1,044 (-0%) | 10mo | $285,000 | $273 | 64 |
| 24 Williams St | 0.53mi | 3/1.0 | 1,102 (+5%) | 5mo | $265,000 | $240 | 63 |
| 14 Harris St | 0.26mi | 3/1.0 | 936 (-11%) | 11mo | $325,000 | $347 | 61 |
| 53 Boyer St | 0.18mi | 2/1.5 (-1) | 1,188 (+14%) | 5mo | $368,000 | $310 | 58 |
| 40 Garden Dr | 0.60mi | 3/1.0 | 1,000 (-4%) | 11mo | $340,000 | $340 | 56 |
| 108 Schultz Rd | 0.43mi | 3/2.0 | 1,144 (+9%) | 6mo | $290,000 | $253 | 55 |
| 117 Homecrest Dr | 0.28mi | 2/1.5 (-1) | 1,204 (+15%) | 5mo | $388,050 | $322 | 51 |
| 137 Grandview Ave | 0.74mi | 3/1.0 | 1,000 (-4%) | 8mo | $323,100 | $323 | 51 |
| 90 Homecrest Dr | 0.34mi | 2/1.0 (-1) | 912 (-13%) | 15mo | $315,000 | $345 | 46 |
Match score weights: distance 35% · size 25% · config 20% · recency 20%. Top-matched comps best support the ARV.
Projected returns pro-forma
-3.0% appreciation · 3.0% rent growth · sell at horizon
- IRR
- -8.2%
- Equity multiple
- 0.70×
- Total profit
- $-21,155
- Equity at exit
- $37,276
- IRR
- 1.3%
- Equity multiple
- 1.09×
- Total profit
- $6,590
- Equity at exit
- $21,615
Cash invested: $70,000 (down + closing). Projections, not guarantees.
Landlord ↔ Tenant lean methodology
- Overall (STATE)
- 27 Tenant-Leaning
- State Connecticut
- 27 Tenant-Leaning · D+7
- County
- — inherits STATE
- City
- — inherits STATE
ZIP-level market 06037
- Home prices YoY
- -32.9%
- Active inventory
- 63
- Price-to-rent
- 8.1×
Monthly cashflow live
- Estimated rent
- $2,556 high interval (Pro) →
- Mortgage (P&I)
- −$1,311
- Tax from tax record
- −$301 /mo · $3,611/yr
- Insurance
- −$104
- HOA
- −$0
- Vacancy / Maint / Mgmt
- −$537
- Net cashflow
- $303
Break-even live
UW: 25.0% down · 7.5% · 30yr · 1.5% tax · 5.0% vac · 8.0% maint · 8.0% mgmt
Financing live
Cash to close
- Down payment
- $62,500
- Closing costs
- $7,500
- Reserves months
- —
- Total cash needed
- —
Loan-product check · same deal, 3 products live
Conventional
25% down · 7.5% · 30yr
- Down + closing
- —
- Monthly P&I
- —
- Monthly cashflow
- —
- DSCR
- —
- Eligible?
- —
Personal DTI + credit; lowest rate.
DSCR
20% down · 8.5% · 30yr
- Down + closing
- —
- Monthly P&I
- —
- Monthly cashflow
- —
- DSCR
- —
- Eligible?
- —
No personal income docs; deal must DSCR.
Hard money
10% down · 12.0% · 12mo
- Down + closing
- —
- Monthly P&I
- —
- Monthly cashflow
- —
- DSCR
- —
- Eligible?
- —
Short-term bridge; refi at stabilization.
Rent comps 7 comps
| Address | Beds | Baths | Sqft | Rent | $/sqft | DOM | Units | Dist |
|---|---|---|---|---|---|---|---|---|
| 20 Condon St Berlin, CT | 3.0 | 1.0 | 1173 | $2,950 | $2.51 | 19d | 1 | 0.82mi |
| 20 Condon St Berlin, CT | 3.0 | 1.0 | 1173 | $2,950 | $2.51 | 1d | 1 | 0.82mi |
| 1044 Farmington Ave Berlin, CT | 2.0 | 1.0 | 978 | $2,150 | $2.20 | 44d | 1 | 0.86mi |
| 265 Lincoln St Unit B Kensington, CT | 2.0 | 1.0 | 850 | $2,650 | $3.12 | 44d | 1 | 1.10mi |
| 131 Clinic Dr Apt 309 New Britain, CT | 2.0 | 1.0 | 850 | $1,600 | $1.88 | 44d | 1 | 1.22mi |
| 123 Clinic Dr Apt 101 New Britain, CT | 2.0 | 1.0 | 825 | $1,600 | $1.94 | 44d | 1 | 1.24mi |
| 123 Clinic Dr New Britain, CT | 2.0 | 1.0 | 850 | $1,700 | $2.00 | 44d | 1 | 1.24mi |
Listing history 7 events
-
2026-06-18status $250,000 Active 5 DOM
-
2026-06-10status $250,000 Under Contract 5 DOM
-
2026-06-09days on market $250,000 Active 5 DOM
-
2026-06-08days on market $250,000 Active 4 DOM
-
2026-06-07days on market $250,000 Active 3 DOM
-
2026-06-05remarks 699-char remark
-
2026-06-05$250,000 Active 1 DOM
ⓘ Source: listings_history table (triggers on properties + properties_extension) + one-shot
backfill from property_details.listing_events for pre-trigger history.
Tax reassessment forecast CT · Partial reset (capped growth)
- Current annual tax
- $3,611 · $301/mo
- Projected year-2 tax
- $4,480 · $373/mo
- Expected delta
- +$870/yr (+$72/mo · 24.1%)
ⓘ Screening estimate from a state-policy table — verify with the county assessor before closing.
Climate risk First Street
- Flood 1/10 Low FEMA zone X (unshaded) · 0% chance over 30 yrs
- Wildfire 1/10 Low
- Heat 5/10 Major 7 d/yr ≥98°F today · 16 d/yr by 30 yrs out
- Wind 6/10 Major 27% chance of damaging wind over 30 yrs
- Air quality 3/10 Moderate 3 unhealthy d/yr today · 4 by 30 yrs out
Nearby sold comps map
Loading sold comps map…
Walkable amenities ~0.75 mi
Loading nearby amenities…
Taxation est. · year 1
- Rental income
- $30,676
- − Mortgage interest
- −$14,004
- − Property taxes
- −$3,611
- − Insurance
- −$1,250
- − Repairs & maintenance
- −$2,454
- − Management
- −$2,454
- − Depreciation
- −$7,273
- Taxable loss
- −$370
- Est. tax savings @ 24.0%
- +$89
- After-tax cash flow
- $3,730/yr
For passive investors: Depreciation is non-cash, so a rental often shows a tax loss while cash-flowing — sheltering income. Rental losses are passive: they offset passive income freely, and up to $25,000/yr can offset ordinary (W-2) income if you actively participate and your MAGI is under $100k (phasing out to $0 by $150k); unused losses carry forward. On sale, claimed depreciation is recaptured at up to 25%, and gains may owe capital-gains tax (a 1031 exchange can defer both). Figures are a year-1 estimate at your 24.0% rate — not tax advice; consult a CPA.
Schools (NCES district)
- District
- Berlin School District
- NCES district ID
- 0900210
- Math proficiency
- 47% ▼ -12.00%
- Reading proficiency
- 58% ▼ -8.00%
- Median HH income
- $87,497
- Composite
- 48.4/100
- National rank
- #2136
- State rank
- #69 of 153 in CT
Livability — Berlin
No livability data for this city. (Only ~50 U.S. cities are tracked.)
Census & demographics
- Census place
- Kensington, CT
- County
- Hartford County · 754,208 people
- City population
- 19,173
- Metro
- Hartford-East Hartford-Middletown, CT
- Population (ZIP)
- 19,173
- Household income
- $116,042
- Rent vs Own
- Severe rent burden
- 294.0
Population outlook (Capitol County) Hauer SSP2
- By 2040
- 1,063,519
Race, ethnicity, and origin ACS 2023
- Neighborhood character
- Predominantly White (86%)
- Race & ethnicity
- White 86% Hispanic / Latino 7% Two or more races 5% Asian 5%
- Hispanic origin (detail)
- Puerto Rican 2% Cuban 2%
- Common ancestry
- Romanian 23% Lithuanian 8% Danish 2%
- Foreign-born
- 10% · Canada, China
- Languages at home
- 85% English-only · Russian/Polish/Slavic 6% Spanish 3% Other Indo-European 2%
Political lean MEDSL · Capitol
- 2024 margin
- Strong D (+21.9) · D 60.1% · R 38.2% · Other 1.7%
- All cycles
- 2024: D+21.9
Not yet ingested
- Civics
- —
Market trends
- HPI YoY
- ▼ -145.47%
- Current HPI
- 296.2808
- Rent YoY
- —
- Metro
- Hartford-East Hartford-Middletown, CT
- State GDP YoY
- ▲ 1.06%
- F500 in state
- 38
Industry mix (Fortune 500 HQ in CT)
| Industry | F500 HQs | Revenue |
|---|---|---|
| Industrial Machinery | 4 | $38B |
|
||
| Insurance | 3 | $71B |
|
||
| Financial Services | 2 | $25B |
|
||
| Transportation / Logistics | 2 | $18B |
|
||
| Healthcare | 1 | $247B |
|
||
| Telecommunications | 1 | $55B |
|
||
Price history
1 event — show timeline
- 2026-06-03 Listed $250,000 Smart MLS
Property tax history
+1.6%/yrLatest (2025): $3,611 · +1.5% YoY. Source: county tax records.
Cash-flow waterfall
monthlySold comps — $/sqft
last 12 mo · ≤1 miLoading sold comps…