5014 Wild Bergamot Ct · Pleak, TX
Flood risk 1/10 · Minimal
- FEMA flood zone
- X (unshaded)
- Chance of flooding over 30 yrs
- 0.0%
- Est. flood insurance / yr
- $507 – $1,088
Fire risk 2/10 · Minimal
- Est. fire insurance / yr
- $1,222 – $2,270
Heat risk 9/10 · Severe
- Hot days now (above 110°F)
- 7 days/yr
- Hot days in 30 yrs
- 23 days/yr
Wind risk 9/10 · Severe
- Chance of severe wind over 30 yrs
- 99.0%
Air-quality risk 2/10 · Minimal
- Unhealthy air days now
- 1 days/yr
- Unhealthy air days in 30 yrs
- 1 days/yr
Risk factors via First Street. Map © Google.
Why this score? — see what drove the C grade
The composite is a weighted blend of 9 inputs, each scored 0–100. Each bar is that input's sub-score; the figure is the points it added to the 100-point composite (weight × sub-score).
- Cash flow +18.0/30.0
- ARV discount +15.0/15.0
- 1% rule +6.0/10.0
- DSCR +5.6/10.0
- Schools +4.8/10.0
- Condition / age +4.8/5.0
- Livability +2.9/5.0
- Rent growth +2.5/5.0
- Appreciation +0.0/10.0
$200,090
🖨 Deal sheet 📄 Offer letter ✓ Due diligence
Listing remarks MLS
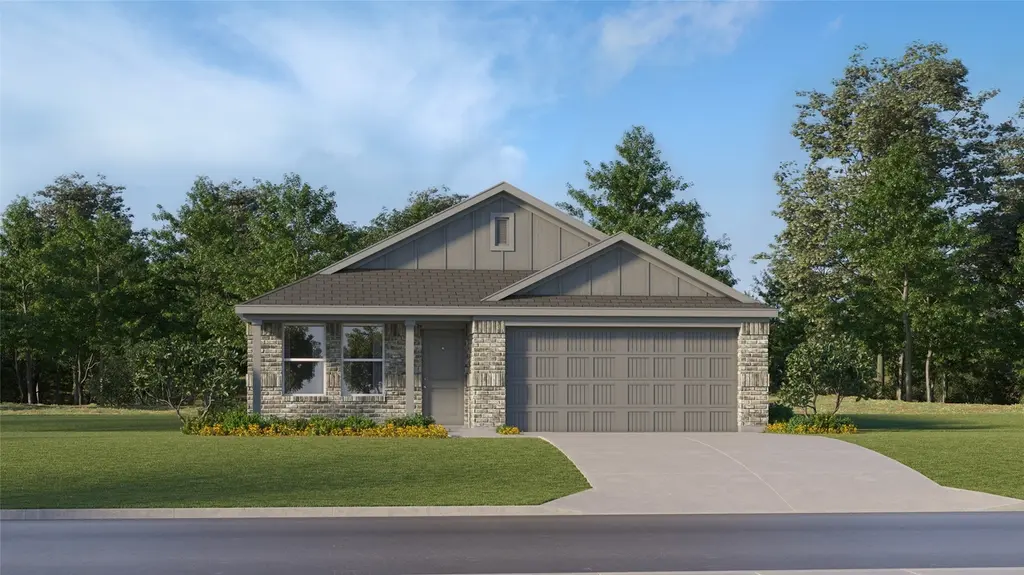
The Beckman Floor Plan - This new home is conveniently laid out on a single floor for maximum comfort and convenience. At its heart stands an open-concept layout connecting a spacious family room, a multi-functional kitchen and lovely dining area. The owner’s suite is situated in a private corner and comes complete with an adjoining bathroom, while the two secondary bedrooms are located near the foyer. The completion date, prices and features may vary and are subject to change. Please verify with Lennar directly. Photos are for illustrative purposes only.
Key facts
- Adjoining bathroom
- Private corner
- Owner's suite
Tags
Neighborhood map
What this means for you Summary
Snapshot
- This is a 3-bed/2.0-bath single-family listed at $200k. Condition is rated excellent.
Deal economics
- At list price, monthly cash flow is $172 ($2k/yr) — positive.
- The deal already cash-flows at list — no discount required.
- Meets the 1% rule at list price ($2k rent vs $200k).
- Recommended offer: $194k (3.0% below list) — sets the bar for market timing.
- Cap rate 7.3% vs local median 3.8% in Pleak — top-decile yield for the area; either an underpriced asset or a hidden risk that comps aren't pricing in. Stress-test before assuming the spread holds.
Location & tenants
- Location reads 58/100 on livability (#1,221 in TX) — a working-class tenant base; expect higher turnover. Strengths: crime A+, housing A+, cost of living A; Watch: employment C-, schools F, amenities F.
- Needville ISD (rural): math 55% / reading 55% proficiency, ranked #95 of 826 in TX (top 12%) — acceptable for families but not a draw, mixed tenant base, ~2y average lease.
- Market conditions: 337 active listings in the ZIP; 1 comparable units currently listed for rent nearby; 12,093 units permitted in Fort Bend County in 2024 (815 in 5+ unit buildings).
Forward outlook
- Local home prices are declining (-3.0%/yr); year-one equity from $1k of loan paydown is wiped out by about $6k of value loss. Plan a longer hold.
- Fort Bend County population projected at +75% by 2050 — long-run rental-demand tailwind backs the buy-and-hold thesis.
Negotiation context
- It's been on market 53 days — a 3% lower offer ($194k) is reasonable based on typical stale-listing flexibility.
- 2 sale attempts; this cycle's ask has dropped $16k (7%) from the opening price — seller is motivated, your offer sets the floor, not the list.
Risks & watch-outs
- Climate carrying-cost: severe wind risk, 99% chance of damaging wind over 30y; extreme-heat days projected 7→23/yr by 2055 (HVAC capex compounding) — expect insurance premiums to compound above CPI over the hold.
Questions for the listing agent
- It's been on market 53 days. Have you received any prior offers? Is the seller open to a 3% concession, seller financing, or rate buy-down credit?
- What does the HOA fee cover, when was the last increase, and are there any pending special assessments or reserve-fund shortfalls?
- Is there a deadline driving the sale (1031 exchange, divorce, estate, relocation)? That informs how much negotiation room exists.
- Schools are F-rated, which usually means shorter tenancies and higher turnover. Who's the typical renter profile here, and what's been the actual vacancy rate?
- What's the average days-on-market for RENTAL listings here right now (not sales)? A rising rental-DOM trend means longer vacancies and softer asking-rent achievability than the comps imply.
- What's the recent tenant-quality profile in this submarket — average credit score on applications, eviction rate, late-payment / NSF rate, and stable-employment percentage? A property-management company in the area should have these aggregated.
- How much new for-sale + rental construction is in the pipeline within 1–3 miles? Heavy new supply typically softens prices + rents 12–24 months out; constrained supply supports both.
Investment metrics
- 1% rule
- 1.10% ✓
- Cap rate
- 7.33%
- Cash-on-cash
- 3.69%
- DSCR
- 1.16
- GRM
- 7.6
CMA / ARV
- ARV (median comp)
- $246,490
- List price
- $200,090
- Delta
- -18.82%
- Verdict
- UNDERPRICED
- Comps
- 20 within 1.0 mi
Show comp detail 12 sales within ~0.75 mi
| Address | Dist | Beds/Ba | Sqft | Sold | Price | $/sf | Match |
|---|---|---|---|---|---|---|---|
| 5014 Wild Bergamot Ct | 0.00mi | 3/2.0 | 1,302 (0%) | 1mo | $200,090 | $154 | 99 |
| 5006 Wild Bergamot Ct | 0.03mi | 3/2.0 | 1,302 (0%) | 1mo | $209,090 | $161 | 98 |
| 5026 Palamedes Swallowtail Ln | 0.06mi | 3/2.0 | 1,311 (+1%) | 1mo | $192,991 | $147 | 95 |
| 5030 Palamedes Swallowtail Ln | 0.06mi | 3/2.0 | 1,451 (+11%) | 1mo | $236,790 | $163 | 77 |
| 5022 Palamedes Swallowtail Ln | 0.07mi | 3/2.0 | 1,451 (+11%) | 2mo | $279,990 | $193 | 76 |
| 5039 Palamedes Swallowtail Ln | 0.09mi | 3/2.0 | 1,461 (+12%) | 2mo | $223,040 | $153 | 74 |
| 7603 Barcelona Spgs | 0.53mi | 3/2.0 | 1,266 (-3%) | 2mo | $252,990 | $200 | 69 |
| 7514 Barcelona Spgs | 0.56mi | 3/2.0 | 1,266 (-3%) | 2mo | $256,990 | $203 | 68 |
| 5031 Palamedes Swallowtail Ln | 0.08mi | 4/2.5 (+1) | 1,461 (+12%) | 2mo | $281,990 | $193 | 67 |
| 7511 Barcelona Spgs | 0.51mi | 3/2.0 | 1,411 (+8%) | 1mo | $206,991 | $147 | 62 |
| 7519 Barcelona Spgs | 0.52mi | 3/2.0 | 1,402 (+8%) | 2mo | $259,990 | $185 | 61 |
| 7510 Barcelona Spgs | 0.57mi | 3/2.0 | 1,402 (+8%) | 1mo | $203,990 | $145 | 60 |
Match score weights: distance 35% · size 25% · config 20% · recency 20%. Top-matched comps best support the ARV.
Projected returns pro-forma
-3.0% appreciation · 3.0% rent growth · sell at horizon
- IRR
- -10.4%
- Equity multiple
- 0.62×
- Total profit
- $-21,309
- Equity at exit
- $29,834
- IRR
- -1.0%
- Equity multiple
- 0.93×
- Total profit
- $-3,839
- Equity at exit
- $17,300
Cash invested: $56,025 (down + closing). Projections, not guarantees.
Landlord ↔ Tenant lean methodology
- Overall (STATE)
- 87 Strongly Landlord-Friendly
- State Texas
- 87 Strongly Landlord-Friendly · R+5
- County
- — inherits STATE
- City
- — inherits STATE
ZIP-level market 77461
- Home prices YoY
- -22.9%
- Active inventory
- 337
- Price-to-rent
- 7.6×
Monthly cashflow live
- Estimated rent
- $2,200 medium interval (Pro) →
- Mortgage (P&I)
- −$1,049
- Tax est. 1.5%
- −$250 /mo · $3,001/yr
- Insurance
- −$83
- HOA
- −$183
- Vacancy / Maint / Mgmt
- −$462
- Net cashflow
- $172
Break-even live
UW: 25.0% down · 7.5% · 30yr · 1.5% tax · 5.0% vac · 8.0% maint · 8.0% mgmt
Financing live
Cash to close
- Down payment
- $50,022
- Closing costs
- $6,003
- Reserves months
- —
- Total cash needed
- —
Loan-product check · same deal, 3 products live
Conventional
25% down · 7.5% · 30yr
- Down + closing
- —
- Monthly P&I
- —
- Monthly cashflow
- —
- DSCR
- —
- Eligible?
- —
Personal DTI + credit; lowest rate.
DSCR
20% down · 8.5% · 30yr
- Down + closing
- —
- Monthly P&I
- —
- Monthly cashflow
- —
- DSCR
- —
- Eligible?
- —
No personal income docs; deal must DSCR.
Hard money
10% down · 12.0% · 12mo
- Down + closing
- —
- Monthly P&I
- —
- Monthly cashflow
- —
- DSCR
- —
- Eligible?
- —
Short-term bridge; refi at stabilization.
Rent comps 1 comps
| Address | Beds | Baths | Sqft | Rent | $/sqft | DOM | Units | Dist |
|---|---|---|---|---|---|---|---|---|
| 4707 Pine Meadow Dr Richmond, TX | 3.0 | 2.0 | 1594 | $2,200 | $1.38 | 2d | 1 | 0.44mi |
HOA detail
- Monthly dues
- $183 · $2,196/yr
Listing history 11 events
-
2026-04-09price $200,090 567-char remark
Show marketing remark (567 chars)
The Beckman Floor Plan - This new home is conveniently laid out on a single floor for maximum comfort and convenience. At its heart stands an open-concept layout connecting a spacious family room, a multi-functional kitchen and lovely dining area. The owner’s suite is situated in a private corner and comes complete with an adjoining bathroom, while the two secondary bedrooms are located near the foyer. The completion date, prices and features may vary and are subject to change. Please verify with Lennar directly. Photos are for illustrative purposes only.
-
2026-04-06price $207,990 567-char remark
Show marketing remark (567 chars)
The Beckman Floor Plan - This new home is conveniently laid out on a single floor for maximum comfort and convenience. At its heart stands an open-concept layout connecting a spacious family room, a multi-functional kitchen and lovely dining area. The owner’s suite is situated in a private corner and comes complete with an adjoining bathroom, while the two secondary bedrooms are located near the foyer. The completion date, prices and features may vary and are subject to change. Please verify with Lennar directly. Photos are for illustrative purposes only.
-
2026-04-03$215,890 Active 567-char remark
Show marketing remark (567 chars)
The Beckman Floor Plan - This new home is conveniently laid out on a single floor for maximum comfort and convenience. At its heart stands an open-concept layout connecting a spacious family room, a multi-functional kitchen and lovely dining area. The owner’s suite is situated in a private corner and comes complete with an adjoining bathroom, while the two secondary bedrooms are located near the foyer. The completion date, prices and features may vary and are subject to change. Please verify with Lennar directly. Photos are for illustrative purposes only.
-
2026-04-03historical
Show marketing remark (567 chars)
The Beckman Floor Plan - This new home is conveniently laid out on a single floor for maximum comfort and convenience. At its heart stands an open-concept layout connecting a spacious family room, a multi-functional kitchen and lovely dining area. The owner’s suite is situated in a private corner and comes complete with an adjoining bathroom, while the two secondary bedrooms are located near the foyer. The completion date, prices and features may vary and are subject to change. Please verify with Lennar directly. Photos are for illustrative purposes only.
-
2026-04-02price $215,890
-
2026-03-27price $224,040
-
2026-03-19price $232,390
-
2026-03-16price $236,790
-
2026-03-13price $245,540
-
2026-03-06price $249,990
-
2026-03-05$280,990 Active
ⓘ Source: listings_history table (triggers on properties + properties_extension) + one-shot
backfill from property_details.listing_events for pre-trigger history.
Climate risk First Street
- Flood 1/10 Low FEMA zone X (unshaded) · 0% chance over 30 yrs
- Wildfire 2/10 Low
- Heat 9/10 Extreme 7 d/yr ≥110°F today · 23 d/yr by 30 yrs out
- Wind 9/10 Extreme 99% chance of damaging wind over 30 yrs
- Air quality 2/10 Low 1 unhealthy d/yr today · 1 by 30 yrs out
Nearby sold comps map
Loading sold comps map…
Walkable amenities ~0.75 mi
Loading nearby amenities…
Taxation est. · year 1
- Rental income
- $26,400
- − Mortgage interest
- −$11,208
- − Property taxes
- −$3,001
- − Insurance
- −$1,000
- − Repairs & maintenance
- −$2,112
- − Management
- −$2,112
- − HOA
- −$2,196
- − Depreciation
- −$5,821
- Taxable loss
- −$1,051
- Est. tax savings @ 24.0%
- +$252
- After-tax cash flow
- $2,319/yr
For passive investors: Depreciation is non-cash, so a rental often shows a tax loss while cash-flowing — sheltering income. Rental losses are passive: they offset passive income freely, and up to $25,000/yr can offset ordinary (W-2) income if you actively participate and your MAGI is under $100k (phasing out to $0 by $150k); unused losses carry forward. On sale, claimed depreciation is recaptured at up to 25%, and gains may owe capital-gains tax (a 1031 exchange can defer both). Figures are a year-1 estimate at your 24.0% rate — not tax advice; consult a CPA.
Condition & rehab AI · 1 photo
This single-family home is in excellent condition with no visible repairs or maintenance needed. It is move-in ready and would benefit from a fresh coat of paint and some landscaping to further enhance its curb appeal.
Value-add opportunities
- Both Painting — Fresh paint can enhance curb appeal and interior aesthetics
- Both Landscaping — Enhances curb appeal and can increase property value
- Both Interior cleaning — A clean interior can make the home more appealing to potential buyers or renters
Renovation cost estimate screening
Value-add ROI direction
- Both Painting — Fresh paint can enhance curb appeal and interior aesthetics ↑
- Both Landscaping — Enhances curb appeal and can increase property value ↑
- Both Interior cleaning — A clean interior can make the home more appealing to potential buyers or renters ↑
ⓘ Cost ranges are severity-bucket heuristics (US national rule-of-thumb). Get contractor quotes + a written scope before underwriting a rehab budget.
Schools (NCES district)
- District
- Needville ISD
- NCES district ID
- 4832310
- Math proficiency
- 55% ▲ 1.00%
- Reading proficiency
- 55% ▬ 0.00%
- Median HH income
- $62,900
- Composite
- 48.17/100
- National rank
- #2176
- State rank
- #95 of 826 in TX
Livability — Pleak
- Score
- 58/100
- State rank
- #1221
- US rank
- #21321
Category grades
Schools grade is shown separately in the Schools card above.
Census & demographics
- Population (ZIP)
- 12,397
Population outlook (Fort Bend County) Hauer SSP2
- Today (2025)
- 1,004,526 people
- By 2030
- 1,153,104 · +14.8%
- By 2040
- 1,453,718 · +44.7%
- By 2050
- 1,753,781 · +74.6%
- By 2075
- 2,455,772 · +144.5%
- By 2100
- 2,930,528 · +191.7%
Race, ethnicity, and origin ACS 2023
- Neighborhood character
- Majority White (50%)
- Race & ethnicity
- White 50% Hispanic / Latino 45% Two or more races 18% Black 2% Native American 1%
- Hispanic origin (detail)
- Mexican 42%
- Common ancestry
- Lithuanian 2% Slovak 1% Portuguese 1%
- Foreign-born
- 15% · Canada, China
- Languages at home
- 69% English-only · Spanish 28% German/W. Germanic 2%
Political lean MEDSL · Fort Bend
- 2024 margin
- Toss-up / Even · D 49.5% · R 47.9% · Other 2.6%
- 2008→2024 swing
- +4.0pp toward D · 2008: -2.4pp · 2024: 1.6pp
- All cycles
- 2024: D+1.6 2020: D+10.6 2016: D+6.6 2012: R+6.8 2008: R+2.4
Not yet ingested
- Civics
- —
Market trends
- HPI YoY
- ▼ -96.17%
- Current HPI
- 324.3807
- Rent YoY
- —
- Metro
- —
- State GDP YoY
- ▲ 3.95%
- F500 in state
- 110
Industry mix (Fortune 500 HQ in TX)
| Industry | F500 HQs | Revenue |
|---|---|---|
| Energy | 16 | $1,198B |
|
||
| Technology | 5 | $198B |
|
||
| Engineering / Construction | 4 | $72B |
|
||
| Energy Services | 3 | $60B |
|
||
| Utilities | 3 | $41B |
|
||
| Healthcare | 2 | $330B |
|
||
Price history
-28.8% since first listed11 events — show timeline
- 2026-04-09 Price Changed $200,090 HARMLS
- 2026-04-06 Price Changed $207,990 HARMLS
- 2026-04-03 Listing Removed — HARMLS
- 2026-04-03 Listed $215,890 HARMLS
- 2026-04-02 Price Changed $215,890 HARMLS
- 2026-03-27 Price Changed $224,040 HARMLS
- 2026-03-19 Price Changed $232,390 HARMLS
- 2026-03-16 Price Changed $236,790 HARMLS
- 2026-03-13 Price Changed $245,540 HARMLS
- 2026-03-06 Price Changed $249,990 HARMLS
- 2026-03-05 Listed $280,990 HARMLS
Cash-flow waterfall
monthlySold comps — $/sqft
last 12 mo · ≤1 miLoading sold comps…