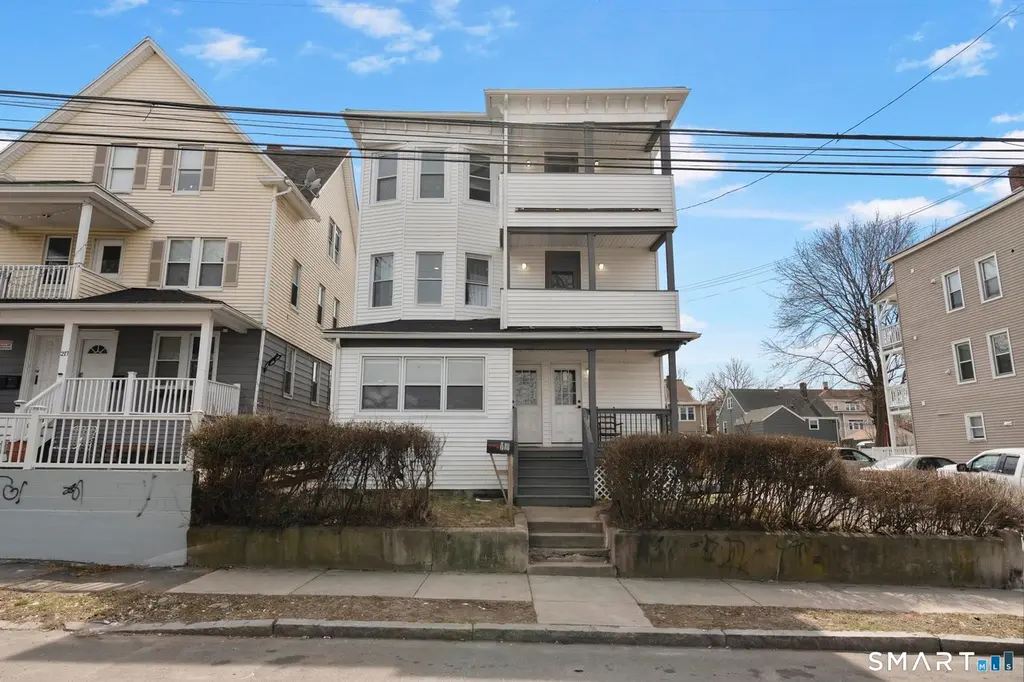
 Triplex
219 Orland St · Bridgeport, CT
Flood risk 1/10 · Minimal
- FEMA flood zone
- X (unshaded)
- Chance of flooding over 30 yrs
- 0.0%
- Est. flood insurance / yr
- $473 – $860
Fire risk 1/10 · Minimal
- Est. fire insurance / yr
- $829 – $1,539
Heat risk 6/10 · Moderate
- Hot days now (above 97°F)
- 7 days/yr
- Hot days in 30 yrs
- 15 days/yr
Wind risk 6/10 · Moderate
- Chance of severe wind over 30 yrs
- 65.0%
Air-quality risk 4/10 · Minor
- Unhealthy air days now
- 5 days/yr
- Unhealthy air days in 30 yrs
- 7 days/yr
Risk factors via First Street. Map © Google.
Why this score? — see what drove the F grade
The composite is a weighted blend of 9 inputs, each scored 0–100. Each bar is that input's sub-score; the figure is the points it added to the 100-point composite (weight × sub-score).
- Cash flow +15.4/30.0
- DSCR +4.7/10.0
- Livability +4.0/5.0
- 1% rule +3.5/10.0
- Rent growth +3.0/5.0
- Condition / age +2.5/5.0
- Schools +1.2/10.0
- ARV discount +0.0/15.0
- Appreciation +0.0/10.0
$869,900
🖨 Deal sheet 📄 Offer letter ✓ Due diligence
Multi-family units
County records classify this as Multi-Family (2-4 Unit). Listing-text estimate: 3 units. confirmed
Listing remarks
Exceptional opportunity to own a well-maintained 3-family home in the highly sought-after Black Rock section of Bridgeport. Situated on a rare double lot, this property offers abundant outdoor space along with ample off-street parking-an uncommon and valuable feature in the area. Roof, siding, windows and all 3 high efficiency Navien boilers were replaced 2 years ago. All apartments were recently renovated to include granite counter tops, tiled bathrooms, and new flooring. Each unit offers comfortable living spaces, with an open concept and a private balcony. The home is fully rented with long-term tenants on flexible month-to-month leases. Making this an ideal turnkey investment or an exce
Key facts
- 8,276 sq ft lot
- Built 1917
- Listed 5 days
Neighborhood map
What this means for you Summary
Snapshot
- This is a 3 × 3-bed/1.0-bath units multifamily listed at $870k.
Deal economics
- At list price, monthly cash flow is $333 ($4k/yr) — positive. Per door: $111/mo.
- The deal already cash-flows at list — no discount required.
- To meet the 1% rule (rent ≥ 1% of price), the offer needs to be $737k (15.3% below list).
- Recommended offer: $737k (15.3% below list) — sets the bar for 1% rule.
- Cap rate 6.8% vs local median 5.0% in Bridgeport — top-decile yield for the area; either an underpriced asset or a hidden risk that comps aren't pricing in. Stress-test before assuming the spread holds.
Location & tenants
- Location reads 81/100 on livability (#15 in CT, #1,374 nationally) — a professional / high-income tenant draw. Strengths: amenities A+, commute A+, health & safety A+; Watch: crime C-, employment D+, schools D-.
- Bridgeport School District (urban): math 9% / reading 19% proficiency, ranked #151 of 153 in CT (top 99%) — low school quality limits family demand, transient renter base, plan for 1-2y turnover; 97% free/reduced lunch — lower-income household profile, screen leases tightly.
- Market conditions: Rents rising (+1.8%/yr); 47 active listings in the ZIP; 5 comparable units currently listed for rent nearby; rentals at typical pace (median 24d on market — plan ~3-4 weeks tenant-placement turnaround); 40% of comp listings sitting > 30 days — soft ceiling on asking rent; 852 units permitted in Greater Bridgeport Planning Region in 2024 (698 in 5+ unit buildings).
- At $7,370/mo this rent would consume 157% of the median local household income ($56k/yr) (locally 2367% of renters already pay >50% of income on rent) — very limited rent-growth headroom before tenants either downsize or default.
Forward outlook
- Local home prices are declining (-3.0%/yr); year-one equity from $6k of loan paydown is wiped out by about $26k of value loss. Plan a longer hold.
Negotiation context
- Only 5 days on market — expect competitive offers; lowballing is unlikely to land.
Risks & watch-outs
- Watch-outs: built in 1917 — expect roof / HVAC / electrical / plumbing capex.
- Climate carrying-cost: major wind risk, 65% chance of damaging wind over 30y; extreme-heat days projected 7→15/yr by 2055 (HVAC capex compounding) — expect insurance premiums to compound above CPI over the hold.
Questions for the listing agent
- Can we see the unit-by-unit rent roll, current vacancy, and any below-market leases? What's the average tenancy length?
- What capital expenditures (roof, boiler, parking lot, exteriors) have been made in the last 5 years, and what's planned in the next 2?
- Built in 1917 — when were the roof, HVAC, electrical panel, plumbing, and water heater last replaced?
- Is there a deadline driving the sale (1031 exchange, divorce, estate, relocation)? That informs how much negotiation room exists.
- Schools are D-rated, which usually means shorter tenancies and higher turnover. Who's the typical renter profile here, and what's been the actual vacancy rate?
- The area grade is low — what's the realistic commute time and amenity access for the typical tenant pool here? Any planned neighborhood developments (good or bad) we should know about?
- What's the average days-on-market for RENTAL listings here right now (not sales)? A rising rental-DOM trend means longer vacancies and softer asking-rent achievability than the comps imply.
- What's the recent tenant-quality profile in this submarket — average credit score on applications, eviction rate, late-payment / NSF rate, and stable-employment percentage? A property-management company in the area should have these aggregated.
- How much new apartment / multifamily construction is in the pipeline within 1–3 miles? Heavy new supply (>2% of stock underway) typically softens rents 12–24 months out; light construction supports rent growth.
Investment metrics
- 1% rule
- 0.85% ✗
- Cap rate
- 6.75%
- Cash-on-cash
- 1.64%
- DSCR
- 1.07
- GRM
- 9.8
CMA / ARV
- ARV (on-the-fly)
- $622,386
- Comps found
- 12
Show comp detail 12 sales within ~0.75 mi
| Address | Dist | Beds/Ba | Sqft | Sold | Price | $/sf | Match |
|---|---|---|---|---|---|---|---|
| 105 Scofield Ave | 0.30mi | 6/3.0 | 3,050 (+4%) | 7mo | $650,000 | $213 | 73 |
| 40-42 Hansen Ave | 0.12mi | 6/3.0 | 2,559 (-12%) | 11mo | $620,000 | $242 | 64 |
| 102 Hansen Ave | 0.07mi | 6/2.0 | 2,511 (-14%) | 9mo | $390,000 | $155 | 61 |
| 220 King St | 0.33mi | 6/3.0 | 3,189 (+9%) | 14mo | $801,000 | $251 | 58 |
| 344 Ellsworth St | 0.43mi | 5/2.0 (-1) | 3,001 (+3%) | 13mo | $568,500 | $189 | 56 |
| 324 Mountain Grove St | 0.58mi | 6/3.0 | 2,769 (-5%) | 10mo | $540,000 | $195 | 56 |
| 22 Monroe St | 0.38mi | 5/3.0 (-1) | 3,293 (+13%) | 2mo | $685,000 | $208 | 54 |
| 766 Hancock Ave | 0.71mi | 6/4.0 | 2,906 (-0%) | 10mo | $467,000 | $161 | 54 |
| 652-664 Black Rock Tpke | 0.69mi | 5/4.0 (-1) | 2,816 (-4%) | 3mo | $810,000 | $288 | 50 |
| 105 Fox St | 0.68mi | 6/3.0 | 3,258 (+12%) | 5mo | $665,000 | $204 | 45 |
| 450 Davidson St | 0.74mi | 6/6.0 | 3,310 (+13%) | 6mo | $1,100,000 | $332 | 26 |
| 525 Midland St | 0.75mi | 5/3.0 (-1) | 2,497 (-14%) | 12mo | $725,000 | $290 | 26 |
Match score weights: distance 35% · size 25% · config 20% · recency 20%. Top-matched comps best support the ARV.
Projected returns pro-forma
-3.0% appreciation · 1.81% rent growth · sell at horizon
- IRR
- -15.0%
- Equity multiple
- 0.47×
- Total profit
- $-128,705
- Equity at exit
- $129,705
- IRR
- -8.3%
- Equity multiple
- 0.50×
- Total profit
- $-120,584
- Equity at exit
- $75,213
Cash invested: $243,572 (down + closing). Projections, not guarantees.
Landlord ↔ Tenant lean methodology
- Overall (STATE)
- 27 Tenant-Leaning
- State Connecticut
- 27 Tenant-Leaning · D+7
- County
- — inherits STATE
- City
- — inherits STATE
ZIP-level market 06605
- Home prices YoY
- -14.5%
- Rents YoY
- 1.8%
- Active inventory
- 47
- Price-to-rent
- 29.5×
Monthly cashflow live
- Estimated rent
- $7,370 high interval (Pro) →
- Mortgage (P&I)
- −$4,562
- Tax from tax record
- −$565 /mo · $6,784/yr
- Insurance
- −$362
- HOA
- −$0
- Vacancy / Maint / Mgmt
- −$1,548
- Net cashflow
- $333
Break-even live
3-unit breakdown (identical units grouped — click to expand)
| Units | Beds | Baths | Est. rent |
|---|---|---|---|
| 3× units | 3 | 1 | $7,371 |
| #1 | 3 | 1 | $2,457 |
| #2 | 3 | 1 | $2,457 |
| #3 | 3 | 1 | $2,457 |
| Total (3 units) | $7,370 | ||
UW: 25.0% down · 7.5% · 30yr · 1.5% tax · 5.0% vac · 8.0% maint · 8.0% mgmt
Financing live
Cash to close
- Down payment
- $217,475
- Closing costs
- $26,097
- Reserves months
- —
- Total cash needed
- —
Loan-product check · same deal, 3 products live
Conventional
25% down · 7.5% · 30yr
- Down + closing
- —
- Monthly P&I
- —
- Monthly cashflow
- —
- DSCR
- —
- Eligible?
- —
Personal DTI + credit; lowest rate.
DSCR
20% down · 8.5% · 30yr
- Down + closing
- —
- Monthly P&I
- —
- Monthly cashflow
- —
- DSCR
- —
- Eligible?
- —
No personal income docs; deal must DSCR.
Hard money
10% down · 12.0% · 12mo
- Down + closing
- —
- Monthly P&I
- —
- Monthly cashflow
- —
- DSCR
- —
- Eligible?
- —
Short-term bridge; refi at stabilization.
Rent comps 5 comps
| Address | Beds | Baths | Sqft | Rent | $/sqft | DOM | Units | Dist |
|---|---|---|---|---|---|---|---|---|
| 108 New England Ave Fairfield, CT | 5.0 | 4.5 | 3225 | $7,500 | $2.33 | 43d | 1 | 0.85mi |
| 241 Lewis St Unit 241 Bridgeport, CT | 6.0 | 2.0 | 2300 | $3,500 | $1.52 | 43d | 1 | 1.23mi |
| 156 Fieldcrest Rd Fairfield, CT | 5.0 | 3.0 | 1985 | $4,800 | $2.42 | 2d | 1 | 1.38mi |
| 38 Pepperbush Ln Fairfield, CT | 5.0 | 3.0 | 2860 | $7,500 | $2.62 | 11d | 1 | 1.40mi |
| 38 Pepperbush Ln Fairfield, CT | 5.0 | 3.5 | 3190 | $7,500 | $2.35 | 23d | 1 | 1.40mi |
Listing history 2 events
-
2026-04-07status Under Contract
-
2026-04-01$869,900 Active
ⓘ Source: listings_history table (triggers on properties + properties_extension) + one-shot
backfill from property_details.listing_events for pre-trigger history.
Tax reassessment forecast CT · Partial reset (capped growth)
- Current annual tax
- $6,784 · $565/mo
- Projected year-2 tax
- $12,700 · $1,058/mo
- Expected delta
- +$5,916/yr (+$493/mo · 87.2%)
ⓘ Screening estimate from a state-policy table — verify with the county assessor before closing.
Climate risk First Street
- Flood 1/10 Low FEMA zone X (unshaded) · 0% chance over 30 yrs
- Wildfire 1/10 Low
- Heat 6/10 Major 7 d/yr ≥97°F today · 15 d/yr by 30 yrs out
- Wind 6/10 Major 65% chance of damaging wind over 30 yrs
- Air quality 4/10 Moderate 5 unhealthy d/yr today · 7 by 30 yrs out
Nearby sold comps map
Loading sold comps map…
Walkable amenities ~0.75 mi
Loading nearby amenities…
Taxation est. · year 1
- Rental income
- $88,440
- − Mortgage interest
- −$48,728
- − Property taxes
- −$6,784
- − Insurance
- −$4,350
- − Repairs & maintenance
- −$7,075
- − Management
- −$7,075
- − Depreciation
- −$25,306
- Taxable loss
- −$10,878
- Est. tax savings @ 24.0%
- +$2,611
- After-tax cash flow
- $6,603/yr
For passive investors: Depreciation is non-cash, so a rental often shows a tax loss while cash-flowing — sheltering income. Rental losses are passive: they offset passive income freely, and up to $25,000/yr can offset ordinary (W-2) income if you actively participate and your MAGI is under $100k (phasing out to $0 by $150k); unused losses carry forward. On sale, claimed depreciation is recaptured at up to 25%, and gains may owe capital-gains tax (a 1031 exchange can defer both). Figures are a year-1 estimate at your 24.0% rate — not tax advice; consult a CPA.
Schools (NCES district)
- District
- Bridgeport School District
- NCES district ID
- 0900450
- Math proficiency
- 9% ▼ -7.00%
- Reading proficiency
- 19% ▼ -10.00%
- Median HH income
- $41,507
- Composite
- 12.09/100
- National rank
- #9656
- State rank
- #151 of 153 in CT
Livability — Bridgeport
- Score
- 81/100
- State rank
- #15
- US rank
- #1374
Category grades
Schools grade is shown separately in the Schools card above.
Census & demographics
- Census place
- Bridgeport, CT
- County
- Fairfield County · 765,532 people
- City population
- 149,153
- Metro
- Bridgeport-Stamford-Norwalk, CT
- Population (ZIP)
- 25,929
- Household income
- $56,179
- Rent vs Own
- Severe rent burden
- 2367.0
Population outlook (Greater Bridgeport County) Hauer SSP2
- By 2040
- 365,581
Race, ethnicity, and origin ACS 2023
- Neighborhood character
- Diverse neighborhood (Simpson 0.70)
- Race & ethnicity
- Hispanic / Latino 39% White 33% Black 19% Two or more races 12% Asian 5% Native American 1%
- Hispanic origin (detail)
- Mexican 6% Puerto Rican 17% Cuban 3% Dominican 3%
- Common ancestry
- Romanian 4% Hispanic 3% Scotch-Irish 2%
- Foreign-born
- 25% · Canada, Guatemala, China
- Languages at home
- 54% English-only · Spanish 32% Other Indo-European 4% French/Haitian/Cajun 3%
Political lean MEDSL · Greater Bridgeport
- 2024 margin
- Strong D (+23.3) · D 60.9% · R 37.6% · Other 1.5%
- All cycles
- 2024: D+23.3
Not yet ingested
- Civics
- —
Market trends
- HPI YoY
- ▼ -40.42%
- Current HPI
- 238.1786
- Rent YoY
- ▲ 1.81%
- Metro
- Bridgeport-Stamford-Norwalk, CT
- State GDP YoY
- ▲ 1.06%
- F500 in state
- 38
Industry mix (Fortune 500 HQ in CT)
| Industry | F500 HQs | Revenue |
|---|---|---|
| Industrial Machinery | 4 | $38B |
|
||
| Insurance | 3 | $71B |
|
||
| Financial Services | 2 | $25B |
|
||
| Transportation / Logistics | 2 | $18B |
|
||
| Healthcare | 1 | $247B |
|
||
| Telecommunications | 1 | $55B |
|
||
Price history
2 events — show timeline
- 2026-04-07 Pending — Smart MLS
- 2026-04-01 Listed $869,900 Smart MLS
Property tax history
+0.6%/yrLatest (2023): $6,784 · +0.0% YoY. Source: county tax records.
Cash-flow waterfall
monthlySold comps — $/sqft
last 12 mo · ≤1 miLoading sold comps…