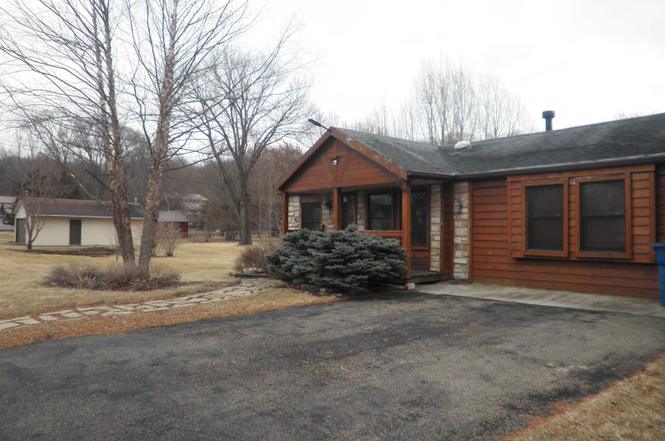
105 E Oakwood Dr · Byron, IL
Flood risk 1/10 · Minimal
- FEMA flood zone
- X (unshaded)
- Chance of flooding over 30 yrs
- 0.0%
- Est. flood insurance / yr
- $507 – $1,088
Fire risk 3/10 · Minor
- Est. fire insurance / yr
- $804 – $1,492
Heat risk 2/10 · Minimal
- Hot days now (above 101°F)
- 7 days/yr
- Hot days in 30 yrs
- 15 days/yr
Wind risk 2/10 · Minimal
- Chance of severe wind over 30 yrs
- —
Air-quality risk 3/10 · Minor
- Unhealthy air days now
- 2 days/yr
- Unhealthy air days in 30 yrs
- 3 days/yr
Risk factors via First Street. Map © Google.
Why this score? — see what drove the D- grade
The composite is a weighted blend of 9 inputs, each scored 0–100. Each bar is that input's sub-score; the figure is the points it added to the 100-point composite (weight × sub-score).
- Cash flow +13.5/30.0
- Schools +4.2/10.0
- DSCR +4.1/10.0
- Livability +4.0/5.0
- 1% rule +3.3/10.0
- Rent growth +2.5/5.0
- Condition / age +2.5/5.0
- ARV discount +1.5/15.0
- Appreciation +0.0/10.0
$235,000
🖨 Deal sheet (PDF) 📄 Offer letter ✓ Due diligence
Listing remarks
Well maintained 3 bedroom, 3 bath ranch home located in a desirable rural country subdivision on approximately 1/2 acre. Just steps from the scenic Rock River and area parks. Home features a great room with skylights and a cozy gas fireplace. Kitchen with center island and skylight, all appliances stay - including the washer and dryer and even big screen TV above the fireplace. Enjoy outdoor living on the 20' x 8, screened porch overlooking the backyard with firepit & additional 10' x 19' shed for storage. Property includes an attractive 31' x 23' detached garage with cement floor and asphault driveway. Newer septic system (2023) already in place. Optional HOA membership of only $30 a
Key facts
- Cozy gas fireplace
- Great room
- Scenic rock river
Tags
Property features AI
Exterior
- Parking: Detached garage on asphalt and concrete surfaces; Approximately 2.5 garage spaces
- Utilities: Public water; Septic tank sewer
- Home design: Single-family residence (house)
- Exterior features: Shingle roof; Lot approximately 0.48 acre
Interior
- Kitchen: Gas cooktop; Dishwasher; Microwave; Refrigerator
- Bathrooms: Three full bathrooms (all on main level)
- Heating & cooling: Forced air heating (natural gas); Central air conditioning
- Interior features: Gas fireplace (1) with gas starter; Crawl space foundation
- Laundry & utility: Washer and Dryer included; Water softener; Electric water heater
Neighborhood map
What this means for you Summary
Snapshot
- This is a 3-bed/3.0-bath single-family listed at $235k.
Deal economics
- At list price, monthly cash flow is $9 ($113/yr) — positive.
- The deal already cash-flows at list — no discount required.
- To meet the 1% rule (rent ≥ 1% of price), the offer needs to be $195k (17.1% below list).
- Recommended offer: $195k (17.1% below list) — sets the bar for 1% rule.
Location & tenants
- Location reads 81/100 on livability (#100 in IL, #1,602 nationally) — a professional / high-income tenant draw. Strengths: crime A+, cost of living A+, housing A+; Watch: amenities F, commute F.
- Byron CUSD 226 (town): math 45% / reading 50% proficiency, ranked #68 of 620 in IL (top 11%) — families likely to look elsewhere, expect single-tenant / working-renter base with shorter leases; only 17% free/reduced lunch — higher-income household profile.
- Zoned schools: Mary Morgan Elem Sch (math 56% / reading 45%, grade D+, #172 of 2,056 statewide, top 8%, 659 students, 0% FRL); Byron Middle School (math 38% / reading 57%, grade C-, #69 of 665 statewide, top 11%, 350 students, 0% FRL); Byron High School 9-12 (math 32% / reading 42%, grade F, #107 of 693 statewide, top 17%, 457 students, 0% FRL) — zoned schools average 0% FRL vs 17% district-wide (17 pts lower); this property's tenant base skews higher-income than the district average.
- Market conditions: 29 active listings in the ZIP; 113 units permitted in Ogle County in 2024 (67 in 5+ unit buildings).
Forward outlook
- Local home prices are declining (-3.0%/yr); year-one equity from $2k of loan paydown is wiped out by about $7k of value loss. Plan a longer hold.
- Ogle County population projected at -24% by 2050 — secular population decline; favor cash flow + early exit over multi-decade hold.
Negotiation context
- It's been on market 50 days — a 3% lower offer ($228k) is reasonable based on typical stale-listing flexibility.
- Current owner paid $100k; list at $235k implies a 135% gain — meaningful room to come down on a strong offer.
Questions for the listing agent
- It's been on market 50 days. Have you received any prior offers? Is the seller open to a 17% concession, seller financing, or rate buy-down credit?
- Is there a deadline driving the sale (1031 exchange, divorce, estate, relocation)? That informs how much negotiation room exists.
- Schools are B-rated — typically a magnet for longer-tenancy family renters. What's the average tenant stay here, and is there a school-zone premium baked into asking?
- The area grade is low — what's the realistic commute time and amenity access for the typical tenant pool here? Any planned neighborhood developments (good or bad) we should know about?
- What's the average days-on-market for RENTAL listings here right now (not sales)? A rising rental-DOM trend means longer vacancies and softer asking-rent achievability than the comps imply.
- What's the recent tenant-quality profile in this submarket — average credit score on applications, eviction rate, late-payment / NSF rate, and stable-employment percentage? A property-management company in the area should have these aggregated.
- How much new for-sale + rental construction is in the pipeline within 1–3 miles? Heavy new supply typically softens prices + rents 12–24 months out; constrained supply supports both.
Investment metrics
- 1% rule
- 0.83% ✗
- Cap rate
- 6.34%
- Cash-on-cash
- 0.17%
- DSCR
- 1.01
- GRM
- 10.1
CMA / ARV
- ARV (on-the-fly)
- $207,162
- Comps found
- 2
Show comp detail 2 sales within ~0.75 mi
| Address | Dist | Beds/Ba | Sqft | Sold | Price | $/sf | Match |
|---|---|---|---|---|---|---|---|
| 105 E Oakwood Dr | 0.00mi | 3/3.0 | 1,354 (0%) | 1mo | $206,500 | $153 | 99 |
| 311 E South Park Dr | 0.34mi | 2/1.0 (-1) | 1,210 (-11%) | 10mo | $155,000 | $128 | 45 |
Match score weights: distance 35% · size 25% · config 20% · recency 20%. Top-matched comps best support the ARV.
Projected returns pro-forma
-3.0% appreciation · 3.0% rent growth · sell at horizon
- IRR
- -16.1%
- Equity multiple
- 0.43×
- Total profit
- $-37,510
- Equity at exit
- $35,039
- IRR
- -7.7%
- Equity multiple
- 0.51×
- Total profit
- $-32,010
- Equity at exit
- $20,319
Cash invested: $65,800 (down + closing). Projections, not guarantees.
Landlord ↔ Tenant lean methodology
- Overall (STATE)
- 43 Moderately Tenant-Leaning
- State Illinois
- 43 Moderately Tenant-Leaning · D+7
- County
- — inherits STATE
- City
- — inherits STATE
ZIP-level market 61010
- Home prices YoY
- -27.8%
- Active inventory
- 29
- Price-to-rent
- 10.1×
Monthly cashflow live
- Estimated rent
- $1,948 medium interval (Pro) →
- Mortgage (P&I)
- −$1,232
- Tax from tax record
- −$199 /mo · $2,388/yr
- Insurance
- −$98
- HOA
- −$0
- Vacancy / Maint / Mgmt
- −$409
- Net cashflow
- $9
Break-even live
Sensitivity live
| Price | -10% $142 | -5% $76 | +0% $9 | +5% $-57 | +10% $-124 |
|---|---|---|---|---|---|
| Rent | -10% $-144 | -5% $-68 | +0% $9 | +5% $86 | +10% $163 |
| Rate | -1.0pp $128 | -0.5pp $69 | base $9 | +0.5pp $-51 | +1.0pp $-113 |
UW: 25.0% down · 7.5% · 30yr · 1.5% tax · 5.0% vac · 8.0% maint · 8.0% mgmt
Financing live
Cash to close
- Down payment
- $58,750
- Closing costs
- $7,050
- Reserves months
- —
- Total cash needed
- —
Loan-product check · same deal, 3 products live
Conventional
25% down · 7.5% · 30yr
- Down + closing
- —
- Monthly P&I
- —
- Monthly cashflow
- —
- DSCR
- —
- Eligible?
- —
Personal DTI + credit; lowest rate.
DSCR
20% down · 8.5% · 30yr
- Down + closing
- —
- Monthly P&I
- —
- Monthly cashflow
- —
- DSCR
- —
- Eligible?
- —
No personal income docs; deal must DSCR.
Hard money
10% down · 12.0% · 12mo
- Down + closing
- —
- Monthly P&I
- —
- Monthly cashflow
- —
- DSCR
- —
- Eligible?
- —
Short-term bridge; refi at stabilization.
Listing history 4 events
-
2026-04-20status Pending
-
2026-03-17price $235,000
-
2026-03-01$243,000 Active
-
2006-04-17soldstatus $100,000
ⓘ Source: listings_history table (triggers on properties + properties_extension) + one-shot
backfill from property_details.listing_events for pre-trigger history.
Tax reassessment forecast IL · Partial reset (capped growth)
- Current annual tax
- $2,388 · $199/mo
- Projected year-2 tax
- $3,861 · $322/mo
- Expected delta
- +$1,473/yr (+$123/mo · 61.7%)
ⓘ Screening estimate from a state-policy table — verify with the county assessor before closing.
Climate risk First Street
- Flood 1/10 Low FEMA zone X (unshaded) · 0% chance over 30 yrs
- Wildfire 3/10 Moderate
- Heat 2/10 Low 7 d/yr ≥101°F today · 15 d/yr by 30 yrs out
- Wind 2/10 Low
- Air quality 3/10 Moderate 2 unhealthy d/yr today · 3 by 30 yrs out
Nearby sold comps map
Loading sold comps map…
Walkable amenities ~0.75 mi
Loading nearby amenities…
Taxation est. · year 1
- Rental income
- $23,372
- − Mortgage interest
- −$13,164
- − Property taxes
- −$2,388
- − Insurance
- −$1,175
- − Repairs & maintenance
- −$1,870
- − Management
- −$1,870
- − Depreciation
- −$6,836
- Taxable loss
- −$3,930
- Est. tax savings @ 24.0%
- +$943
- After-tax cash flow
- $1,056/yr
For passive investors: Depreciation is non-cash, so a rental often shows a tax loss while cash-flowing — sheltering income. Rental losses are passive: they offset passive income freely, and up to $25,000/yr can offset ordinary (W-2) income if you actively participate and your MAGI is under $100k (phasing out to $0 by $150k); unused losses carry forward. On sale, claimed depreciation is recaptured at up to 25%, and gains may owe capital-gains tax (a 1031 exchange can defer both). Figures are a year-1 estimate at your 24.0% rate — not tax advice; consult a CPA.
Schools (NCES district)
- District
- Byron CUSD 226
- NCES district ID
- 1708010
- Math proficiency
- 45% ▼ -12.00%
- Reading proficiency
- 50% ▼ -11.00%
- Median HH income
- $66,582
- Composite
- 42.28/100
- National rank
- #3267
- State rank
- #68 of 620 in IL
Livability — Byron
- Score
- 81/100
- State rank
- #100
- US rank
- #1602
Category grades
Schools grade is shown separately in the Schools card above.
Census & demographics
- City population
- 7,494
- Population (ZIP)
- 7,494
Population outlook (Ogle County) Hauer SSP2
- Today (2025)
- 48,390 people
- By 2030
- 46,346 · -4.2%
- By 2040
- 41,772 · -13.7%
- By 2050
- 36,911 · -23.7%
- By 2075
- 27,130 · -43.9%
- By 2100
- 18,627 · -61.5%
Race, ethnicity, and origin ACS 2023
- Neighborhood character
- Predominantly White (87%)
- Race & ethnicity
- White 87% Hispanic / Latino 9% Two or more races 7%
- Hispanic origin (detail)
- Mexican 8%
- Common ancestry
- Romanian 5% Portuguese 4% Lithuanian 1%
- Foreign-born
- 4% · Canada, South Korea
- Languages at home
- 94% English-only · Spanish 6%
Political lean MEDSL · Ogle
- 2024 margin
- Strong R (+29.4) · D 34.5% · R 63.9% · Other 1.6%
- 2008→2024 swing
- -21.8pp toward R · 2008: -7.6pp · 2024: -29.4pp
- All cycles
- 2024: R+29.4 2020: R+25.9 2016: R+26.6 2012: R+16.7 2008: R+7.6
Not yet ingested
- Civics
- —
Market trends
- HPI YoY
- ▼ -66.23%
- Current HPI
- 171.8623
- Rent YoY
- —
- Metro
- —
- State GDP YoY
- ▲ 1.59%
- F500 in state
- 60
Industry mix (Fortune 500 HQ in IL)
| Industry | F500 HQs | Revenue |
|---|---|---|
| Insurance | 4 | $201B |
|
||
| Consumer Goods | 4 | $87B |
|
||
| Industrial Machinery | 3 | $64B |
|
||
| Healthcare | 2 | $55B |
|
||
| Retail / Pharmacy | 1 | $148B |
|
||
| Agriculture / Food | 1 | $86B |
|
||
Price history
+135.0% since first listed4 events — show timeline
- 2026-04-20 Pending — NWIAR
- 2026-03-17 Price Changed $235,000 NWIAR
- 2026-03-01 Listed $243,000 NWIAR
- 2006-04-17 Sold (Public Records) $100,000 Public Records
Property tax history
+4.1%/yrLatest (2024): $2,388 · +16.2% YoY. Source: county tax records.
Cash-flow waterfall
monthlySold comps — $/sqft
last 12 mo · ≤1 miLoading sold comps…