 🏗️ New Construction
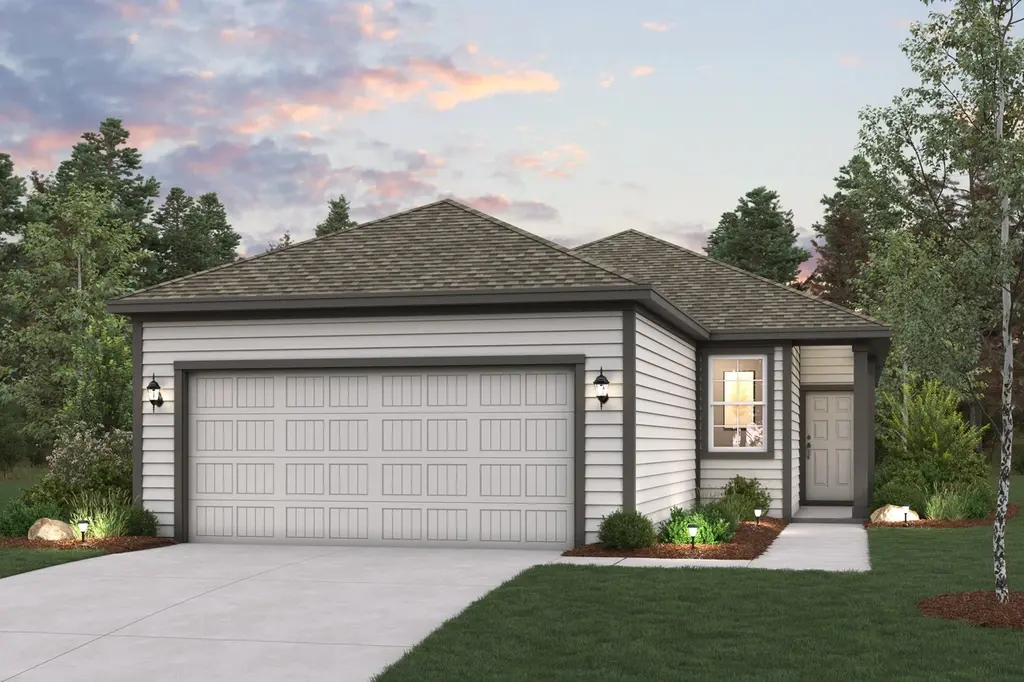
BRIDGEPORT Plan · Pattison, TX
Flood risk 6/10 · Moderate
- FEMA flood zone
- X (unshaded)
- Chance of flooding over 30 yrs
- 0.7%
- Est. flood insurance / yr
- $507 – $1,088
Fire risk 5/10 · Moderate
- Est. fire insurance / yr
- $1,222 – $2,270
Heat risk 8/10 · Major
- Hot days now (above 111°F)
- 7 days/yr
- Hot days in 30 yrs
- 22 days/yr
Wind risk 9/10 · Severe
- Chance of severe wind over 30 yrs
- 99.0%
Air-quality risk 2/10 · Minimal
- Unhealthy air days now
- 1 days/yr
- Unhealthy air days in 30 yrs
- 1 days/yr
Risk factors via First Street. Map © Google.
Why this score? — see what drove the F grade
The composite is a weighted blend of 9 inputs, each scored 0–100. Each bar is that input's sub-score; the figure is the points it added to the 100-point composite (weight × sub-score).
- ARV discount +7.5/15.0
- Cash flow +5.8/30.0
- Condition / age +4.0/5.0
- Livability +3.2/5.0
- Rent growth +2.2/5.0
- Schools +2.0/10.0
- 1% rule +1.2/10.0
- DSCR +0.2/10.0
- Appreciation +0.0/10.0
$238,990
🖨 Deal sheet 📄 Offer letter ✓ Due diligence
Listing remarks MLS
The Bridgeport brings everything together in one comfortable, convenient single-story floor plan. Centered around an airy, open kitchen that overlooks a dining room and a great room, the main living area is spacious and inviting. The lavish primary suite boasts a private bath with a walk-in shower, dual vanities, and a walk-in closet. Adjacent, you'll find three additional bedrooms, offering ample space for rest and relaxation.
Key facts
- 2 garage spots
- Listed 64 days
Neighborhood map
What this means for you Summary
Snapshot
- This is a 4-bed/2.0-bath single-family listed at $239k. Condition is rated good.
Deal economics
- At list price, monthly cash flow is $-751 ($-9k/yr) — negative.
- The deal already cash-flows at list — no discount required.
- To meet the 1% rule (rent ≥ 1% of price), the offer needs to be $232k (2.7% below list).
- Recommended offer: $225k (6.0% below list) — sets the bar for market timing.
Location & tenants
- Location reads 63/100 on livability (#876 in TX) — a middle-class / working-renter tenant base. Strengths: housing A+, crime A, cost of living A; Watch: schools F, amenities F, commute F.
- Royal ISD (rural): math 23% / reading 23% proficiency, ranked #744 of 826 in TX (top 90%) — low school quality limits family demand, transient renter base, plan for 1-2y turnover; 77% free/reduced lunch — lower-income household profile, screen leases tightly.
- Market conditions: Rents soft (-1.0%/yr); 997 active listings in the ZIP; solid renter incomes; 483 units permitted in Waller County in 2024 (89 in 5+ unit buildings).
- This rent runs 33% of the median local income ($84k/yr) — at the standard rent-burdened threshold; future hikes will face affordability resistance.
Forward outlook
- Local home prices are declining (-3.0%/yr); year-one equity from $3k of loan paydown is wiped out by about $11k of value loss. Plan a longer hold.
- Waller County population projected at +62% by 2050 — long-run rental-demand tailwind backs the buy-and-hold thesis.
Negotiation context
- It's been on market 64 days — a 6% lower offer ($225k) is reasonable based on typical stale-listing flexibility.
Risks & watch-outs
- Climate carrying-cost: major flood risk; severe wind risk, 99% chance of damaging wind over 30y; moderate wildfire risk; extreme-heat days projected 7→22/yr by 2055 (HVAC capex compounding) — expect insurance premiums to compound above CPI over the hold.
Questions for the listing agent
- What do current leases actually rent for vs. the listed asking? Can we see a recent rent roll and the last 12 months of T-12 income?
- It's been on market 64 days. Have you received any prior offers? Is the seller open to a 6% concession, seller financing, or rate buy-down credit?
- Why hasn't it sold? Are there any deal-killer items the seller is aware of (foundation, flood, title, zoning, code violations)?
- Is there a deadline driving the sale (1031 exchange, divorce, estate, relocation)? That informs how much negotiation room exists.
- Schools are F-rated, which usually means shorter tenancies and higher turnover. Who's the typical renter profile here, and what's been the actual vacancy rate?
- The area grade is low — what's the realistic commute time and amenity access for the typical tenant pool here? Any planned neighborhood developments (good or bad) we should know about?
- What's the average days-on-market for RENTAL listings here right now (not sales)? A rising rental-DOM trend means longer vacancies and softer asking-rent achievability than the comps imply.
- What's the recent tenant-quality profile in this submarket — average credit score on applications, eviction rate, late-payment / NSF rate, and stable-employment percentage? A property-management company in the area should have these aggregated.
- How much new for-sale + rental construction is in the pipeline within 1–3 miles? Heavy new supply typically softens prices + rents 12–24 months out; constrained supply supports both.
Investment metrics
- 1% rule
- 0.62% ✗
- Cap rate
- 3.89%
- Cash-on-cash
- -8.60%
- DSCR
- 0.62
- GRM
- 13.4
CMA / ARV
- ARV (median comp)
- $374,468
- List price
- $238,990
- Delta
- -36.18%
- Verdict
- UNDERPRICED
- Comps
- 4 within 1.0 mi
Show comp detail 1 sale within ~0.75 mi
| Address | Dist | Beds/Ba | Sqft | Sold | Price | $/sf | Match |
|---|---|---|---|---|---|---|---|
| 1213 Catalina Dr | 0.13mi | 3/2.0 (-1) | 1,388 (-12%) | 1mo | $235,900 | $170 | 68 |
Match score weights: distance 35% · size 25% · config 20% · recency 20%. Top-matched comps best support the ARV.
Projected returns pro-forma
-3.0% appreciation · 0.0% rent growth · sell at horizon
- IRR
- -34.8%
- Equity multiple
- -0.10×
- Total profit
- $-115,312
- Equity at exit
- $55,834
- IRR
- -68.2%
- Equity multiple
- -0.80×
- Total profit
- $-188,218
- Equity at exit
- $32,377
Cash invested: $104,851 (down + closing). Projections, not guarantees.
Landlord ↔ Tenant lean methodology
- Overall (STATE)
- 87 Strongly Landlord-Friendly
- State Texas
- 87 Strongly Landlord-Friendly · R+5
- County
- — inherits STATE
- City
- — inherits STATE
ZIP-level market 77423
- Rents YoY
- -1.0%
- Active inventory
- 997
- Price-to-rent
- 8.6×
Monthly cashflow live
- Estimated rent
- $2,325 medium interval (Pro) →
- Mortgage (P&I)
- −$1,964
- Tax est. 1.5%
- −$468 /mo · $5,617/yr
- Insurance
- −$156
- HOA
- −$0
- Vacancy / Maint / Mgmt
- −$488
- Net cashflow
- $-751
Break-even live
UW: 25.0% down · 7.5% · 30yr · 1.5% tax · 5.0% vac · 8.0% maint · 8.0% mgmt
Financing live
Cash to close
- Down payment
- $93,617
- Closing costs
- $11,234
- Reserves months
- —
- Total cash needed
- —
Loan-product check · same deal, 3 products live
Conventional
25% down · 7.5% · 30yr
- Down + closing
- —
- Monthly P&I
- —
- Monthly cashflow
- —
- DSCR
- —
- Eligible?
- —
Personal DTI + credit; lowest rate.
DSCR
20% down · 8.5% · 30yr
- Down + closing
- —
- Monthly P&I
- —
- Monthly cashflow
- —
- DSCR
- —
- Eligible?
- —
No personal income docs; deal must DSCR.
Hard money
10% down · 12.0% · 12mo
- Down + closing
- —
- Monthly P&I
- —
- Monthly cashflow
- —
- DSCR
- —
- Eligible?
- —
Short-term bridge; refi at stabilization.
Listing history 14 events
-
2026-06-18days on market $238,990 Active 64 DOM
-
2026-06-17days on market $238,990 Active 63 DOM
-
2026-06-16days on market $238,990 Active 62 DOM
-
2026-06-15days on market $238,990 Active 61 DOM
-
2026-06-13days on market $238,990 Active 59 DOM
-
2026-06-10days on market $238,990 Active 55 DOM
-
2026-06-08days on market $238,990 Active 54 DOM
-
2026-06-07days on market $238,990 Active 53 DOM
-
2026-06-04days on market $238,990 Active 50 DOM
-
2026-06-03days on market $238,990 Active 49 DOM
-
2026-06-02days on market $238,990 Active 48 DOM
-
2026-06-01days on market $238,990 Active 47 DOM
-
2026-05-31days on market $238,990 Active 46 DOM
-
2026-04-15$238,990 Active 431-char remark
Show marketing remark (431 chars)
The Bridgeport brings everything together in one comfortable, convenient single-story floor plan. Centered around an airy, open kitchen that overlooks a dining room and a great room, the main living area is spacious and inviting. The lavish primary suite boasts a private bath with a walk-in shower, dual vanities, and a walk-in closet. Adjacent, you'll find three additional bedrooms, offering ample space for rest and relaxation.
ⓘ Source: listings_history table (triggers on properties + properties_extension) + one-shot
backfill from property_details.listing_events for pre-trigger history.
Climate risk First Street
- Flood 6/10 Major FEMA zone X (unshaded) · 70% chance over 30 yrs
- Wildfire 5/10 Major
- Heat 8/10 Severe 7 d/yr ≥111°F today · 22 d/yr by 30 yrs out
- Wind 9/10 Extreme 99% chance of damaging wind over 30 yrs
- Air quality 2/10 Low 1 unhealthy d/yr today · 1 by 30 yrs out
Nearby sold comps map
Loading sold comps map…
Walkable amenities ~0.75 mi
Loading nearby amenities…
Taxation est. · year 1
- Rental income
- $27,896
- − Mortgage interest
- −$20,976
- − Property taxes
- −$5,617
- − Insurance
- −$1,872
- − Repairs & maintenance
- −$2,232
- − Management
- −$2,232
- − Depreciation
- −$10,894
- Taxable loss
- −$15,926
- Est. tax savings @ 24.0%
- +$3,822
- After-tax cash flow
- $-5,194/yr
For passive investors: Depreciation is non-cash, so a rental often shows a tax loss while cash-flowing — sheltering income. Rental losses are passive: they offset passive income freely, and up to $25,000/yr can offset ordinary (W-2) income if you actively participate and your MAGI is under $100k (phasing out to $0 by $150k); unused losses carry forward. On sale, claimed depreciation is recaptured at up to 25%, and gains may owe capital-gains tax (a 1031 exchange can defer both). Figures are a year-1 estimate at your 24.0% rate — not tax advice; consult a CPA.
Condition & rehab AI · 7 photos
The Bridgeport home is in good condition with a well-maintained exterior and interior. It offers a spacious floor plan and modern finishes, making it a great investment opportunity.
Value-add opportunities
- Both Painting the exterior and interior walls — Fresh paint can enhance curb appeal and interior aesthetics.
- Both Landscaping improvements — Enhanced landscaping can improve curb appeal and attract potential buyers/tenants.
- Both Adding smart home features — Smart home features can increase the home's appeal and market value.
- Both Upgrading the kitchen appliances — Modern appliances can make the kitchen more functional and attractive to potential buyers/tenants.
Renovation cost estimate screening
Value-add ROI direction
- Both Painting the exterior and interior walls — Fresh paint can enhance curb appeal and interior aesthetics. ↑
- Both Landscaping improvements — Enhanced landscaping can improve curb appeal and attract potential buyers/tenants. ↑
- Both Adding smart home features — Smart home features can increase the home's appeal and market value. ↑
- Both Upgrading the kitchen appliances — Modern appliances can make the kitchen more functional and attractive to potential buyers/tenants. ↑
ⓘ Cost ranges are severity-bucket heuristics (US national rule-of-thumb). Get contractor quotes + a written scope before underwriting a rehab budget.
Schools (NCES district)
- District
- Royal ISD
- NCES district ID
- 4838190
- Math proficiency
- 23% ▼ -11.00%
- Reading proficiency
- 23% ▼ -6.00%
- Median HH income
- $41,059
- Composite
- 19.55/100
- National rank
- #8760
- State rank
- #744 of 826 in TX
Livability — Pattison
- Score
- 63/100
- State rank
- #876
- US rank
- #15789
Category grades
Schools grade is shown separately in the Schools card above.
Census & demographics
- County
- Waller County · 18,767 people
- City population
- 18,767
- Metro
- Houston-The Woodlands-Sugar Land, TX
- Population (ZIP)
- 18,767
- Household income
- $84,490
- Rent vs Own
- Severe rent burden
- 20.0
Population outlook (Waller County) Hauer SSP2
- Today (2025)
- 60,772 people
- By 2030
- 67,616 · +11.3%
- By 2040
- 82,283 · +35.4%
- By 2050
- 98,276 · +61.7%
- By 2075
- 142,860 · +135.1%
- By 2100
- 175,596 · +188.9%
Race, ethnicity, and origin ACS 2023
- Neighborhood character
- Diverse neighborhood (Simpson 0.64)
- Race & ethnicity
- Hispanic / Latino 41% White 41% Black 14% Two or more races 13% Asian 2% Native American 1%
- Hispanic origin (detail)
- Mexican 30% Cuban 2%
- Common ancestry
- Lithuanian 2% Italian 2% Slovak 1%
- Foreign-born
- 17% · Canada, China, Dominican Republic
- Languages at home
- 65% English-only · Spanish 32% French/Haitian/Cajun 1% Other Indo-European 1%
Political lean MEDSL · Waller
- 2024 margin
- Strong R (+25.0) · D 37.0% · R 62.0% · Other 1.0%
- 2008→2024 swing
- -17.9pp toward R · 2008: -7.2pp · 2024: -25.0pp
- All cycles
- 2024: R+25.0 2020: R+26.7 2016: R+28.6 2012: R+17.6 2008: R+7.2
Not yet ingested
- Civics
- —
Market trends
- HPI YoY
- ▼ -125.28%
- Current HPI
- 204.8709
- Rent YoY
- ▼ -1.01%
- Metro
- Houston-The Woodlands-Sugar Land, TX
- State GDP YoY
- ▲ 3.95%
- F500 in state
- 110
Industry mix (Fortune 500 HQ in TX)
| Industry | F500 HQs | Revenue |
|---|---|---|
| Energy | 16 | $1,198B |
|
||
| Technology | 5 | $198B |
|
||
| Engineering / Construction | 4 | $72B |
|
||
| Energy Services | 3 | $60B |
|
||
| Utilities | 3 | $41B |
|
||
| Healthcare | 2 | $330B |
|
||
Price history
1 event — show timeline
- 2026-04-15 Listed $238,990 Zillow
Cash-flow waterfall
monthlySold comps — $/sqft
last 12 mo · ≤1 miLoading sold comps…