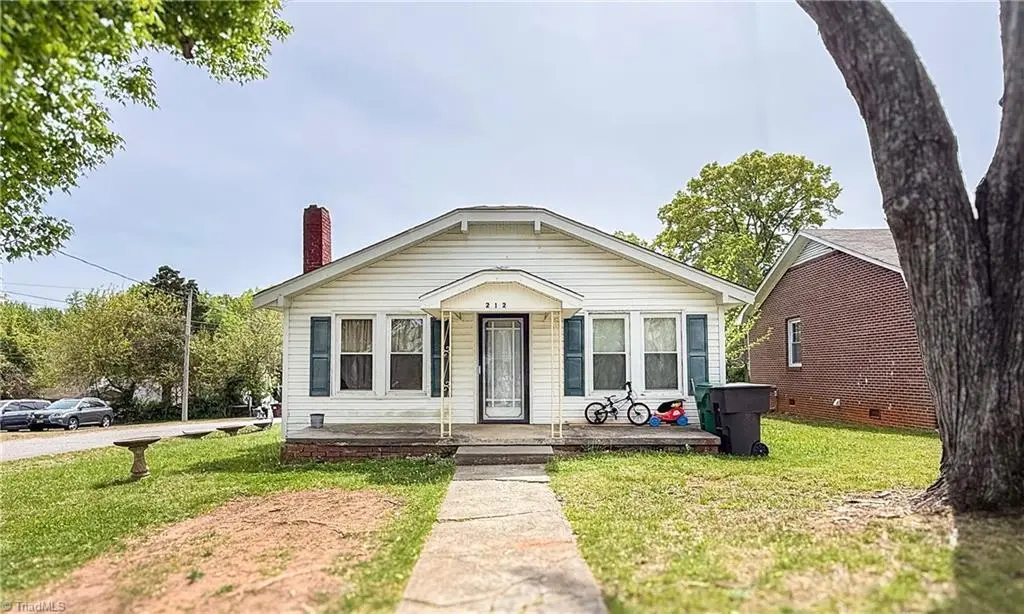
212 E Moore Ave · High Point, NC
Flood risk 8/10 · Major
- FEMA flood zone
- X (unshaded)
- Chance of flooding over 30 yrs
- 0.78%
- Est. flood insurance / yr
- $507 – $1,088
Fire risk 1/10 · Minimal
- Est. fire insurance / yr
- $906 – $1,684
Heat risk 5/10 · Moderate
- Hot days now (above 103°F)
- 7 days/yr
- Hot days in 30 yrs
- 17 days/yr
Wind risk 4/10 · Minor
- Chance of severe wind over 30 yrs
- 16.0%
Air-quality risk 2/10 · Minimal
- Unhealthy air days now
- 1 days/yr
- Unhealthy air days in 30 yrs
- 1 days/yr
Risk factors via First Street. Map © Google.
Why this score? — see what drove the C- grade
The composite is a weighted blend of 9 inputs, each scored 0–100. Each bar is that input's sub-score; the figure is the points it added to the 100-point composite (weight × sub-score).
- Cash flow +16.5/30.0
- ARV discount +13.8/15.0
- DSCR +5.1/10.0
- Livability +3.9/5.0
- Schools +3.6/10.0
- 1% rule +3.5/10.0
- Rent growth +2.5/5.0
- Condition / age +2.5/5.0
- Appreciation +0.0/10.0
$129,000
🖨 Deal sheet 📄 Offer letter ✓ Due diligence
Listing remarks
Charming and versatile 2-bedroom, 1-bath home situated on a spacious corner lot! This well-maintained property features a separate dining room currently being used as a third bedroom, offering flexibility to suit your needs. Enjoy comfortable living with central heating and air, plus plenty of outdoor space perfect for entertaining, gardening, or future possibilities. Opportunity for homeowners or investors alike!
Key facts
- Separate dining room
- Outdoor space
- Corner lot
Tags
Property features AI
Finance
- Financial info: Annual tax information available (not included per instructions)
- HOA & community: No association; Located in High Point area
Exterior
- Parking: Driveway
- Utilities: Public sewer; Electric water heater; Public water
- Home design: Residential stick/site-built house; One story; Built in 1930; Living room fireplace
- Construction: Aluminum and vinyl siding; Existing structure
- Exterior features: Public-maintained road access; Public water source; No pool; Lot of approximately 0.19 acres
Interior
- Kitchen: Electric water heater
- Bedrooms: Bedrooms on the main level
- Bathrooms: 1 full bathroom
- Heating & cooling: Central air conditioning; Forced air heating; Natural gas heating fuel
- Interior features: Primary bedroom located on the main level; Crawl space foundation; Living room with fireplace
Neighborhood map
What this means for you Summary
Snapshot
- This is a 2-bed/1.0-bath single-family listed at $129k.
Deal economics
- At list price, monthly cash flow is $9 ($113/yr) — positive.
- The deal already cash-flows at list — no discount required.
- To meet the 1% rule (rent ≥ 1% of price), the offer needs to be $110k (14.9% below list).
- Recommended offer: $110k (14.9% below list) — sets the bar for 1% rule.
- Cap rate 7.0% vs local median 4.0% in High Point — top-decile yield for the area; either an underpriced asset or a hidden risk that comps aren't pricing in. Stress-test before assuming the spread holds.
Location & tenants
- Location reads 77/100 on livability (#31 in NC, #3,084 nationally) — a middle-class / working-renter tenant base. Strengths: commute A+, cost of living A+, housing A+; Watch: schools D+, amenities D, employment D.
- Guilford County Schools (urban): math 39% / reading 45% proficiency, ranked #99 of 178 in NC (top 56%) — families likely to look elsewhere, expect single-tenant / working-renter base with shorter leases.
- Market conditions: 132 active listings in the ZIP; 12 comparable units currently listed for rent nearby; rentals at typical pace (median 23d on market — plan ~3-4 weeks tenant-placement turnaround); 3,843 units permitted in Guilford County in 2024 (2,397 in 5+ unit buildings).
Forward outlook
- Local home prices are declining (-3.0%/yr); year-one equity from $892 of loan paydown is wiped out by about $4k of value loss. Plan a longer hold.
- Guilford County population projected at +26% by 2050 — long-run rental-demand tailwind backs the buy-and-hold thesis.
Negotiation context
- It's been on market 65 days — a 6% lower offer ($121k) is reasonable based on typical stale-listing flexibility.
- 2 sale attempts since 5y ago; this cycle's ask has dropped $16k (11%) from the opening price — seller is motivated, your offer sets the floor, not the list.
- Current owner paid $55k; list at $129k implies a 135% gain — meaningful room to come down on a strong offer.
Risks & watch-outs
- Watch-outs: flood insurance adds $66/mo; built in 1930 — expect roof / HVAC / electrical / plumbing capex.
- Climate carrying-cost: severe flood risk; extreme-heat days projected 7→17/yr by 2055 (HVAC capex compounding) — expect insurance premiums to compound above CPI over the hold.
Questions for the listing agent
- It's been on market 65 days. Have you received any prior offers? Is the seller open to a 15% concession, seller financing, or rate buy-down credit?
- Built in 1930 — when were the roof, HVAC, electrical panel, plumbing, and water heater last replaced?
- What's the actual annual flood-insurance premium (NFIP or private), and is the property in a SFHA with mandatory coverage?
- Why hasn't it sold? Are there any deal-killer items the seller is aware of (foundation, flood, title, zoning, code violations)?
- Is there a deadline driving the sale (1031 exchange, divorce, estate, relocation)? That informs how much negotiation room exists.
- Schools are D-rated, which usually means shorter tenancies and higher turnover. Who's the typical renter profile here, and what's been the actual vacancy rate?
- Crime grade is F in this area — have there been break-ins, vandalism, or insurance claims at this property in the last 3 years? What carrier currently insures it and at what premium?
- What's the average days-on-market for RENTAL listings here right now (not sales)? A rising rental-DOM trend means longer vacancies and softer asking-rent achievability than the comps imply.
- What's the recent tenant-quality profile in this submarket — average credit score on applications, eviction rate, late-payment / NSF rate, and stable-employment percentage? A property-management company in the area should have these aggregated.
- How much new for-sale + rental construction is in the pipeline within 1–3 miles? Heavy new supply typically softens prices + rents 12–24 months out; constrained supply supports both.
Investment metrics
- 1% rule
- 0.85% ✗
- Cap rate
- 7.00%
- Cash-on-cash
- 2.52%
- DSCR
- 1.11
- GRM
- 9.8
CMA / ARV
- ARV (on-the-fly)
- $150,072
- Comps found
- 10
Show comp detail 10 sales within ~0.75 mi
| Address | Dist | Beds/Ba | Sqft | Sold | Price | $/sf | Match |
|---|---|---|---|---|---|---|---|
| 312 Model Farm Rd | 0.20mi | 2/1.0 | 912 (+3%) | 1mo | $149,350 | $164 | 86 |
| 2412 Dane St | 0.24mi | 2/1.0 | 882 (-1%) | 14mo | $177,500 | $201 | 76 |
| 335 Nathan Hunt Dr | 0.60mi | 2/1.0 | 890 (+0%) | 2mo | $150,000 | $169 | 70 |
| 2407 Robbins St | 0.27mi | 2/1.0 | 967 (+9%) | 17mo | $112,000 | $116 | 58 |
| 307 Player Dr | 0.63mi | 2/1.0 | 893 (+1%) | 17mo | $84,500 | $95 | 55 |
| 1810 Walton St | 0.65mi | 2/1.0 | 900 (+1%) | 18mo | $153,000 | $170 | 52 |
| 411 Player Dr | 0.72mi | 2/1.0 | 851 (-4%) | 20mo | $137,000 | $161 | 43 |
| 106 Fraley Rd | 0.27mi | 3/2.0 (+1) | 1,012 (+14%) | 23mo | $188,691 | $186 | 36 |
| 417 Player Dr | 0.73mi | 2/1.0 | 768 (-14%) | 16mo | $110,000 | $143 | 30 |
| 418 Player Dr | 0.72mi | 3/2.0 (+1) | 1,000 (+13%) | 22mo | $198,000 | $198 | 18 |
Match score weights: distance 35% · size 25% · config 20% · recency 20%. Top-matched comps best support the ARV.
Projected returns pro-forma
-3.0% appreciation · 3.0% rent growth · sell at horizon
- IRR
- -15.8%
- Equity multiple
- 0.44×
- Total profit
- $-20,308
- Equity at exit
- $19,234
- IRR
- -7.4%
- Equity multiple
- 0.53×
- Total profit
- $-16,929
- Equity at exit
- $11,154
Cash invested: $36,120 (down + closing). Projections, not guarantees.
Landlord ↔ Tenant lean methodology
- Overall (STATE)
- 85 Strongly Landlord-Friendly
- State North Carolina
- 85 Strongly Landlord-Friendly · R+3
- County
- — inherits STATE
- City
- — inherits STATE
ZIP-level market 27263
- Home prices YoY
- -26.9%
- Active inventory
- 132
- Price-to-rent
- 9.8×
Monthly cashflow live
- Estimated rent
- $1,097 high interval (Pro) →
- Mortgage (P&I)
- −$676
- Tax from tax record
- −$61 /mo · $729/yr
- Insurance
- −$54
- Flood insurance flood zone
- −$66 /mo · $798/yr
- HOA
- −$0
- Vacancy / Maint / Mgmt
- −$230
- Net cashflow
- $9
Break-even live
UW: 25.0% down · 7.5% · 30yr · 1.5% tax · 5.0% vac · 8.0% maint · 8.0% mgmt
Financing live
Cash to close
- Down payment
- $32,250
- Closing costs
- $3,870
- Reserves months
- —
- Total cash needed
- —
Loan-product check · same deal, 3 products live
Conventional
25% down · 7.5% · 30yr
- Down + closing
- —
- Monthly P&I
- —
- Monthly cashflow
- —
- DSCR
- —
- Eligible?
- —
Personal DTI + credit; lowest rate.
DSCR
20% down · 8.5% · 30yr
- Down + closing
- —
- Monthly P&I
- —
- Monthly cashflow
- —
- DSCR
- —
- Eligible?
- —
No personal income docs; deal must DSCR.
Hard money
10% down · 12.0% · 12mo
- Down + closing
- —
- Monthly P&I
- —
- Monthly cashflow
- —
- DSCR
- —
- Eligible?
- —
Short-term bridge; refi at stabilization.
Rent comps 12 comps
| Address | Beds | Baths | Sqft | Rent | $/sqft | DOM | Units | Dist |
|---|---|---|---|---|---|---|---|---|
| 304 Ardale Dr Unit 1B High Point, NC | 2.0 | 2.5 | 1000 | $1,050 | $1.05 | 23d | 1 | 0.40mi |
| 2452 Bellemeade St High Point, NC | 2.0–3.0 | 2.0 | 1050 | $1,125 | $1.07 | 14d | 9 | 0.41mi |
| 310 Ardale Dr Unit 1B High Point, NC | 2.0 | 2.0 | 1000 | $1,050 | $1.05 | 23d | 1 | 0.42mi |
| 314 Ardale Dr High Point, NC | 2.0 | 2.0–3.0 | 1000 | $1,050 | $1.05 | 23d | 3 | 0.43mi |
| 312 Ardale Dr High Point, NC | 2.0 | 2.5–3.0 | 1024 | $1,050 | $1.03 | 23d | 2 | 0.45mi |
| 525 Weaver Ave Archdale, NC | 2.0 | 1.0 | 800 | $850 | $1.06 | 14d | 1 | 0.95mi |
| 116 E Swathmore Ave High Point, NC | 1.0 | 1.0 | 845 | $1,155 | $1.37 | 14d | 3 | 0.98mi |
| 1109 Garrison St High Point, NC | 2.0 | 1.0 | 768 | $1,100 | $1.43 | 23d | 1 | 1.02mi |
| 1506 Hidden Creek Ter High Point, NC | 3.0 | 2.0 | 1065 | $1,395 | $1.31 | 21d | 1 | 1.15mi |
| 819 Belmont Dr High Point, NC | 2.0 | 2.0 | 900 | $1,350 | $1.50 | 14d | 1 | 1.15mi |
| 1009 Cassell St High Point, NC | 3.0 | 1.0 | 975 | $1,050 | $1.08 | 23d | 1 | 1.34mi |
| 820 Mobile St Unit A High Point, NC | 2.0 | 2.0 | 550 | $995 | $1.81 | 21d | 1 | 1.46mi |
Listing history 24 events
-
2026-06-18days on market $129,000 Active 65 DOM
-
2026-06-17days on market $129,000 Active 64 DOM
-
2026-06-16days on market $129,000 Active 63 DOM
-
2026-06-15days on market $129,000 Active 62 DOM
-
2026-06-14pricedays on market $129,000 Active 60 DOM
-
2026-06-10days on market $139,000 Active 57 DOM
-
2026-06-09days on market $139,000 Active 56 DOM
-
2026-06-08days on market $139,000 Active 55 DOM
-
2026-06-07days on market $139,000 Active 54 DOM
-
2026-06-03days on market $139,000 Active 50 DOM
-
2026-06-02days on market $139,000 Active 49 DOM
-
2026-06-01days on market $139,000 Active 48 DOM
-
2026-05-31days on market $139,000 Active 47 DOM
-
2026-05-31days on market $139,000 Active 46 DOM
-
2026-05-11price $139,000
-
2026-04-14$145,000 Active
-
2021-08-03soldstatus $55,000 Closed
-
2021-08-03soldstatus $55,000
-
2021-07-10status Pending
-
2021-07-09historical Due Diligence Period
-
2021-06-29price $69,000
-
2021-06-22price $75,000
-
2021-06-15$80,000 Active
-
1983-11-01soldstatus $25,000
ⓘ Source: listings_history table (triggers on properties + properties_extension) + one-shot
backfill from property_details.listing_events for pre-trigger history.
Tax reassessment forecast NC · Resets to sale price
- Current annual tax
- $729 · $61/mo
- Projected year-2 tax
- $1,058 · $88/mo
- Expected delta
- +$329/yr (+$27/mo · 45.1%)
ⓘ Screening estimate from a state-policy table — verify with the county assessor before closing.
Climate risk First Street
- Flood 8/10 Severe FEMA zone X (unshaded) · 78% chance over 30 yrs
- Wildfire 1/10 Low
- Heat 5/10 Major 7 d/yr ≥103°F today · 17 d/yr by 30 yrs out
- Wind 4/10 Moderate 16% chance of damaging wind over 30 yrs
- Air quality 2/10 Low 1 unhealthy d/yr today · 1 by 30 yrs out
Nearby sold comps map
Loading sold comps map…
Walkable amenities ~0.75 mi
Loading nearby amenities…
Taxation est. · year 1
- Rental income
- $13,167
- − Mortgage interest
- −$7,226
- − Property taxes
- −$729
- − Insurance
- −$1,442
- − Repairs & maintenance
- −$1,053
- − Management
- −$1,053
- − Depreciation
- −$3,753
- Taxable loss
- −$2,089
- Est. tax savings @ 24.0%
- +$501
- After-tax cash flow
- $615/yr
For passive investors: Depreciation is non-cash, so a rental often shows a tax loss while cash-flowing — sheltering income. Rental losses are passive: they offset passive income freely, and up to $25,000/yr can offset ordinary (W-2) income if you actively participate and your MAGI is under $100k (phasing out to $0 by $150k); unused losses carry forward. On sale, claimed depreciation is recaptured at up to 25%, and gains may owe capital-gains tax (a 1031 exchange can defer both). Figures are a year-1 estimate at your 24.0% rate — not tax advice; consult a CPA.
Schools (NCES district)
- District
- Guilford County Schools
- NCES district ID
- 3701920
- Math proficiency
- 39% ▲ 1.00%
- Reading proficiency
- 45% ▲ 1.00%
- Median HH income
- $46,315
- Composite
- 35.78/100
- National rank
- #4842
- State rank
- #99 of 178 in NC
Livability — High Point
- Score
- 77/100
- State rank
- #31
- US rank
- #3084
Category grades
Schools grade is shown separately in the Schools card above.
Census & demographics
- Census place
- High Point, NC
- County
- Randolph County · 81,617 people
- City population
- 102,450
- Metro
- Greensboro-High Point, NC
- Population (ZIP)
- 21,446
- Household income
- $55,801
- Rent vs Own
- Severe rent burden
- 381.0
Population outlook (Guilford County) Hauer SSP2
- Today (2025)
- 584,596 people
- By 2030
- 616,851 · +5.5%
- By 2040
- 678,451 · +16.1%
- By 2050
- 734,788 · +25.7%
- By 2075
- 862,985 · +47.6%
- By 2100
- 948,704 · +62.3%
Race, ethnicity, and origin ACS 2023
- Neighborhood character
- Majority White (65%)
- Race & ethnicity
- White 65% Black 14% Hispanic / Latino 10% Asian 8% Two or more races 5%
- Hispanic origin (detail)
- Mexican 6% Puerto Rican 1%
- Common ancestry
- Italian 4% Serbian 3% Slovak 3%
- Foreign-born
- 10% · Canada, Vietnam
- Languages at home
- 83% English-only · Spanish 8% Other Indo-European 5% Vietnamese 3%
Political lean MEDSL · Guilford
- 2024 margin
- Strong D (+21.8) · D 60.2% · R 38.4% · Other 1.4%
- 2008→2024 swing
- +3.5pp toward D · 2008: 18.4pp · 2024: 21.8pp
- All cycles
- 2024: D+21.8 2020: D+23.1 2016: D+20.0 2012: D+16.5 2008: D+18.4
Not yet ingested
- Civics
- —
Market trends
- HPI YoY
- ▼ -84.54%
- Current HPI
- 229.4967
- Rent YoY
- —
- Metro
- Greensboro-High Point, NC
- State GDP YoY
- ▲ 3.28%
- F500 in state
- 26
Industry mix (Fortune 500 HQ in NC)
| Industry | F500 HQs | Revenue |
|---|---|---|
| Financial Services | 2 | $213B |
|
||
| Retail | 2 | $95B |
|
||
| Industrial Conglomerate | 1 | $38B |
|
||
| Metals / Steel | 1 | $35B |
|
||
| Utilities | 1 | $30B |
|
||
| Industrial Machinery | 1 | $19B |
|
||
Price history
+456.0% since first listed10 events — show timeline
- 2026-05-11 Price Changed $139,000 Triad MLS
- 2026-04-14 Listed $145,000 Triad MLS
- 2021-08-03 Sold (Public Records) $55,000 Public Records
- 2021-08-03 Sold (MLS) $55,000 Triad MLS
- 2021-07-10 Pending — Triad MLS
- 2021-07-09 Contingent — Triad MLS
- 2021-06-29 Price Changed $69,000 Triad MLS
- 2021-06-22 Price Changed $75,000 Triad MLS
- 2021-06-15 Listed $80,000 Triad MLS
- 1983-11-01 Sold (Public Records) $25,000 Public Records
Property tax history
+2.3%/yrLatest (2025): $729 · -0.8% YoY. Source: county tax records.
Cash-flow waterfall
monthlySold comps — $/sqft
last 12 mo · ≤1 miLoading sold comps…