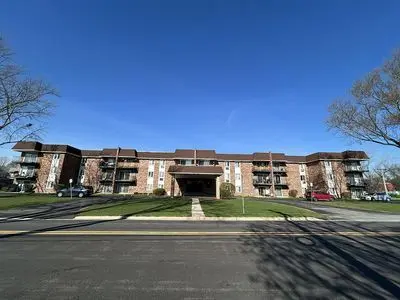
850 S Lorraine Rd · Wheaton, IL
Flood risk 1/10 · Minimal
- FEMA flood zone
- X (unshaded)
- Chance of flooding over 30 yrs
- 0.0%
- Est. flood insurance / yr
- $507 – $1,088
Fire risk 1/10 · Minimal
- Est. fire insurance / yr
- $804 – $1,492
Heat risk 3/10 · Minor
- Hot days now (above 105°F)
- 7 days/yr
- Hot days in 30 yrs
- 14 days/yr
Wind risk 2/10 · Minimal
- Chance of severe wind over 30 yrs
- —
Air-quality risk 3/10 · Minor
- Unhealthy air days now
- 4 days/yr
- Unhealthy air days in 30 yrs
- 4 days/yr
Risk factors via First Street. Map © Google.
Why this score? — see what drove the B grade
The composite is a weighted blend of 9 inputs, each scored 0–100. Each bar is that input's sub-score; the figure is the points it added to the 100-point composite (weight × sub-score).
- Cash flow +25.4/30.0
- ARV discount +15.0/15.0
- DSCR +8.4/10.0
- 1% rule +6.6/10.0
- Livability +4.3/5.0
- Schools +4.1/10.0
- Condition / age +3.8/5.0
- Rent growth +3.3/5.0
- Appreciation +0.0/10.0
$235,000
🖨 Deal sheet 📄 Offer letter ✓ Due diligence
Listing remarks
Highly desirable and rarely available, this 2-bedroom, 2-bath third-floor condo is one of the most sought-after units in the building. Quiet, spacious, and perfectly positioned right next to the elevator, it offers 1,126 square feet of beautifully updated living space and a large private balcony facing the parking area, combining convenience with privacy. The unit features two bedrooms with plenty of storage space, offering comfort and functionality for everyday living. Two full bathrooms & acirc; & euro; & rdquo; one with a walk-in shower and the other with a jacuzzi tub. Hardwood floors have just been professionally refinished, and the entire condo has been freshly painted and
Key facts
- Walk-in shower
- Granite countertops
- Brand-new dishwasher
Tags
Neighborhood map
What this means for you Summary
Snapshot
- This is a 2-bed/2.0-bath single-family listed at $235k. Condition is rated good.
Deal economics
- At list price, monthly cash flow is $538 ($6k/yr) — positive.
- The deal already cash-flows at list — no discount required.
- Meets the 1% rule at list price ($3k rent vs $235k).
- Cap rate 9.0% vs local median 3.7% in Wheaton — top-decile yield for the area; either an underpriced asset or a hidden risk that comps aren't pricing in. Stress-test before assuming the spread holds.
Location & tenants
- Location reads 86/100 on livability (#17 in IL, #374 nationally) — a professional / high-income tenant draw. Strengths: crime A+, commute A+, employment A+; Watch: amenities D+, health & safety D+, cost of living F.
- CUSD 200 (suburban): math 43% / reading 44% proficiency, ranked #78 of 620 in IL (top 13%) — families likely to look elsewhere, expect single-tenant / working-renter base with shorter leases.
- Market conditions: Rents rising (+3.4%/yr); 51 active listings in the ZIP; 25 comparable units currently listed for rent nearby; rentals leasing fast (median 8d on market — plan ~1-2 weeks tenant-placement turnaround); high-income renter base; 1,378 units permitted in DuPage County in 2024 (594 in 5+ unit buildings).
Forward outlook
- Local home prices are declining (-3.0%/yr); year-one equity from $2k of loan paydown is wiped out by about $7k of value loss. Plan a longer hold.
Negotiation context
- Only 1 days on market — expect competitive offers; lowballing is unlikely to land.
- 2 sale attempts with the ask held roughly flat each time — persistent listings suggest the price (not the market) is what's stuck; bring a comps-based counter.
Questions for the listing agent
- Built in 1974 — when were the roof, HVAC, electrical panel, plumbing, and water heater last replaced?
- Is there a deadline driving the sale (1031 exchange, divorce, estate, relocation)? That informs how much negotiation room exists.
- Schools are A-rated — typically a magnet for longer-tenancy family renters. What's the average tenant stay here, and is there a school-zone premium baked into asking?
- What's the average days-on-market for RENTAL listings here right now (not sales)? A rising rental-DOM trend means longer vacancies and softer asking-rent achievability than the comps imply.
- What's the recent tenant-quality profile in this submarket — average credit score on applications, eviction rate, late-payment / NSF rate, and stable-employment percentage? A property-management company in the area should have these aggregated.
- How much new for-sale + rental construction is in the pipeline within 1–3 miles? Heavy new supply typically softens prices + rents 12–24 months out; constrained supply supports both.
Investment metrics
- 1% rule
- 1.16% ✓
- Cap rate
- 9.04%
- Cash-on-cash
- 9.81%
- DSCR
- 1.44
- GRM
- 7.2
CMA / ARV
- ARV (on-the-fly)
- $385,092
- Comps found
- 12
Show comp detail 12 sales within ~0.75 mi
| Address | Dist | Beds/Ba | Sqft | Sold | Price | $/sf | Match |
|---|---|---|---|---|---|---|---|
| 1406 E Elm St | 0.28mi | 3/1.5 (+1) | 1,199 (+6%) | 1mo | $440,000 | $367 | 68 |
| 1020 Pershing Ave | 0.43mi | 3/2.0 (+1) | 1,194 (+6%) | 1mo | $416,500 | $349 | 64 |
| 110 Travers Ave | 0.57mi | 3/1.5 (+1) | 1,107 (-2%) | 3mo | $400,000 | $361 | 61 |
| 213 S Summit St | 0.45mi | 3/1.0 (+1) | 1,176 (+4%) | 2mo | $311,000 | $264 | 61 |
| 1217 E Evergreen St | 0.35mi | 3/1.5 (+1) | 1,096 (-3%) | 14mo | $385,000 | $351 | 60 |
| 1209 Fischer St | 0.67mi | 3/1.0 (+1) | 1,133 (+1%) | 0mo | $311,000 | $274 | 58 |
| 147 S Prospect St | 0.49mi | 3/2.0 (+1) | 1,170 (+4%) | 11mo | $400,000 | $342 | 57 |
| 418 S Williston St | 0.45mi | 2/1.0 | 1,231 (+9%) | 9mo | $365,000 | $297 | 52 |
| 1408 E Evergreen St | 0.24mi | 3/1.5 (+1) | 1,293 (+15%) | 10mo | $390,000 | $302 | 48 |
| 1221 E Illinois St | 0.43mi | 2/1.0 | 1,265 (+12%) | 15mo | $370,000 | $292 | 43 |
| 1010 E Elm St | 0.49mi | 3/1.5 (+1) | 988 (-12%) | 13mo | $350,000 | $354 | 39 |
| 230 Buena Vista Dr | 0.73mi | 3/2.0 (+1) | 1,247 (+11%) | 15mo | $385,000 | $309 | 31 |
Match score weights: distance 35% · size 25% · config 20% · recency 20%. Top-matched comps best support the ARV.
Projected returns pro-forma
-3.0% appreciation · 3.35% rent growth · sell at horizon
- IRR
- -1.1%
- Equity multiple
- 0.96×
- Total profit
- $-2,795
- Equity at exit
- $35,039
- IRR
- 8.9%
- Equity multiple
- 1.70×
- Total profit
- $45,868
- Equity at exit
- $20,319
Cash invested: $65,800 (down + closing). Projections, not guarantees.
Landlord ↔ Tenant lean methodology
- Overall (STATE)
- 43 Moderately Tenant-Leaning
- State Illinois
- 43 Moderately Tenant-Leaning · D+7
- County
- — inherits STATE
- City
- — inherits STATE
ZIP-level market 60189
- Rents YoY
- 3.4%
- Active inventory
- 51
- Price-to-rent
- 7.2×
Monthly cashflow live
- Estimated rent
- $2,737 high interval (Pro) →
- Mortgage (P&I)
- −$1,232
- Tax est. 1.5%
- −$294 /mo · $3,525/yr
- Insurance
- −$98
- HOA
- −$0
- Vacancy / Maint / Mgmt
- −$575
- Net cashflow
- $538
Break-even live
UW: 25.0% down · 7.5% · 30yr · 1.5% tax · 5.0% vac · 8.0% maint · 8.0% mgmt
Financing live
Cash to close
- Down payment
- $58,750
- Closing costs
- $7,050
- Reserves months
- —
- Total cash needed
- —
Loan-product check · same deal, 3 products live
Conventional
25% down · 7.5% · 30yr
- Down + closing
- —
- Monthly P&I
- —
- Monthly cashflow
- —
- DSCR
- —
- Eligible?
- —
Personal DTI + credit; lowest rate.
DSCR
20% down · 8.5% · 30yr
- Down + closing
- —
- Monthly P&I
- —
- Monthly cashflow
- —
- DSCR
- —
- Eligible?
- —
No personal income docs; deal must DSCR.
Hard money
10% down · 12.0% · 12mo
- Down + closing
- —
- Monthly P&I
- —
- Monthly cashflow
- —
- DSCR
- —
- Eligible?
- —
Short-term bridge; refi at stabilization.
Rent comps 25 comps
| Address | Beds | Baths | Sqft | Rent | $/sqft | DOM | Units | Dist |
|---|---|---|---|---|---|---|---|---|
| 1706 E Liberty Dr Wheaton, IL | 3.0 | 3.0 | 1320 | $3,200 | $2.42 | 22d | 1 | 0.43mi |
| 285 Hill Ave Unit 2 Glen Ellyn, IL | 3.0 | 1.0 | 1200 | $3,250 | $2.71 | 8d | 1 | 0.81mi |
| 357 Bloomfield Ln Glen Ellyn, IL | 2.0 | 2.0 | 1213 | $2,100 | $1.73 | 25d | 1 | 0.83mi |
| 357 Bloomfield Ln Glen Ellyn, IL | 2.0 | 2.0 | 1213 | $2,100 | $1.73 | 6d | 1 | 0.83mi |
| 21 N Main St Glen Ellyn, IL | 1.0–2.0 | 1.0 | 850 | $1,595 | $1.88 | 2d | 17 | 0.84mi |
| 385 Sandhurst Cir #4 Glen Ellyn, IL | 2.0 | 1.0 | 1213 | $2,200 | $1.81 | 1d | 1 | 0.93mi |
| 363 Pembroke Ln #3 Glen Ellyn, IL | 2.0 | 2.0 | 1213 | $1,875 | $1.55 | 25d | 1 | 0.95mi |
| 1750 22nd St Wheaton, IL | 1.0–3.0 | 1.0–2.0 | 873 | $1,687 | $1.93 | 2d | 6 | 1.03mi |
| 250 S Naperville Rd Wheaton, IL | 3.0 | 1.0–2.0 | 1061 | $4,073 | $3.84 | 24d | 16 | 1.12mi |
| 250 S Naperville Rd Wheaton, IL | 3.0 | 1.0–2.0 | 1061 | $4,063 | $3.83 | 1d | 12 | 1.12mi |
| 953 Park Plz Unit 4 Glen Ellyn, IL | 2.0 | 1.0 | 850 | $1,790 | $2.11 | 8d | 1 | 1.13mi |
| 470 Fawell Blvd #218 Glen Ellyn, IL | 2.0 | 2.0 | 993 | $2,150 | $2.17 | 25d | 1 | 1.15mi |
| 1607 Thames Ct Unit D Wheaton, IL | 2.0 | 1.0 | 1056 | $2,150 | $2.04 | 18d | 1 | 1.19mi |
| 121 N Cross St Wheaton, IL | 2.0 | 1.0–2.0 | 831 | $2,887 | $3.47 | 2d | 18 | 1.22mi |
| 1756 Plymouth Ct Unit B Wheaton, IL | 3.0 | 2.0 | 1311 | $2,600 | $1.98 | 3d | 1 | 1.27mi |
| 437 Duane St Unit 406 Glen Ellyn, IL | 2.0 | 2.0 | 1360 | $3,720 | $2.74 | 25d | 1 | 1.34mi |
| 437 Duane St #208 Glen Ellyn, IL | 2.0 | 2.0 | 1360 | $3,350 | $2.46 | 25d | 1 | 1.34mi |
| 437 Duane St Unit 309 Glen Ellyn, IL | 2.0 | 2.0 | 1360 | $3,648 | $2.68 | 8d | 1 | 1.34mi |
| 437 Duane St Unit 203 Glen Ellyn, IL | 2.0 | 2.0 | 1360 | $3,342 | $2.46 | 25d | 1 | 1.34mi |
| 400 N Main St Glen Ellyn, IL | 1.0 | 1.0 | 773 | $2,405 | $3.11 | 25d | 1 | 1.40mi |
| 400 N Main St Glen Ellyn, IL | 2.0 | 1.0–2.0 | 1165 | $5,800 | $4.98 | 6d | 1 | 1.40mi |
| 532 Hillside Ave Unit BW Glen Ellyn, IL | 1.0 | 1.0 | 1050 | $1,450 | $1.38 | 18d | 1 | 1.43mi |
| 302 W Liberty Dr Wheaton, IL | 2.0 | 2.0 | 1194 | $2,885 | $2.42 | 2d | 3 | 1.45mi |
| 440 N Main St Unit 509 Glen Ellyn, IL | 2.0 | 1.0 | 1126 | $2,295 | $2.04 | 15d | 1 | 1.45mi |
| 464 Glenwood Ave Glen Ellyn, IL | 2.0 | 1.0–2.0 | 1071 | $4,586 | $4.28 | 3d | 4 | 1.48mi |
Listing history 5 events
-
2026-05-26$235,000 Active
-
2026-04-09historical $2,000
-
2025-08-14price $2,000
-
2025-06-10price $2,100
-
2025-03-14$2,200
ⓘ Source: listings_history table (triggers on properties + properties_extension) + one-shot
backfill from property_details.listing_events for pre-trigger history.
Climate risk First Street
- Flood 1/10 Low FEMA zone X (unshaded) · 0% chance over 30 yrs
- Wildfire 1/10 Low
- Heat 3/10 Moderate 7 d/yr ≥105°F today · 14 d/yr by 30 yrs out
- Wind 2/10 Low
- Air quality 3/10 Moderate 4 unhealthy d/yr today · 4 by 30 yrs out
Nearby sold comps map
Loading sold comps map…
Walkable amenities ~0.75 mi
Loading nearby amenities…
Taxation est. · year 1
- Rental income
- $32,844
- − Mortgage interest
- −$13,164
- − Property taxes
- −$3,525
- − Insurance
- −$1,175
- − Repairs & maintenance
- −$2,627
- − Management
- −$2,627
- − Depreciation
- −$6,836
- Taxable income
- $2,889
- Est. tax owed @ 24.0%
- −$693
- After-tax cash flow
- $5,765/yr
For passive investors: Depreciation is non-cash, so a rental often shows a tax loss while cash-flowing — sheltering income. Rental losses are passive: they offset passive income freely, and up to $25,000/yr can offset ordinary (W-2) income if you actively participate and your MAGI is under $100k (phasing out to $0 by $150k); unused losses carry forward. On sale, claimed depreciation is recaptured at up to 25%, and gains may owe capital-gains tax (a 1031 exchange can defer both). Figures are a year-1 estimate at your 24.0% rate — not tax advice; consult a CPA.
Condition & rehab AI · 1 photo
This 2-bedroom, 2-bath condo is in excellent condition with recent updates, making it a highly desirable and move-in-ready property.
Value-add opportunities
- Both Landscaping — Enhances curb appeal and adds value
- Both New window treatments — Improves aesthetics and energy efficiency
- Both New flooring in bathrooms — Freshens the space and adds value
Renovation cost estimate screening
Value-add ROI direction
- Both Landscaping — Enhances curb appeal and adds value ↑
- Both New window treatments — Improves aesthetics and energy efficiency ↑
- Both New flooring in bathrooms — Freshens the space and adds value ↑
ⓘ Cost ranges are severity-bucket heuristics (US national rule-of-thumb). Get contractor quotes + a written scope before underwriting a rehab budget.
Schools (NCES district)
- District
- CUSD 200
- NCES district ID
- 1742180
- Math proficiency
- 43% ▼ -6.00%
- Reading proficiency
- 44% ▼ -8.00%
- Median HH income
- $85,077
- Composite
- 40.75/100
- National rank
- #3653
- State rank
- #78 of 620 in IL
Livability — Wheaton
- Score
- 86/100
- State rank
- #17
- US rank
- #374
Category grades
Schools grade is shown separately in the Schools card above.
Census & demographics
- Census place
- Wheaton, IL
- County
- DuPage County · 904,569 people
- City population
- 59,857
- Metro
- Chicago-Naperville-Elgin, IL-IN-WI
- Population (ZIP)
- 31,042
- Household income
- $128,878
- Rent vs Own
- Severe rent burden
- 484.0
Population outlook (DuPage County) Hauer SSP2
- Today (2025)
- 960,187 people
- By 2030
- 965,850 · +0.6%
- By 2040
- 965,812 · +0.6%
- By 2050
- 954,890 · -0.6%
- By 2075
- 910,185 · -5.2%
- By 2100
- 816,255 · -15.0%
Race, ethnicity, and origin ACS 2023
- Neighborhood character
- Predominantly White (80%)
- Race & ethnicity
- White 80% Two or more races 8% Hispanic / Latino 7% Asian 5% Black 3%
- Hispanic origin (detail)
- Mexican 5%
- Common ancestry
- Romanian 10% Italian 3% Slovak 2%
- Foreign-born
- 11% · Canada, Philippines, China
- Languages at home
- 86% English-only · Spanish 4% Other Indo-European 3% Russian/Polish/Slavic 2%
Political lean MEDSL · DuPage
- 2024 margin
- D (+13.3) · D 55.9% · R 42.5% · Other 1.6%
- 2008→2024 swing
- +2.5pp toward D · 2008: 10.8pp · 2024: 13.3pp
- All cycles
- 2024: D+13.3 2020: D+18.1 2016: D+14.1 2012: D+1.0 2008: D+10.8
Not yet ingested
- Civics
- —
Market trends
- HPI YoY
- ▼ -254.37%
- Current HPI
- 212.2464
- Rent YoY
- ▲ 3.35%
- Metro
- Chicago-Naperville-Elgin, IL-IN-WI
- State GDP YoY
- ▲ 1.59%
- F500 in state
- 60
Industry mix (Fortune 500 HQ in IL)
| Industry | F500 HQs | Revenue |
|---|---|---|
| Insurance | 4 | $201B |
|
||
| Consumer Goods | 4 | $87B |
|
||
| Industrial Machinery | 3 | $64B |
|
||
| Healthcare | 2 | $55B |
|
||
| Retail / Pharmacy | 1 | $148B |
|
||
| Agriculture / Food | 1 | $86B |
|
||
Price history
+10581.8% since first listed5 events — show timeline
- 2026-05-26 Listed $235,000 FSBO.com
- 2026-04-09 Rental Removed $2,000 REDFIN
- 2025-08-14 Price Changed $2,000 REDFIN
- 2025-06-10 Price Changed $2,100 REDFIN
- 2025-03-14 Listed for Rent $2,200 REDFIN
Cash-flow waterfall
monthlySold comps — $/sqft
last 12 mo · ≤1 miLoading sold comps…