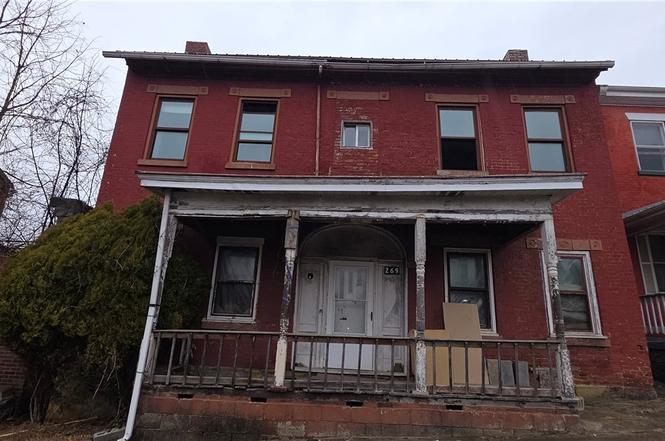
269 Union St · Mount Pleasant, OH
Flood risk 1/10 · Minimal
- FEMA flood zone
- X (unshaded)
- Chance of flooding over 30 yrs
- 0.0%
- Est. flood insurance / yr
- $473 – $860
Fire risk 2/10 · Minimal
- Est. fire insurance / yr
- $713 – $1,323
Heat risk 3/10 · Minor
- Hot days now (above 96°F)
- 7 days/yr
- Hot days in 30 yrs
- 18 days/yr
Wind risk 1/10 · Minimal
- Chance of severe wind over 30 yrs
- —
Air-quality risk 2/10 · Minimal
- Unhealthy air days now
- 0 days/yr
- Unhealthy air days in 30 yrs
- 1 days/yr
Risk factors via First Street. Map © Google.
Why this score? — see what drove the D+ grade
The composite is a weighted blend of 9 inputs, each scored 0–100. Each bar is that input's sub-score; the figure is the points it added to the 100-point composite (weight × sub-score).
- Cash flow +15.0/30.0
- ARV discount +7.5/15.0
- 1% rule +5.0/10.0
- DSCR +5.0/10.0
- Appreciation +5.0/10.0
- Schools +4.1/10.0
- Livability +3.1/5.0
- Rent growth +2.5/5.0
- Condition / age +2.5/5.0
$20,000
🖨 Deal sheet (PDF) 📄 Offer letter ✓ Due diligence
Listing remarks
Step into timeless character and craftsmanship with this early 1800s brick home offering over 2,400 square feet of living space. Rich in history, this property showcases classic brickwork, tall ceilings, and generously sized rooms that reflect the charm of a bygone era. Inside, you’ll find spacious living and dining areas perfect for gathering, large windows that fill the home with natural light, and period details throughout. The layout offers flexibility for modern living while preserving the integrity and character that make historic homes so special. Whether you’re drawn to the solid construction, the unique craftsmanship, or the opportunity to own a piece of history, this h
Key facts
- Large windows
- Tall ceilings
- Period details
Tags
Property features AI
Exterior
- Parking: Off-street and on-street parking with alley access
- Utilities: Public water; Public sewer
- Home design: Two-story brick home; Metal roof
- Construction: Brick construction; Metal roof
- Exterior features: Alley access; Off-street parking; On-street parking
Interior
- Bedrooms: Two main-level bedrooms
- Bathrooms: Two full bathrooms; One main-level bathroom
- Heating & cooling: Forced air heating; Oil heating
- Interior features: Partially finished basement; Two fireplaces
Neighborhood map
What this means for you Summary
Snapshot
- This is a 5-bed/1.0-bath single-family listed at $20k.
Deal economics
- At list price, monthly cash flow is $925 ($11k/yr) — positive.
- The deal already cash-flows at list — no discount required.
- Meets the 1% rule at list price ($1k rent vs $20k).
- Recommended offer: $18k (12.0% below list) — sets the bar for market timing.
Location & tenants
- Location reads 62/100 on livability (#907 in OH) — a middle-class / working-renter tenant base. Strengths: cost of living A+, housing A+; Watch: crime C-, employment D+, amenities F.
- Buckeye Local (rural): math 44% / reading 53% proficiency, ranked #471 of 656 in OH (top 72%) — families likely to look elsewhere, expect single-tenant / working-renter base with shorter leases.
- Zoned schools: Buckeye West Elementary School (math 62% / reading 52%, grade C+, #729 of 1,584 statewide, top 48%, 217 students, 62% FRL); Buckeye Local Junior High (math 33% / reading 51%, grade D-, #499 of 654 statewide, top 77%, 209 students, 56% FRL); Buckeye Local High School (388 students, 54% FRL).
- Market conditions: 3 active listings in the ZIP; lower-income renter base — watch delinquency; 2 units permitted in Jefferson County in 2024 (0 in 5+ unit buildings).
- This rent runs 42% of the median local income ($38k/yr) — at the standard rent-burdened threshold; future hikes will face affordability resistance.
Forward outlook
- In year one you build about $738 of equity ($138 loan paydown + $600 appreciation (3.0% local appreciation)).
- Jefferson County population projected at -19% by 2050 — secular population decline; favor cash flow + early exit over multi-decade hold.
- At projected returns (3.0% appreciation + 3.0% rent growth), your $6k cash investment doubles in ~1 year — after that, you're playing with house money.
Negotiation context
- It's been on market 123 days — a 12% lower offer ($18k) is reasonable based on typical stale-listing flexibility.
Risks & watch-outs
- Watch-outs: built in 1813 — expect roof / HVAC / electrical / plumbing capex.
Questions for the listing agent
- It's been on market 123 days. Have you received any prior offers? Is the seller open to a 12% concession, seller financing, or rate buy-down credit?
- Built in 1813 — when were the roof, HVAC, electrical panel, plumbing, and water heater last replaced?
- Why hasn't it sold? Are there any deal-killer items the seller is aware of (foundation, flood, title, zoning, code violations)?
- Is there a deadline driving the sale (1031 exchange, divorce, estate, relocation)? That informs how much negotiation room exists.
- Schools are F-rated, which usually means shorter tenancies and higher turnover. Who's the typical renter profile here, and what's been the actual vacancy rate?
- The area grade is low — what's the realistic commute time and amenity access for the typical tenant pool here? Any planned neighborhood developments (good or bad) we should know about?
- What's the average days-on-market for RENTAL listings here right now (not sales)? A rising rental-DOM trend means longer vacancies and softer asking-rent achievability than the comps imply.
- What's the recent tenant-quality profile in this submarket — average credit score on applications, eviction rate, late-payment / NSF rate, and stable-employment percentage? A property-management company in the area should have these aggregated.
- How much new for-sale + rental construction is in the pipeline within 1–3 miles? Heavy new supply typically softens prices + rents 12–24 months out; constrained supply supports both.
Investment metrics
- 1% rule
- 6.73% ✓
- Cap rate
- 61.80%
- Cash-on-cash
- 198.24%
- DSCR
- 9.82
- GRM
- 1.2
CMA / ARV
No comps found within radius.
Projected returns pro-forma
3.0% appreciation · 3.0% rent growth · sell at horizon
- IRR
- —
- Equity multiple
- 11.96×
- Total profit
- $61,351
- Equity at exit
- $8,993
- IRR
- —
- Equity multiple
- 25.26×
- Total profit
- $135,859
- Equity at exit
- $13,859
Cash invested: $5,600 (down + closing). Projections, not guarantees.
Landlord ↔ Tenant lean methodology
- Overall (STATE)
- 73 Landlord-Friendly
- State Ohio
- 73 Landlord-Friendly · R+6
- County
- — inherits STATE
- City
- — inherits STATE
ZIP-level market 43939
- Active inventory
- 3
- Price-to-rent
- 1.2×
Monthly cashflow live
- Estimated rent
- $1,346 medium interval (Pro) →
- Mortgage (P&I)
- −$105
- Tax est. 1.5%
- −$25 /mo · $300/yr
- Insurance
- −$8
- HOA
- −$0
- Vacancy / Maint / Mgmt
- −$283
- Net cashflow
- $925
Break-even live
Sensitivity live
| Price | -10% $939 | -5% $932 | +0% $925 | +5% $918 | +10% $911 |
|---|---|---|---|---|---|
| Rent | -10% $819 | -5% $872 | +0% $925 | +5% $978 | +10% $1,031 |
| Rate | -1.0pp $935 | -0.5pp $930 | base $925 | +0.5pp $920 | +1.0pp $915 |
UW: 25.0% down · 7.5% · 30yr · 1.5% tax · 5.0% vac · 8.0% maint · 8.0% mgmt
Financing live
Cash to close
- Down payment
- $5,000
- Closing costs
- $600
- Reserves months
- —
- Total cash needed
- —
Loan-product check · same deal, 3 products live
Conventional
25% down · 7.5% · 30yr
- Down + closing
- —
- Monthly P&I
- —
- Monthly cashflow
- —
- DSCR
- —
- Eligible?
- —
Personal DTI + credit; lowest rate.
DSCR
20% down · 8.5% · 30yr
- Down + closing
- —
- Monthly P&I
- —
- Monthly cashflow
- —
- DSCR
- —
- Eligible?
- —
No personal income docs; deal must DSCR.
Hard money
10% down · 12.0% · 12mo
- Down + closing
- —
- Monthly P&I
- —
- Monthly cashflow
- —
- DSCR
- —
- Eligible?
- —
Short-term bridge; refi at stabilization.
Listing history 17 events
-
2026-06-21days on market $20,000 Active 123 DOM
-
2026-06-21days on market $20,000 Active 122 DOM
-
2026-06-18days on market $20,000 Active 120 DOM
-
2026-06-17days on market $20,000 Active 119 DOM
-
2026-06-16days on market $20,000 Active 118 DOM
-
2026-06-15days on market $20,000 Active 117 DOM
-
2026-06-13days on market $20,000 Active 115 DOM
-
2026-06-12days on market $20,000 Active 114 DOM
-
2026-06-09days on market $20,000 Active 111 DOM
-
2026-06-08days on market $20,000 Active 110 DOM
-
2026-06-07days on market $20,000 Active 109 DOM
-
2026-06-07days on market $20,000 Active 108 DOM
-
2026-06-04days on market $20,000 Active 105 DOM
-
2026-06-02days on market $20,000 Active 104 DOM
-
2026-06-01days on market $20,000 Active 103 DOM
-
2026-05-31remarks 687-char remark
-
2026-05-31$20,000 Active 102 DOM
ⓘ Source: listings_history table (triggers on properties + properties_extension) + one-shot
backfill from property_details.listing_events for pre-trigger history.
Climate risk First Street
- Flood 1/10 Low FEMA zone X (unshaded) · 0% chance over 30 yrs
- Wildfire 2/10 Low
- Heat 3/10 Moderate 7 d/yr ≥96°F today · 18 d/yr by 30 yrs out
- Wind 1/10 Low
- Air quality 2/10 Low 0 unhealthy d/yr today · 1 by 30 yrs out
Nearby sold comps map
Loading sold comps map…
Walkable amenities ~0.75 mi
Loading nearby amenities…
Taxation est. · year 1
- Rental income
- $16,152
- − Mortgage interest
- −$1,120
- − Property taxes
- −$300
- − Insurance
- −$100
- − Repairs & maintenance
- −$1,292
- − Management
- −$1,292
- − Depreciation
- −$582
- Taxable income
- $11,466
- Est. tax owed @ 24.0%
- −$2,752
- After-tax cash flow
- $8,350/yr
For passive investors: Depreciation is non-cash, so a rental often shows a tax loss while cash-flowing — sheltering income. Rental losses are passive: they offset passive income freely, and up to $25,000/yr can offset ordinary (W-2) income if you actively participate and your MAGI is under $100k (phasing out to $0 by $150k); unused losses carry forward. On sale, claimed depreciation is recaptured at up to 25%, and gains may owe capital-gains tax (a 1031 exchange can defer both). Figures are a year-1 estimate at your 24.0% rate — not tax advice; consult a CPA.
Schools (NCES district)
- District
- Buckeye Local
- NCES district ID
- 3904778
- Math proficiency
- 44% ▼ -18.00%
- Reading proficiency
- 53% ▼ -10.00%
- Median HH income
- $41,332
- Composite
- 40.68/100
- National rank
- #3673
- State rank
- #471 of 656 in OH
Livability — Mount Pleasant
- Score
- 62/100
- State rank
- #907
- US rank
- #17146
Category grades
Schools grade is shown separately in the Schools card above.
Census & demographics
- Census place
- Mount Pleasant, OH
- County
- Jefferson · 64,369 people
- Metro
- Weirton-Steubenville, WV-OH
- Population (ZIP)
- 313
- Household income
- $38,500
- Rent vs Own
- Severe rent burden
- 33.3
Population outlook (Jefferson County) Hauer SSP2
- Today (2025)
- 63,481 people
- By 2030
- 61,067 · -3.8%
- By 2040
- 55,860 · -12.0%
- By 2050
- 51,236 · -19.3%
- By 2075
- 41,804 · -34.1%
- By 2100
- 32,344 · -49.0%
Race, ethnicity, and origin ACS 2023
- Neighborhood character
- Predominantly White (96%)
- Race & ethnicity
- White 96% Two or more races 3%
- Common ancestry
- Romanian 11% Slovak 4% Serbian 3%
- Languages at home
- 98% English-only · Spanish 2%
Political lean MEDSL · Jefferson
- 2024 margin
- Solid R (+43.9) · D 27.5% · R 71.4% · Other 1.1%
- 2008→2024 swing
- -44.1pp toward R · 2008: 0.2pp · 2024: -43.9pp
- All cycles
- 2024: R+43.9 2020: R+38.4 2016: R+35.7 2012: R+5.5 2008: D+0.2
Not yet ingested
- Civics
- —
Market trends
- HPI YoY
- —
- Current HPI
- —
- Rent YoY
- —
- Metro
- —
- State GDP YoY
- ▲ 1.98%
- F500 in state
- 48
Industry mix (Fortune 500 HQ in OH)
| Industry | F500 HQs | Revenue |
|---|---|---|
| Insurance | 3 | $145B |
|
||
| Industrial Machinery | 3 | $49B |
|
||
| Financial Services | 3 | $24B |
|
||
| Consumer Goods | 2 | $93B |
|
||
| Aerospace / Defense | 2 | $47B |
|
||
| Utilities | 2 | $33B |
|
||
Price history
1 event — show timeline
- 2026-02-18 Listed $20,000 MLSNOW
Property tax history
+9.7%/yrLatest (2025): $1,186 · +27.2% YoY. Source: county tax records.
Cash-flow waterfall
monthlySold comps — $/sqft
last 12 mo · ≤1 miLoading sold comps…