 Duplex
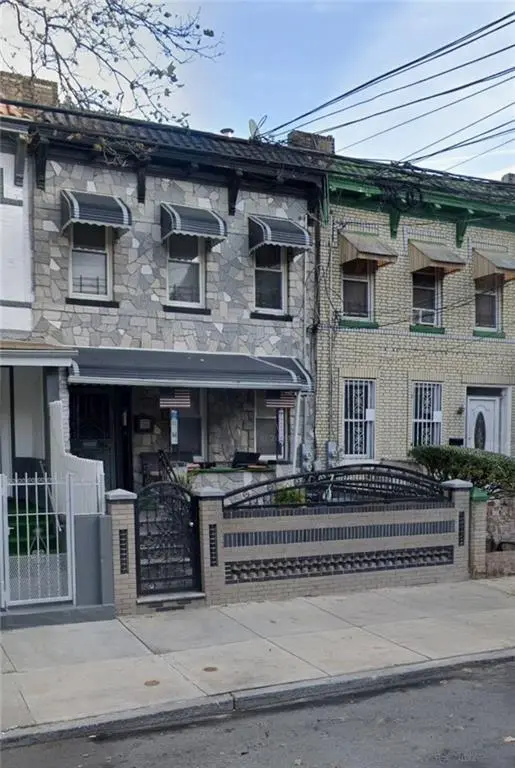
615 Chester St · New York, NY
Flood risk 6/10 · Moderate
- FEMA flood zone
- X (unshaded)
- Chance of flooding over 30 yrs
- 0.73%
- Est. flood insurance / yr
- $507 – $1,088
Fire risk 1/10 · Minimal
- Est. fire insurance / yr
- $691 – $1,283
Heat risk 6/10 · Moderate
- Hot days now (above 99°F)
- 7 days/yr
- Hot days in 30 yrs
- 15 days/yr
Wind risk 6/10 · Moderate
- Chance of severe wind over 30 yrs
- 65.0%
Air-quality risk 5/10 · Moderate
- Unhealthy air days now
- 6 days/yr
- Unhealthy air days in 30 yrs
- 8 days/yr
Risk factors via First Street. Map © Google.
Why this score? — see what drove the C+ grade
The composite is a weighted blend of 9 inputs, each scored 0–100. Each bar is that input's sub-score; the figure is the points it added to the 100-point composite (weight × sub-score).
- Cash flow +24.8/30.0
- ARV discount +12.2/15.0
- DSCR +8.1/10.0
- 1% rule +5.2/10.0
- Schools +5.0/10.0
- Livability +3.8/5.0
- Condition / age +2.5/5.0
- Rent growth +2.4/5.0
- Appreciation +0.0/10.0
$700,000
🖨 Deal sheet 📄 Offer letter ✓ Due diligence
Multi-family units
County records classify this as Multi-Family (2-4 Unit). Listing-text estimate: 2 units. confirmed
Listing remarks
This 2-family home in the heart of Brownsville, Brooklyn offers a fantastic opportunity for buyers looking to customize and add value. The property is being sold in “as is” condition and is in need of some TLC, making it ideal for you. Conveniently located near restaurants, shopping, hospitals, and public transportation, this home combines potential with a prime location. Call today to schedule a private tour.
Key facts
- 2-family home
- Heart of brownsville
- Prime location
Tags
Property features AI
Finance
- Other: Zoning: R6
- Financial info: Income reported from rent: $44,400; Two-unit property; Unit 1 is owner-occupied with projected rent of $2,000 (available March 30, 2026); Unit 2 is month-to-month with current rent $1,700 and projected rent $2,000 (available March 30, 2026); Financing options noted: bank mortgage or cash
Exterior
- Parking: No designated parking
- Utilities: Electric: 220V, circuit breakers; Hot water: gas; Heating fuel: gas; Sewer/water not specified
- Home design: Attached residential building; Flat roof; Facing direction not specified
- Construction: Brick and stone exterior; Slab concrete foundation
- Exterior features: Front yard; Back yard
Interior
- Kitchen: Includes refrigerator and stove
- Bedrooms: Three bedrooms on level 1; Three bedrooms on level 2
- Flooring: Hardwood floors; Tile floors
- Bathrooms: One full bath on level 1; One full bath on level 2; Two full baths total
- Heating & cooling: Steam/radiator heating; Hot water fueled by gas; Electrical service: 220V with circuit breakers
- Interior features: Finished full basement; Refrigerator; Stove
- Laundry & utility: No central AC units reported
Neighborhood map
What this means for you Summary
Snapshot
- This is a 2 × 3-bed/1.0-bath units multifamily listed at $700k.
Deal economics
- At list price, monthly cash flow is $1k ($18k/yr) — positive. Per door: $744/mo.
- The deal already cash-flows at list — no discount required.
- Meets the 1% rule at list price ($7k rent vs $700k).
- Recommended offer: $658k (6.0% below list) — sets the bar for market timing.
- Cap rate 8.8% vs local median 2.6% in New York — top-decile yield for the area; either an underpriced asset or a hidden risk that comps aren't pricing in. Stress-test before assuming the spread holds.
Location & tenants
- Location reads 75/100 on livability (#268 in NY, #4,188 nationally) — a middle-class / working-renter tenant base. Strengths: amenities A+, commute A+, health & safety A; Watch: crime F, cost of living F.
- Market conditions: Rents soft (-0.6%/yr); 65 active listings in the ZIP; lower-income renter base — watch delinquency; 10,063 units permitted in Kings County in 2024 (9,789 in 5+ unit buildings).
- At $7,112/mo this rent would consume 206% of the median local household income ($41k/yr) (locally 9035% of renters already pay >50% of income on rent) — very limited rent-growth headroom before tenants either downsize or default.
Forward outlook
- Local home prices are declining (-3.0%/yr); year-one equity from $5k of loan paydown is wiped out by about $21k of value loss. Plan a longer hold.
- Kings County population projected at +13% by 2050 — modest demand growth; plan on rents tracking national, not racing it.
Negotiation context
- It's been on market 80 days — a 6% lower offer ($658k) is reasonable based on typical stale-listing flexibility.
- Current owner paid $135k; list at $700k implies a 419% gain — meaningful room to come down on a strong offer.
Risks & watch-outs
- Watch-outs: built in 1930 — expect roof / HVAC / electrical / plumbing capex.
- Climate carrying-cost: major flood risk; major wind risk, 65% chance of damaging wind over 30y; extreme-heat days projected 7→15/yr by 2055 (HVAC capex compounding) — expect insurance premiums to compound above CPI over the hold.
Questions for the listing agent
- It's been on market 80 days. Have you received any prior offers? Is the seller open to a 6% concession, seller financing, or rate buy-down credit?
- Can we see the unit-by-unit rent roll, current vacancy, and any below-market leases? What's the average tenancy length?
- What capital expenditures (roof, boiler, parking lot, exteriors) have been made in the last 5 years, and what's planned in the next 2?
- Built in 1930 — when were the roof, HVAC, electrical panel, plumbing, and water heater last replaced?
- Why hasn't it sold? Are there any deal-killer items the seller is aware of (foundation, flood, title, zoning, code violations)?
- Is there a deadline driving the sale (1031 exchange, divorce, estate, relocation)? That informs how much negotiation room exists.
- Schools are B-rated — typically a magnet for longer-tenancy family renters. What's the average tenant stay here, and is there a school-zone premium baked into asking?
- Crime grade is F in this area — have there been break-ins, vandalism, or insurance claims at this property in the last 3 years? What carrier currently insures it and at what premium?
- What's the average days-on-market for RENTAL listings here right now (not sales)? A rising rental-DOM trend means longer vacancies and softer asking-rent achievability than the comps imply.
- What's the recent tenant-quality profile in this submarket — average credit score on applications, eviction rate, late-payment / NSF rate, and stable-employment percentage? A property-management company in the area should have these aggregated.
- How much new apartment / multifamily construction is in the pipeline within 1–3 miles? Heavy new supply (>2% of stock underway) typically softens rents 12–24 months out; light construction supports rent growth.
Investment metrics
- 1% rule
- 1.02% ✓
- Cap rate
- 8.84%
- Cash-on-cash
- 9.11%
- DSCR
- 1.41
- GRM
- 8.2
CMA / ARV
- ARV (on-the-fly)
- $780,780
- Comps found
- 5
Show comp detail 5 sales within ~0.75 mi
| Address | Dist | Beds/Ba | Sqft | Sold | Price | $/sf | Match |
|---|---|---|---|---|---|---|---|
| 468 Herzl St | 0.28mi | 5/2.0 (-1) | 2,080 (+14%) | 8mo | $500,000 | $240 | 52 |
| 870 E 93rd St | 0.64mi | 6/3.0 | 1,980 (+9%) | 2mo | $849,000 | $429 | 50 |
| 705 E 93rd St | 0.48mi | 7/4.0 (+1) | 2,000 (+10%) | 12mo | $873,000 | $437 | 38 |
| 641 Snediker Ave | 0.55mi | 6/3.0 | 2,052 (+13%) | 21mo | $802,000 | $391 | 31 |
| 2029 Strauss St | 0.65mi | 7/5.0 (+1) | 1,624 (-11%) | 7mo | $990,000 | $610 | 29 |
Match score weights: distance 35% · size 25% · config 20% · recency 20%. Top-matched comps best support the ARV.
Projected returns pro-forma
-3.0% appreciation · 0.0% rent growth · sell at horizon
- IRR
- -5.6%
- Equity multiple
- 0.80×
- Total profit
- $-39,835
- Equity at exit
- $104,372
- IRR
- 0.5%
- Equity multiple
- 1.03×
- Total profit
- $5,459
- Equity at exit
- $60,523
Cash invested: $196,000 (down + closing). Projections, not guarantees.
Landlord ↔ Tenant lean methodology
- Overall (CITY)
- 0 Strongly Tenant-Friendly
- State New York
- 15 Strongly Tenant-Friendly · D+10
- County
- — inherits STATE
- City New York
- 0 Strongly Tenant-Friendly · D+34
ZIP-level market 11212
- Home prices YoY
- -34.3%
- Rents YoY
- -0.6%
- Active inventory
- 65
- Price-to-rent
- 16.4×
Monthly cashflow live
- Estimated rent
- $7,112 medium interval (Pro) →
- Mortgage (P&I)
- −$3,671
- Tax from tax record
- −$168 /mo · $2,017/yr
- Insurance
- −$292
- HOA
- −$0
- Vacancy / Maint / Mgmt
- −$1,494
- Net cashflow
- $1,488
Break-even live
2-unit breakdown (identical units grouped — click to expand)
| Units | Beds | Baths | Est. rent |
|---|---|---|---|
| 2× units | 3 | 1 | $7,112 |
| #1 | 3 | 1 | $3,556 |
| #2 | 3 | 1 | $3,556 |
| Total (2 units) | $7,112 | ||
UW: 25.0% down · 7.5% · 30yr · 1.5% tax · 5.0% vac · 8.0% maint · 8.0% mgmt
Financing live
Cash to close
- Down payment
- $175,000
- Closing costs
- $21,000
- Reserves months
- —
- Total cash needed
- —
Loan-product check · same deal, 3 products live
Conventional
25% down · 7.5% · 30yr
- Down + closing
- —
- Monthly P&I
- —
- Monthly cashflow
- —
- DSCR
- —
- Eligible?
- —
Personal DTI + credit; lowest rate.
DSCR
20% down · 8.5% · 30yr
- Down + closing
- —
- Monthly P&I
- —
- Monthly cashflow
- —
- DSCR
- —
- Eligible?
- —
No personal income docs; deal must DSCR.
Hard money
10% down · 12.0% · 12mo
- Down + closing
- —
- Monthly P&I
- —
- Monthly cashflow
- —
- DSCR
- —
- Eligible?
- —
Short-term bridge; refi at stabilization.
Listing history 13 events
-
2026-06-18days on market $700,000 Active 80 DOM
-
2026-06-17days on market $700,000 Active 79 DOM
-
2026-06-15days on market $700,000 Active 77 DOM
-
2026-06-13days on market $700,000 Active 75 DOM
-
2026-06-10days on market $700,000 Active 71 DOM
-
2026-06-08days on market $700,000 Active 70 DOM
-
2026-06-08days on market $700,000 Active 69 DOM
-
2026-06-04days on market $700,000 Active 66 DOM
-
2026-06-03days on market $700,000 Active 65 DOM
-
2026-06-01days on market $700,000 Active 63 DOM
-
2026-05-31days on market $700,000 Active 62 DOM
-
2026-03-30$700,000 Active
-
1999-04-28soldstatus $135,000
ⓘ Source: listings_history table (triggers on properties + properties_extension) + one-shot
backfill from property_details.listing_events for pre-trigger history.
Tax reassessment forecast NY · Partial reset (capped growth)
- Current annual tax
- $2,017 · $168/mo
- Projected year-2 tax
- $6,923 · $577/mo
- Expected delta
- +$4,907/yr (+$409/mo · 243.3%)
ⓘ Screening estimate from a state-policy table — verify with the county assessor before closing.
Climate risk First Street
- Flood 6/10 Major FEMA zone X (unshaded) · 73% chance over 30 yrs
- Wildfire 1/10 Low
- Heat 6/10 Major 7 d/yr ≥99°F today · 15 d/yr by 30 yrs out
- Wind 6/10 Major 65% chance of damaging wind over 30 yrs
- Air quality 5/10 Major 6 unhealthy d/yr today · 8 by 30 yrs out
Nearby sold comps map
Loading sold comps map…
Walkable amenities ~0.75 mi
Loading nearby amenities…
Taxation est. · year 1
- Rental income
- $85,344
- − Mortgage interest
- −$39,211
- − Property taxes
- −$2,017
- − Insurance
- −$3,500
- − Repairs & maintenance
- −$6,828
- − Management
- −$6,828
- − Depreciation
- −$20,364
- Taxable income
- $6,598
- Est. tax owed @ 24.0%
- −$1,583
- After-tax cash flow
- $16,271/yr
For passive investors: Depreciation is non-cash, so a rental often shows a tax loss while cash-flowing — sheltering income. Rental losses are passive: they offset passive income freely, and up to $25,000/yr can offset ordinary (W-2) income if you actively participate and your MAGI is under $100k (phasing out to $0 by $150k); unused losses carry forward. On sale, claimed depreciation is recaptured at up to 25%, and gains may owe capital-gains tax (a 1031 exchange can defer both). Figures are a year-1 estimate at your 24.0% rate — not tax advice; consult a CPA.
Schools (NCES district)
No district data.
Livability — New York
- Score
- 75/100
- State rank
- #268
- US rank
- #4188
Category grades
Schools grade is shown separately in the Schools card above.
Census & demographics
- Census place
- New York, NY
- County
- Kings County · 2,614,986 people
- City population
- 7,731,280
- Metro
- New York-Newark-Jersey City, NY-NJ-PA
- Population (ZIP)
- 89,020
- Household income
- $41,355
- Rent vs Own
- Severe rent burden
- 9035.0
Population outlook (Kings County) Hauer SSP2
- Today (2025)
- 2,847,441 people
- By 2030
- 2,937,006 · +3.1%
- By 2040
- 3,095,491 · +8.7%
- By 2050
- 3,228,968 · +13.4%
- By 2075
- 3,321,723 · +16.7%
- By 2100
- 3,111,387 · +9.3%
Race, ethnicity, and origin ACS 2023
- Neighborhood character
- Predominantly Black (68%)
- Race & ethnicity
- Black 68% Hispanic / Latino 20% Two or more races 12% White 4% Asian 1%
- Hispanic origin (detail)
- Mexican 2% Puerto Rican 6% Dominican 6%
- Common ancestry
- Hispanic 3% Ukrainian 1%
- Foreign-born
- 34% · Canada, Mexico, China
- Languages at home
- 77% English-only · Spanish 14% French/Haitian/Cajun 4% Arabic 1%
Political lean MEDSL · Kings
- 2024 margin
- Solid D (+44.0) · D 72.0% · R 28.0%
- 2008→2024 swing
- -15.5pp toward R · 2008: 59.4pp · 2024: 44.0pp
- All cycles
- 2024: D+44.0 2020: D+54.8 2016: D+61.8 2012: D+63.9 2008: D+59.4
Not yet ingested
- Civics
- —
Market trends
- HPI YoY
- ▼ -140.90%
- Current HPI
- 269.7955
- Rent YoY
- ▼ -0.59%
- Metro
- New York-Newark-Jersey City, NY-NJ-PA
- State GDP YoY
- ▲ 2.60%
- F500 in state
- 92
Industry mix (Fortune 500 HQ in NY)
| Industry | F500 HQs | Revenue |
|---|---|---|
| Financial Services | 10 | $950B |
|
||
| Consumer Goods | 9 | $162B |
|
||
| Insurance | 4 | $225B |
|
||
| Telecommunications | 2 | $144B |
|
||
| Pharmaceuticals | 2 | $112B |
|
||
| Media / Entertainment | 2 | $69B |
|
||
Price history
+418.5% since first listed2 events — show timeline
- 2026-03-30 Listed $700,000 BNYMLS
- 1999-04-28 Sold (Public Records) $135,000 Public Records
Property tax history
+2.2%/yrLatest (2025): $2,017 · +4.4% YoY. Source: county tax records.
Cash-flow waterfall
monthlySold comps — $/sqft
last 12 mo · ≤1 miLoading sold comps…