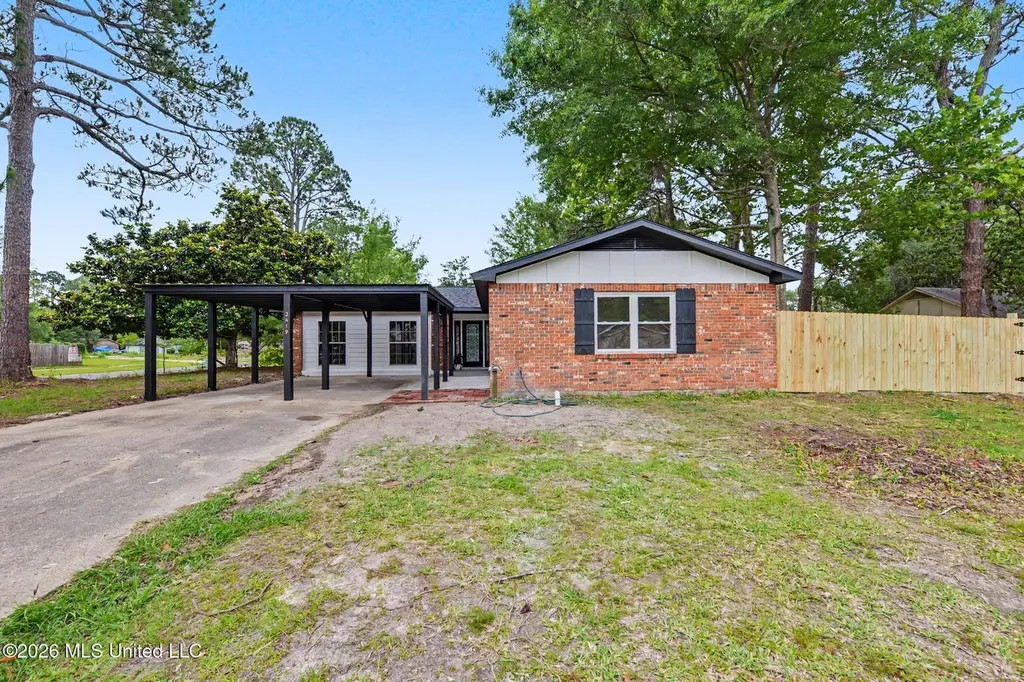
2419 Avenido Del Pinar St · Gautier, MS
Flood risk 4/10 · Minor
- FEMA flood zone
- X (shaded)
- Chance of flooding over 30 yrs
- 0.22%
- Est. flood insurance / yr
- $507 – $1,088
Fire risk 3/10 · Minor
- Est. fire insurance / yr
- $1,241 – $2,305
Heat risk 10/10 · Severe
- Hot days now (above 106°F)
- 7 days/yr
- Hot days in 30 yrs
- 24 days/yr
Wind risk 9/10 · Severe
- Chance of severe wind over 30 yrs
- 99.0%
Air-quality risk 2/10 · Minimal
- Unhealthy air days now
- 1 days/yr
- Unhealthy air days in 30 yrs
- 2 days/yr
Risk factors via First Street. Map © Google.
Why this score? — see what drove the F grade
The composite is a weighted blend of 9 inputs, each scored 0–100. Each bar is that input's sub-score; the figure is the points it added to the 100-point composite (weight × sub-score).
- Cash flow +13.2/30.0
- DSCR +4.0/10.0
- Schools +3.3/10.0
- Livability +3.3/5.0
- 1% rule +2.9/10.0
- Rent growth +2.5/5.0
- Condition / age +2.5/5.0
- ARV discount +0.0/15.0
- Appreciation +0.0/10.0
$209,900
🖨 Deal sheet 📄 Offer letter ✓ Due diligence
Listing remarks MLS
Come See this 2 bedroom and 2 bathroom, brick home. Located on a corner lot, partially fenced with Shed/Storage building.
Key facts
- Custom cabinetry
- Remodeled
- Hvac
Tags
Property features AI
Exterior
- Parking: Covered carport for 2 cars; Driveway (concrete)
- Utilities: Public water; Public sewer; Electricity connected; Water and sewer connected
- Home design: Single-family house; One level; Move-in ready
- Construction: Brick veneer and siding exterior; Shingle roof; Slab foundation; Built (year per assessor)
- Exterior features: Back yard with full fencing; Patio
Interior
- Kitchen: Dishwasher; Microwave
- Flooring: Ceramic tile; Laminate
- Bathrooms: 3 full bathrooms
- Heating & cooling: Central heating (electric); Central air (electric); Ceiling fans for cooling
- Interior features: Ceiling fans; Kitchen island; Open floor plan; Double-pane windows
- Laundry & utility: Dedicated laundry room; Water heater
Neighborhood map
What this means for you Summary
Snapshot
- This is a 4-bed/2.0-bath single-family listed at $210k.
Deal economics
- At list price, monthly cash flow is $-3 ($-38/yr) — negative.
- To cash-flow at today's rent, offer at most $209k (0.3% below list).
- To meet the 1% rule (rent ≥ 1% of price), the offer needs to be $165k (21.2% below list).
- Recommended offer: $165k (21.2% below list) — sets the bar for 1% rule.
- Cap rate 6.3% vs local median 4.2% in Gautier — top-decile yield for the area; either an underpriced asset or a hidden risk that comps aren't pricing in. Stress-test before assuming the spread holds.
Location & tenants
- Location reads 66/100 on livability (#89 in MS) — a middle-class / working-renter tenant base. Strengths: cost of living A+, housing A+; Watch: health & safety D+, schools D, employment D.
- Pascagoula-Gautier School District (urban): math 40% / reading 38% proficiency, ranked #41 of 130 in MS (top 32%) — families likely to look elsewhere, expect single-tenant / working-renter base with shorter leases; 78% free/reduced lunch — lower-income household profile, screen leases tightly.
- Market conditions: 208 active listings in the ZIP; 1 comparable units currently listed for rent nearby; 516 units permitted in Jackson County in 2024 (6 in 5+ unit buildings).
- This rent runs 35% of the median local income ($57k/yr) — at the standard rent-burdened threshold; future hikes will face affordability resistance.
Forward outlook
- Local home prices are declining (-3.0%/yr); year-one equity from $1k of loan paydown is wiped out by about $6k of value loss. Plan a longer hold.
Negotiation context
- Only 8 days on market — expect competitive offers; lowballing is unlikely to land.
- 3 sale attempts since 2y ago with the ask held roughly flat each time — persistent listings suggest the price (not the market) is what's stuck; bring a comps-based counter.
- Current owner paid $71k; list at $210k implies a 196% gain — meaningful room to come down on a strong offer.
Risks & watch-outs
- Climate carrying-cost: severe wind risk, 99% chance of damaging wind over 30y; extreme-heat days projected 7→24/yr by 2055 (HVAC capex compounding) — expect insurance premiums to compound above CPI over the hold.
Questions for the listing agent
- What do current leases actually rent for vs. the listed asking? Can we see a recent rent roll and the last 12 months of T-12 income?
- Built in 1973 — when were the roof, HVAC, electrical panel, plumbing, and water heater last replaced?
- Is there a deadline driving the sale (1031 exchange, divorce, estate, relocation)? That informs how much negotiation room exists.
- Schools are D-rated, which usually means shorter tenancies and higher turnover. Who's the typical renter profile here, and what's been the actual vacancy rate?
- The area grade is low — what's the realistic commute time and amenity access for the typical tenant pool here? Any planned neighborhood developments (good or bad) we should know about?
- What's the average days-on-market for RENTAL listings here right now (not sales)? A rising rental-DOM trend means longer vacancies and softer asking-rent achievability than the comps imply.
- What's the recent tenant-quality profile in this submarket — average credit score on applications, eviction rate, late-payment / NSF rate, and stable-employment percentage? A property-management company in the area should have these aggregated.
- How much new for-sale + rental construction is in the pipeline within 1–3 miles? Heavy new supply typically softens prices + rents 12–24 months out; constrained supply supports both.
Investment metrics
- 1% rule
- 0.79% ✗
- Cap rate
- 6.27%
- Cash-on-cash
- -0.07%
- DSCR
- 1.00
- GRM
- 10.6
CMA / ARV
- ARV (on-the-fly)
- $154,420
- Comps found
- 12
Show comp detail 12 sales within ~0.75 mi
| Address | Dist | Beds/Ba | Sqft | Sold | Price | $/sf | Match |
|---|---|---|---|---|---|---|---|
| 2612 San Lorenzo St | 0.28mi | 3/2.0 (-1) | 1,147 (+4%) | 3mo | $159,999 | $139 | 73 |
| 2306 Calle De Desoto St | 0.15mi | 3/2.0 (-1) | 1,032 (-6%) | 8mo | $95,000 | $92 | 70 |
| 2325 W Park Dr | 0.35mi | 3/1.0 (-1) | 1,080 (-2%) | 3mo | $152,900 | $142 | 69 |
| 2313 Avenido Encanto St | 0.14mi | 3/2.0 (-1) | 1,226 (+11%) | 8mo | $162,000 | $132 | 63 |
| 2307 Ladnier Rd | 0.18mi | 3/2.0 (-1) | 960 (-13%) | 4mo | $135,000 | $141 | 62 |
| 2823 Woodlane St | 0.41mi | 3/1.0 (-1) | 1,011 (-8%) | 2mo | $160,900 | $159 | 57 |
| 2205 University St | 0.32mi | 3/1.0 (-1) | 1,247 (+13%) | 1mo | $100,000 | $80 | 53 |
| 2413 Northbrook Dr | 0.55mi | 3/1.5 (-1) | 1,023 (-7%) | 4mo | $152,500 | $149 | 52 |
| 2112 Woodbury Rd | 0.46mi | 3/1.0 (-1) | 1,214 (+10%) | 6mo | $119,000 | $98 | 48 |
| 2718 Ridgeway Dr | 0.47mi | 3/1.0 (-1) | 1,256 (+14%) | 6mo | $167,695 | $134 | 41 |
| 2019 Pamela Dr | 0.57mi | 3/1.0 (-1) | 1,248 (+13%) | 6mo | $175,000 | $140 | 37 |
| 2001 S Haven Dr | 0.62mi | 3/1.5 (-1) | 962 (-13%) | 10mo | $135,000 | $140 | 34 |
Match score weights: distance 35% · size 25% · config 20% · recency 20%. Top-matched comps best support the ARV.
Projected returns pro-forma
-3.0% appreciation · 3.0% rent growth · sell at horizon
- IRR
- -16.5%
- Equity multiple
- 0.42×
- Total profit
- $-34,277
- Equity at exit
- $31,297
- IRR
- -8.3%
- Equity multiple
- 0.48×
- Total profit
- $-30,359
- Equity at exit
- $18,148
Cash invested: $58,772 (down + closing). Projections, not guarantees.
Landlord ↔ Tenant lean methodology
- Overall (STATE)
- 90 Strongly Landlord-Friendly
- State Mississippi
- 90 Strongly Landlord-Friendly · R+11
- County
- — inherits STATE
- City
- — inherits STATE
ZIP-level market 39553
- Home prices YoY
- -17.0%
- Active inventory
- 208
- Price-to-rent
- 10.6×
Monthly cashflow live
- Estimated rent
- $1,654 medium interval (Pro) →
- Mortgage (P&I)
- −$1,101
- Tax from tax record
- −$122 /mo · $1,459/yr
- Insurance
- −$87
- HOA
- −$0
- Vacancy / Maint / Mgmt
- −$347
- Net cashflow
- $-3
Break-even live
UW: 25.0% down · 7.5% · 30yr · 1.5% tax · 5.0% vac · 8.0% maint · 8.0% mgmt
Financing live
Cash to close
- Down payment
- $52,475
- Closing costs
- $6,297
- Reserves months
- —
- Total cash needed
- —
Loan-product check · same deal, 3 products live
Conventional
25% down · 7.5% · 30yr
- Down + closing
- —
- Monthly P&I
- —
- Monthly cashflow
- —
- DSCR
- —
- Eligible?
- —
Personal DTI + credit; lowest rate.
DSCR
20% down · 8.5% · 30yr
- Down + closing
- —
- Monthly P&I
- —
- Monthly cashflow
- —
- DSCR
- —
- Eligible?
- —
No personal income docs; deal must DSCR.
Hard money
10% down · 12.0% · 12mo
- Down + closing
- —
- Monthly P&I
- —
- Monthly cashflow
- —
- DSCR
- —
- Eligible?
- —
Short-term bridge; refi at stabilization.
Rent comps 1 comps
| Address | Beds | Baths | Sqft | Rent | $/sqft | DOM | Units | Dist |
|---|---|---|---|---|---|---|---|---|
| 3254 Stonegate Cir Gautier, MS | 3.0 | 2.0 | 1472 | $1,700 | $1.15 | 13d | 1 | 0.83mi |
Listing history 9 events
-
2026-05-30status $209,900 Pending 8 DOM
-
2026-05-21$209,900 Active
-
2026-02-09soldstatus $71,000
-
2026-01-13soldstatus Closed 121-char remark
Show marketing remark (121 chars)
Come See this 2 bedroom and 2 bathroom, brick home. Located on a corner lot, partially fenced with Shed/Storage building.
-
2025-12-29status Pending 121-char remark
Show marketing remark (121 chars)
Come See this 2 bedroom and 2 bathroom, brick home. Located on a corner lot, partially fenced with Shed/Storage building.
-
2025-11-14$75,000 Active 121-char remark
Show marketing remark (121 chars)
Come See this 2 bedroom and 2 bathroom, brick home. Located on a corner lot, partially fenced with Shed/Storage building.
-
2024-10-30historical
-
2024-10-05price $119,999
-
2024-08-03$125,000 Active
ⓘ Source: listings_history table (triggers on properties + properties_extension) + one-shot
backfill from property_details.listing_events for pre-trigger history.
Tax reassessment forecast MS · Resets to sale price
- Current annual tax
- $1,459 · $122/mo
- Projected year-2 tax
- $1,658 · $138/mo
- Expected delta
- +$199/yr (+$17/mo · 13.6%)
ⓘ Screening estimate from a state-policy table — verify with the county assessor before closing.
Climate risk First Street
- Flood 4/10 Moderate FEMA zone X (shaded) · 22% chance over 30 yrs
- Wildfire 3/10 Moderate
- Heat 10/10 Extreme 7 d/yr ≥106°F today · 24 d/yr by 30 yrs out
- Wind 9/10 Extreme 99% chance of damaging wind over 30 yrs
- Air quality 2/10 Low 1 unhealthy d/yr today · 2 by 30 yrs out
Nearby sold comps map
Loading sold comps map…
Walkable amenities ~0.75 mi
Loading nearby amenities…
Taxation est. · year 1
- Rental income
- $19,847
- − Mortgage interest
- −$11,758
- − Property taxes
- −$1,459
- − Insurance
- −$1,050
- − Repairs & maintenance
- −$1,588
- − Management
- −$1,588
- − Depreciation
- −$6,106
- Taxable loss
- −$3,701
- Est. tax savings @ 24.0%
- +$888
- After-tax cash flow
- $850/yr
For passive investors: Depreciation is non-cash, so a rental often shows a tax loss while cash-flowing — sheltering income. Rental losses are passive: they offset passive income freely, and up to $25,000/yr can offset ordinary (W-2) income if you actively participate and your MAGI is under $100k (phasing out to $0 by $150k); unused losses carry forward. On sale, claimed depreciation is recaptured at up to 25%, and gains may owe capital-gains tax (a 1031 exchange can defer both). Figures are a year-1 estimate at your 24.0% rate — not tax advice; consult a CPA.
Schools (NCES district)
- District
- Pascagoula-Gautier School District
- NCES district ID
- 2803480
- Math proficiency
- 40% ▼ -3.00%
- Reading proficiency
- 38% ▼ -4.00%
- Median HH income
- $41,392
- Composite
- 32.86/100
- National rank
- #5613
- State rank
- #41 of 130 in MS
Livability — Gautier
- Score
- 66/100
- State rank
- #89
- US rank
- #11250
Category grades
Schools grade is shown separately in the Schools card above.
Census & demographics
- Census place
- Gautier, MS
- County
- Jackson County · 82,196 people
- City population
- 17,225
- Metro
- Gulfport-Biloxi, MS
- Population (ZIP)
- 17,225
- Household income
- $57,460
- Rent vs Own
- Severe rent burden
- 653.0
Population outlook (Jackson County) Hauer SSP2
- Today (2025)
- 146,926 people
- By 2030
- 148,442 · +1.0%
- By 2040
- 149,631 · +1.8%
- By 2050
- 148,723 · +1.2%
- By 2075
- 147,845 · +0.6%
- By 2100
- 144,510 · -1.6%
Race, ethnicity, and origin ACS 2023
- Neighborhood character
- Diverse neighborhood (Simpson 0.60)
- Race & ethnicity
- White 55% Black 28% Hispanic / Latino 12% Two or more races 7% Asian 1%
- Hispanic origin (detail)
- Mexican 3% Puerto Rican 8%
- Common ancestry
- Slovak 4% Lithuanian 3% Serbian 2%
- Foreign-born
- 3% · Canada, China
- Languages at home
- 90% English-only · Spanish 8% Chinese 0%
Political lean MEDSL · Jackson
- 2024 margin
- Solid R (+39.9) · D 29.5% · R 69.4% · Other 1.1%
- 2008→2024 swing
- -6.4pp toward R · 2008: -33.5pp · 2024: -39.9pp
- All cycles
- 2024: R+39.9 2020: R+34.6 2016: R+39.9 2012: R+36.1 2008: R+33.5
Not yet ingested
- Civics
- —
Market trends
- HPI YoY
- ▼ -42.77%
- Current HPI
- 209.1746
- Rent YoY
- —
- Metro
- Gulfport-Biloxi, MS
- State GDP YoY
- —
- F500 in state
- 0
Price history
+67.9% since first listed8 events — show timeline
- 2026-05-21 Listed $209,900 MLSU
- 2026-02-09 Sold (Public Records) $71,000 Public Records
- 2026-01-13 Sold (MLS) — MLSU
- 2025-12-29 Pending — MLSU
- 2025-11-14 Listed $75,000 MLSU
- 2024-10-30 Listing Removed — MLSU
- 2024-10-05 Price Changed $119,999 MLSU
- 2024-08-03 Listed $125,000 MLSU
Property tax history
+16.3%/yrLatest (2025): $1,459 · +16.3% YoY. Source: county tax records.
Cash-flow waterfall
monthlySold comps — $/sqft
last 12 mo · ≤1 miLoading sold comps…