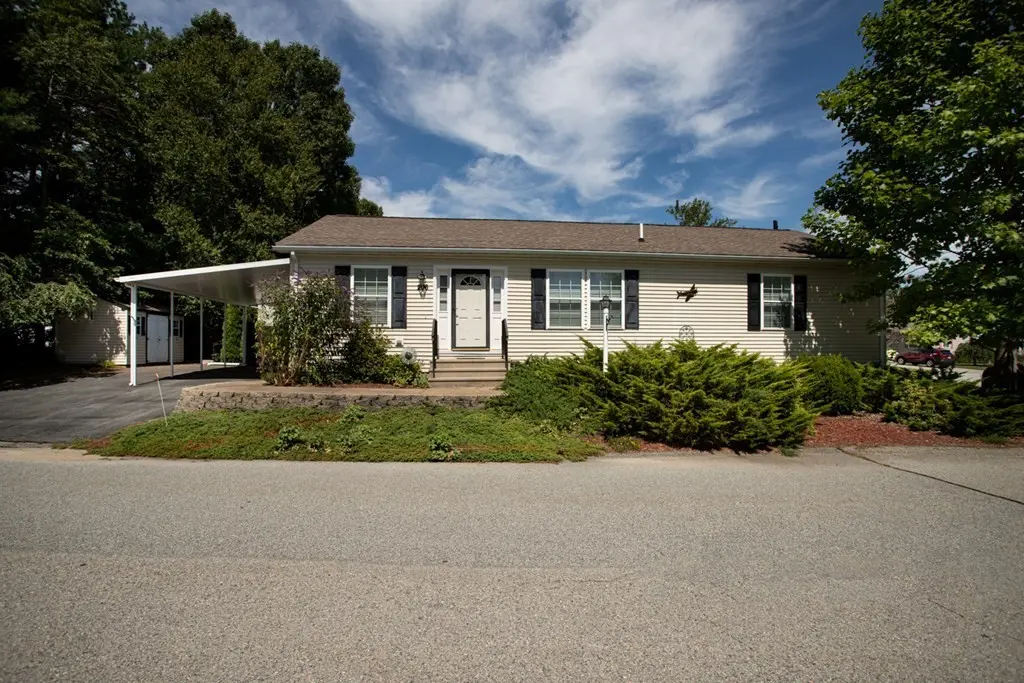
206 E Songbird Ln · Fall River, MA
Flood risk 1/10 · Minimal
- FEMA flood zone
- X (unshaded)
- Chance of flooding over 30 yrs
- 0.0%
- Est. flood insurance / yr
- $507 – $1,088
Fire risk 1/10 · Minimal
- Est. fire insurance / yr
- $835 – $1,551
Heat risk 5/10 · Moderate
- Hot days now (above 96°F)
- 7 days/yr
- Hot days in 30 yrs
- 15 days/yr
Wind risk 8/10 · Major
- Chance of severe wind over 30 yrs
- 80.0%
Air-quality risk 3/10 · Minor
- Unhealthy air days now
- 3 days/yr
- Unhealthy air days in 30 yrs
- 3 days/yr
Risk factors via First Street. Map © Google.
Why this score? — see what drove the B- grade
The composite is a weighted blend of 9 inputs, each scored 0–100. Each bar is that input's sub-score; the figure is the points it added to the 100-point composite (weight × sub-score).
- Cash flow +24.4/30.0
- ARV discount +15.0/15.0
- 1% rule +9.1/10.0
- DSCR +7.9/10.0
- Schools +3.8/10.0
- Livability +3.1/5.0
- Rent growth +2.5/5.0
- Condition / age +2.5/5.0
- Appreciation +0.0/10.0
$229,000
🖨 Deal sheet 📄 Offer letter ✓ Due diligence
Listing remarks MLS
Lovely 2 bedroom ranch in Country View Estates a gated over 55 community. . This unit has full access to club house facility ie: inground, indoor pool, patio, kitchen. function room, library and more. 2 bedrooms, 2 baths, wood laminate floors, dining room, foyer/reading room and much more. This is a front facing home with carport, shed, 4" basement, corner lot, Immaculate move in condition.. Ready for immediate occupancy.
Key facts
- 2 garage spots
- Built 2004
- Listed 43 days
Neighborhood map
What this means for you Summary
Snapshot
- This is a 2-bed/2.0-bath manufactured listed at $229k.
Deal economics
- At list price, monthly cash flow is $463 ($6k/yr) — positive.
- The deal already cash-flows at list — no discount required.
- Meets the 1% rule at list price ($3k rent vs $229k).
- Recommended offer: $222k (3.0% below list) — sets the bar for market timing.
- Cap rate 8.7% vs local median 3.6% in Fall River — top-decile yield for the area; either an underpriced asset or a hidden risk that comps aren't pricing in. Stress-test before assuming the spread holds.
Location & tenants
- Location reads 61/100 on livability (#221 in MA) — a middle-class / working-renter tenant base. Strengths: health & safety A+; Watch: cost of living D+, schools D, crime F.
- Tiverton (rural): math 35% / reading 49% proficiency, ranked #14 of 39 in RI (top 36%) — families likely to look elsewhere, expect single-tenant / working-renter base with shorter leases.
- Market conditions: 4 comparable units currently listed for rent nearby; rentals at typical pace (median 24d on market — plan ~3-4 weeks tenant-placement turnaround); solid renter incomes; 94 units permitted in Newport County in 2024 (0 in 5+ unit buildings).
- This rent runs 36% of the median local income ($106k/yr) — at the standard rent-burdened threshold; future hikes will face affordability resistance.
Forward outlook
- Local home prices are declining (-3.0%/yr); year-one equity from $2k of loan paydown is wiped out by about $7k of value loss. Plan a longer hold.
- Newport County population projected at -12% by 2050 — secular population decline; favor cash flow + early exit over multi-decade hold.
Negotiation context
- It's been on market 43 days — a 3% lower offer ($222k) is reasonable based on typical stale-listing flexibility.
- 3 sale attempts since 13y ago with the ask held roughly flat each time — persistent listings suggest the price (not the market) is what's stuck; bring a comps-based counter.
Risks & watch-outs
- Climate carrying-cost: severe wind risk, 80% chance of damaging wind over 30y; extreme-heat days projected 7→15/yr by 2055 (HVAC capex compounding) — expect insurance premiums to compound above CPI over the hold.
Questions for the listing agent
- It's been on market 43 days. Have you received any prior offers? Is the seller open to a 3% concession, seller financing, or rate buy-down credit?
- What does the HOA fee cover, when was the last increase, and are there any pending special assessments or reserve-fund shortfalls?
- Is there a deadline driving the sale (1031 exchange, divorce, estate, relocation)? That informs how much negotiation room exists.
- Schools are D-rated, which usually means shorter tenancies and higher turnover. Who's the typical renter profile here, and what's been the actual vacancy rate?
- Crime grade is F in this area — have there been break-ins, vandalism, or insurance claims at this property in the last 3 years? What carrier currently insures it and at what premium?
- What's the average days-on-market for RENTAL listings here right now (not sales)? A rising rental-DOM trend means longer vacancies and softer asking-rent achievability than the comps imply.
- What's the recent tenant-quality profile in this submarket — average credit score on applications, eviction rate, late-payment / NSF rate, and stable-employment percentage? A property-management company in the area should have these aggregated.
- How much new for-sale + rental construction is in the pipeline within 1–3 miles? Heavy new supply typically softens prices + rents 12–24 months out; constrained supply supports both.
Investment metrics
- 1% rule
- 1.41% ✓
- Cap rate
- 8.72%
- Cash-on-cash
- 8.67%
- DSCR
- 1.39
- GRM
- 5.9
CMA / ARV
- ARV (on-the-fly)
- $352,352
- Comps found
- 3
Show comp detail 3 sales within ~0.75 mi
| Address | Dist | Beds/Ba | Sqft | Sold | Price | $/sf | Match |
|---|---|---|---|---|---|---|---|
| 70 Songbird Ln | 0.14mi | 2/2.0 | 1,404 (-4%) | 23mo | $285,000 | $203 | 68 |
| 77 Robin Dr | 0.12mi | 3/2.0 (+1) | 1,344 (-8%) | 12mo | $325,000 | $242 | 67 |
| 53 Blue Jay | 0.11mi | 2/2.0 | 1,352 (-7%) | 23mo | $330,000 | $244 | 64 |
Match score weights: distance 35% · size 25% · config 20% · recency 20%. Top-matched comps best support the ARV.
Projected returns pro-forma
-3.0% appreciation · 3.0% rent growth · sell at horizon
- IRR
- -3.0%
- Equity multiple
- 0.89×
- Total profit
- $-7,248
- Equity at exit
- $34,145
- IRR
- 6.8%
- Equity multiple
- 1.52×
- Total profit
- $33,124
- Equity at exit
- $19,800
Cash invested: $64,120 (down + closing). Projections, not guarantees.
Landlord ↔ Tenant lean methodology
- Overall (STATE)
- 20 Strongly Tenant-Friendly
- State Massachusetts
- 20 Strongly Tenant-Friendly · D+15
- County
- — inherits STATE
- City
- — inherits STATE
ZIP-level market 02878
- Home prices YoY
- -23.3%
- Price-to-rent
- 5.9×
Monthly cashflow live
- Estimated rent
- $3,221 medium interval (Pro) →
- Mortgage (P&I)
- −$1,201
- Tax from tax record
- −$215 /mo · $2,583/yr
- Insurance
- −$95
- HOA
- −$570
- Vacancy / Maint / Mgmt
- −$676
- Net cashflow
- $463
Break-even live
UW: 25.0% down · 7.5% · 30yr · 1.5% tax · 5.0% vac · 8.0% maint · 8.0% mgmt
Financing live
Cash to close
- Down payment
- $57,250
- Closing costs
- $6,870
- Reserves months
- —
- Total cash needed
- —
Loan-product check · same deal, 3 products live
Conventional
25% down · 7.5% · 30yr
- Down + closing
- —
- Monthly P&I
- —
- Monthly cashflow
- —
- DSCR
- —
- Eligible?
- —
Personal DTI + credit; lowest rate.
DSCR
20% down · 8.5% · 30yr
- Down + closing
- —
- Monthly P&I
- —
- Monthly cashflow
- —
- DSCR
- —
- Eligible?
- —
No personal income docs; deal must DSCR.
Hard money
10% down · 12.0% · 12mo
- Down + closing
- —
- Monthly P&I
- —
- Monthly cashflow
- —
- DSCR
- —
- Eligible?
- —
Short-term bridge; refi at stabilization.
Rent comps 4 comps
| Address | Beds | Baths | Sqft | Rent | $/sqft | DOM | Units | Dist |
|---|---|---|---|---|---|---|---|---|
| 535 Hancock St Tiverton, RI | 3.0 | 2.0 | 1860 | $4,500 | $2.42 | 24d | 1 | 0.27mi |
| 58 Urban's Ln Unit A Tiverton, RI | 1.0 | 1.5 | 1350 | $2,395 | $1.77 | 44d | 1 | 1.08mi |
| 425 Anthony St Unit 1 Fall River, MA | 3.0 | 1.0 | 1000 | $2,100 | $2.10 | 2d | 1 | 1.22mi |
| 1141 Stafford Rd Fall River, MA | 3.0 | 1.0 | 940 | $1,750 | $1.86 | 2d | 1 | 1.24mi |
HOA detail
- Monthly dues
- $570 · $6,840/yr
- Likely covers
- poolsecurity
Listing history 9 events
-
2021-10-05soldstatus $200,000 Sold 431-char remark
Show marketing remark (431 chars)
Lovely 2 bedroom ranch in Country View Estates a gated over 55 community. . This unit has full access to club house facility ie: inground, indoor pool, patio, kitchen. function room, library and more. 2 bedrooms, 2 baths, wood laminate floors, dining room, foyer/reading room and much more. This is a front facing home with carport, shed, 4" basement, corner lot, Immaculate move in condition.. Ready for immediate occupancy.
-
2021-09-30status Pending
-
2021-09-23status Under Agreement 431-char remark
Show marketing remark (431 chars)
Lovely 2 bedroom ranch in Country View Estates a gated over 55 community. . This unit has full access to club house facility ie: inground, indoor pool, patio, kitchen. function room, library and more. 2 bedrooms, 2 baths, wood laminate floors, dining room, foyer/reading room and much more. This is a front facing home with carport, shed, 4" basement, corner lot, Immaculate move in condition.. Ready for immediate occupancy.
-
2021-08-18$229,900 New 431-char remark
Show marketing remark (431 chars)
Lovely 2 bedroom ranch in Country View Estates a gated over 55 community. . This unit has full access to club house facility ie: inground, indoor pool, patio, kitchen. function room, library and more. 2 bedrooms, 2 baths, wood laminate floors, dining room, foyer/reading room and much more. This is a front facing home with carport, shed, 4" basement, corner lot, Immaculate move in condition.. Ready for immediate occupancy.
-
2021-08-18$229,000 Active
Show marketing remark (431 chars)
Lovely 2 bedroom ranch in Country View Estates a gated over 55 community. . This unit has full access to club house facility ie: inground, indoor pool, patio, kitchen. function room, library and more. 2 bedrooms, 2 baths, wood laminate floors, dining room, foyer/reading room and much more. This is a front facing home with carport, shed, 4" basement, corner lot, Immaculate move in condition.. Ready for immediate occupancy.
-
2013-12-19price $115,000
-
2013-10-16historical
-
2013-04-18$130,000
-
2005-05-03soldstatus $125,500
ⓘ Source: listings_history table (triggers on properties + properties_extension) + one-shot
backfill from property_details.listing_events for pre-trigger history.
Tax reassessment forecast MA · Partial reset (capped growth)
- Current annual tax
- $2,583 · $215/mo
- Projected year-2 tax
- $2,700 · $225/mo
- Expected delta
- +$117/yr (+$10/mo · 4.5%)
ⓘ Screening estimate from a state-policy table — verify with the county assessor before closing.
Climate risk First Street
- Flood 1/10 Low FEMA zone X (unshaded) · 0% chance over 30 yrs
- Wildfire 1/10 Low
- Heat 5/10 Major 7 d/yr ≥96°F today · 15 d/yr by 30 yrs out
- Wind 8/10 Severe 80% chance of damaging wind over 30 yrs
- Air quality 3/10 Moderate 3 unhealthy d/yr today · 3 by 30 yrs out
Nearby sold comps map
Loading sold comps map…
Walkable amenities ~0.75 mi
Loading nearby amenities…
Taxation est. · year 1
- Rental income
- $38,655
- − Mortgage interest
- −$12,828
- − Property taxes
- −$2,583
- − Insurance
- −$1,145
- − Repairs & maintenance
- −$3,092
- − Management
- −$3,092
- − HOA
- −$6,840
- − Depreciation
- −$6,662
- Taxable income
- $2,413
- Est. tax owed @ 24.0%
- −$579
- After-tax cash flow
- $4,980/yr
For passive investors: Depreciation is non-cash, so a rental often shows a tax loss while cash-flowing — sheltering income. Rental losses are passive: they offset passive income freely, and up to $25,000/yr can offset ordinary (W-2) income if you actively participate and your MAGI is under $100k (phasing out to $0 by $150k); unused losses carry forward. On sale, claimed depreciation is recaptured at up to 25%, and gains may owe capital-gains tax (a 1031 exchange can defer both). Figures are a year-1 estimate at your 24.0% rate — not tax advice; consult a CPA.
Schools (NCES district)
- District
- Tiverton
- NCES district ID
- 4401050
- Math proficiency
- 35% ▼ -6.00%
- Reading proficiency
- 49% ▬ 0.00%
- Median HH income
- $67,472
- Composite
- 37.77/100
- National rank
- #4347
- State rank
- #14 of 39 in RI
Livability — Fall River
- Score
- 61/100
- State rank
- #221
- US rank
- #18220
Category grades
Schools grade is shown separately in the Schools card above.
Census & demographics
- County
- Newport County
- City population
- 93,033
- Metro
- Providence-Warwick, RI-MA
- Population (ZIP)
- 16,189
- Household income
- $106,036
- Rent vs Own
- Severe rent burden
- 201.0
Population outlook (Newport County) Hauer SSP2
- Today (2025)
- 81,198 people
- By 2030
- 79,518 · -2.1%
- By 2040
- 75,581 · -6.9%
- By 2050
- 71,801 · -11.6%
- By 2075
- 64,618 · -20.4%
- By 2100
- 56,724 · -30.1%
Race, ethnicity, and origin ACS 2023
- Neighborhood character
- Predominantly White (91%)
- Race & ethnicity
- White 91% Hispanic / Latino 4% Two or more races 3% Black 2%
- Common ancestry
- Russian 30% Lithuanian 15% Romanian 4%
- Foreign-born
- 7% · Canada
- Languages at home
- 92% English-only · Other Indo-European 5% Spanish 2% French/Haitian/Cajun 1%
Political lean MEDSL · Newport
- 2024 margin
- Strong D (+25.5) · D 61.6% · R 36.1% · Other 2.2%
- 2008→2024 swing
- +2.2pp toward D · 2008: 23.3pp · 2024: 25.5pp
- All cycles
- 2024: D+25.5 2020: D+29.8 2016: D+19.4 2012: D+17.7 2008: D+23.3
Not yet ingested
- Civics
- —
Market trends
- HPI YoY
- ▼ -110.16%
- Current HPI
- 362.7711
- Rent YoY
- —
- Metro
- Providence-Warwick, RI-MA
- State GDP YoY
- ▲ 2.28%
- F500 in state
- 38
Industry mix (Fortune 500 HQ in MA)
| Industry | F500 HQs | Revenue |
|---|---|---|
| Technology | 3 | $17B |
|
||
| Insurance | 2 | $84B |
|
||
| Retail | 2 | $76B |
|
||
| Life Sciences | 1 | $43B |
|
||
| Energy Technology | 1 | $31B |
|
||
| Aerospace / Defense | 1 | $18B |
|
||
Price history
+59.4% since first listed9 events — show timeline
- 2021-10-05 Sold (MLS) $200,000 MLS PIN
- 2021-09-30 Pending — RIS
- 2021-09-23 Pending — MLS PIN
- 2021-08-18 Listed $229,000 RIS
- 2021-08-18 Listed $229,900 MLS PIN
- 2013-12-19 Price Changed $115,000 RIS
- 2013-10-16 Listing Removed — RIS
- 2013-04-18 Listed $130,000 RIS
- 2005-05-03 Sold (Public Records) $125,500 Public Records
Property tax history
+2.5%/yrLatest (2024): $2,583 · -3.7% YoY. Source: county tax records.
Cash-flow waterfall
monthlySold comps — $/sqft
last 12 mo · ≤1 miLoading sold comps…