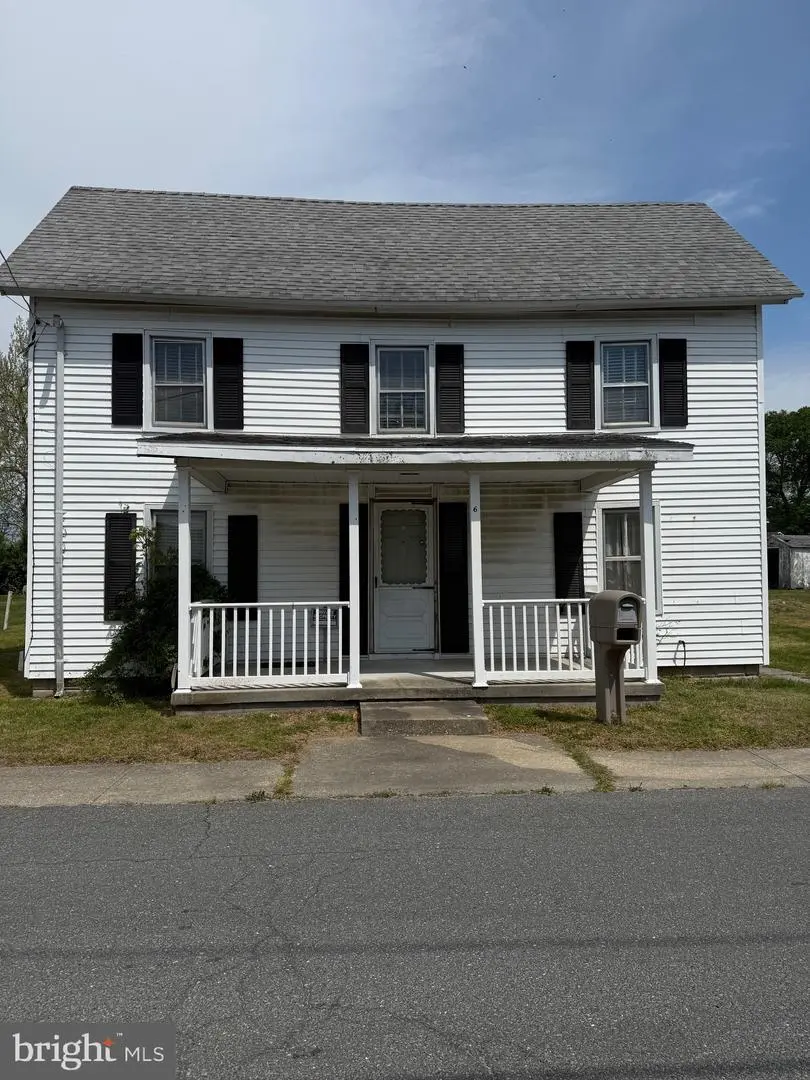
6 E 4th · Blades, DE
Flood risk 1/10 · Minimal
- FEMA flood zone
- X (unshaded)
- Chance of flooding over 30 yrs
- 0.0%
- Est. flood insurance / yr
- $473 – $860
Fire risk 1/10 · Minimal
- Est. fire insurance / yr
- $476 – $884
Heat risk 8/10 · Major
- Hot days now (above 105°F)
- 7 days/yr
- Hot days in 30 yrs
- 16 days/yr
Wind risk 6/10 · Moderate
- Chance of severe wind over 30 yrs
- 71.0%
Air-quality risk 3/10 · Minor
- Unhealthy air days now
- 2 days/yr
- Unhealthy air days in 30 yrs
- 2 days/yr
Risk factors via First Street. Map © Google.
Why this score? — see what drove the B- grade
The composite is a weighted blend of 9 inputs, each scored 0–100. Each bar is that input's sub-score; the figure is the points it added to the 100-point composite (weight × sub-score).
- Cash flow +27.7/30.0
- ARV discount +15.0/15.0
- DSCR +9.7/10.0
- 1% rule +6.2/10.0
- Livability +3.4/5.0
- Schools +2.8/10.0
- Rent growth +2.5/5.0
- Condition / age +2.5/5.0
- Appreciation +0.0/10.0
$170,000
🖨 Deal sheet (PDF) 📄 Offer letter ✓ Due diligence
Listing remarks MLS
Charming 100+-year-old home full of potential — ready for your touch of modern updates and personalization. Sited on a generous, park-like lot with * possible subdivision opportunity (buyer to verify with county concerning subdividing). Perfect for investors, visionaries, or anyone seeking historic charm and room to grow. Property is being sold as-is, inspection for information purposes only.
Key facts
- 0.33 acre lot
- Built 1900
- Listed 57 days
Neighborhood map
What this means for you Summary
Snapshot
- This is a 3-bed/1.0-bath single-family listed at $170k.
Deal economics
- At list price, monthly cash flow is $511 ($6k/yr) — positive.
- The deal already cash-flows at list — no discount required.
- Meets the 1% rule at list price ($2k rent vs $170k).
- Recommended offer: $165k (3.0% below list) — sets the bar for market timing.
- Cap rate 9.9% vs local median 4.4% in Blades — top-decile yield for the area; either an underpriced asset or a hidden risk that comps aren't pricing in. Stress-test before assuming the spread holds.
Location & tenants
- Location reads 67/100 on livability (#37 in DE) — a middle-class / working-renter tenant base. Strengths: cost of living A+, housing A+, health & safety A+; Watch: employment D+, schools F, crime F.
- Seaford School District (suburban): math 25% / reading 40% proficiency, ranked #15 of 26 in DE (top 58%) — families likely to look elsewhere, expect single-tenant / working-renter base with shorter leases; 65% free/reduced lunch — lower-income household profile, screen leases tightly.
- Market conditions: 216 active listings in the ZIP; 2 comparable units currently listed for rent nearby; 4,354 units permitted in Sussex County in 2024 (344 in 5+ unit buildings).
Forward outlook
- Local home prices are declining (-3.0%/yr); year-one equity from $1k of loan paydown is wiped out by about $5k of value loss. Plan a longer hold.
- Sussex County population projected at +25% by 2050 — long-run rental-demand tailwind backs the buy-and-hold thesis.
- At projected returns (-3.0% appreciation + 3.0% rent growth), your $48k cash investment doubles in ~9 years — after that, you're playing with house money.
Negotiation context
- It's been on market 58 days — a 3% lower offer ($165k) is reasonable based on typical stale-listing flexibility.
Risks & watch-outs
- Watch-outs: built in 1900 — expect roof / HVAC / electrical / plumbing capex.
- Climate carrying-cost: major wind risk, 71% chance of damaging wind over 30y; extreme-heat days projected 7→16/yr by 2055 (HVAC capex compounding) — expect insurance premiums to compound above CPI over the hold.
Questions for the listing agent
- It's been on market 58 days. Have you received any prior offers? Is the seller open to a 3% concession, seller financing, or rate buy-down credit?
- Built in 1900 — when were the roof, HVAC, electrical panel, plumbing, and water heater last replaced?
- Is there a deadline driving the sale (1031 exchange, divorce, estate, relocation)? That informs how much negotiation room exists.
- Schools are F-rated, which usually means shorter tenancies and higher turnover. Who's the typical renter profile here, and what's been the actual vacancy rate?
- Crime grade is F in this area — have there been break-ins, vandalism, or insurance claims at this property in the last 3 years? What carrier currently insures it and at what premium?
- What's the average days-on-market for RENTAL listings here right now (not sales)? A rising rental-DOM trend means longer vacancies and softer asking-rent achievability than the comps imply.
- What's the recent tenant-quality profile in this submarket — average credit score on applications, eviction rate, late-payment / NSF rate, and stable-employment percentage? A property-management company in the area should have these aggregated.
- How much new for-sale + rental construction is in the pipeline within 1–3 miles? Heavy new supply typically softens prices + rents 12–24 months out; constrained supply supports both.
Investment metrics
- 1% rule
- 1.12% ✓
- Cap rate
- 9.90%
- Cash-on-cash
- 12.87%
- DSCR
- 1.57
- GRM
- 7.4
CMA / ARV
- ARV (median comp)
- $221,200
- List price
- $170,000
- Delta
- -23.15%
- Verdict
- UNDERPRICED
- Comps
- 20 within 1.0 mi
Show comp detail 12 sales within ~0.75 mi
| Address | Dist | Beds/Ba | Sqft | Sold | Price | $/sf | Match |
|---|---|---|---|---|---|---|---|
| 9 W High St | 0.18mi | 3/2.0 | 1,148 (-4%) | 3mo | $275,000 | $240 | 78 |
| 203 E 7th St | 0.25mi | 3/1.0 | 1,176 (-2%) | 9mo | $230,000 | $196 | 77 |
| 114 E 6th St | 0.15mi | 3/2.0 | 1,130 (-6%) | 12mo | $280,000 | $248 | 69 |
| 304 E 6th St | 0.34mi | 3/2.0 | 1,243 (+4%) | 8mo | $315,000 | $253 | 68 |
| 408 Summit Dr | 0.42mi | 3/2.0 | 1,270 (+6%) | 9mo | $315,000 | $248 | 59 |
| 303 E 5th St | 0.34mi | 3/2.0 | 1,270 (+6%) | 18mo | $306,000 | $241 | 55 |
| 114 N Conwell St | 0.55mi | 3/2.0 | 1,261 (+5%) | 11mo | $279,000 | $221 | 53 |
| 414 Summit Dr | 0.44mi | 3/2.0 | 1,266 (+6%) | 18mo | $310,000 | $245 | 51 |
| 209 N Pine St | 0.64mi | 3/2.0 | 1,300 (+8%) | 9mo | $249,900 | $192 | 44 |
| 533 E Poplar St | 0.69mi | 2/1.0 (-1) | 1,100 (-8%) | 5mo | $235,000 | $214 | 44 |
| 501 Highland Ct | 0.43mi | 3/2.0 | 1,360 (+13%) | 15mo | $312,500 | $230 | 41 |
| 321 E 6th St | 0.45mi | 3/2.0 | 1,378 (+15%) | 19mo | $319,000 | $231 | 34 |
Match score weights: distance 35% · size 25% · config 20% · recency 20%. Top-matched comps best support the ARV.
Projected returns pro-forma
-3.0% appreciation · 3.0% rent growth · sell at horizon
- IRR
- 2.7%
- Equity multiple
- 1.10×
- Total profit
- $4,900
- Equity at exit
- $25,348
- IRR
- 12.2%
- Equity multiple
- 1.96×
- Total profit
- $45,829
- Equity at exit
- $14,698
Cash invested: $47,600 (down + closing). Projections, not guarantees.
Landlord ↔ Tenant lean methodology
- Overall (STATE)
- 70 Landlord-Friendly
- State Delaware
- 70 Landlord-Friendly · D+7
- County
- — inherits STATE
- City
- — inherits STATE
ZIP-level market 19973
- Home prices YoY
- -17.8%
- Active inventory
- 216
- Price-to-rent
- 7.4×
Monthly cashflow live
- Estimated rent
- $1,911 medium interval (Pro) →
- Mortgage (P&I)
- −$891
- Tax from tax record
- −$37 /mo · $445/yr
- Insurance
- −$71
- HOA
- −$0
- Vacancy / Maint / Mgmt
- −$401
- Net cashflow
- $511
Break-even live
Sensitivity live
| Price | -10% $607 | -5% $559 | +0% $511 | +5% $463 | +10% $414 |
|---|---|---|---|---|---|
| Rent | -10% $360 | -5% $435 | +0% $511 | +5% $586 | +10% $662 |
| Rate | -1.0pp $596 | -0.5pp $554 | base $511 | +0.5pp $467 | +1.0pp $422 |
UW: 25.0% down · 7.5% · 30yr · 1.5% tax · 5.0% vac · 8.0% maint · 8.0% mgmt
Financing live
Cash to close
- Down payment
- $42,500
- Closing costs
- $5,100
- Reserves months
- —
- Total cash needed
- —
Loan-product check · same deal, 3 products live
Conventional
25% down · 7.5% · 30yr
- Down + closing
- —
- Monthly P&I
- —
- Monthly cashflow
- —
- DSCR
- —
- Eligible?
- —
Personal DTI + credit; lowest rate.
DSCR
20% down · 8.5% · 30yr
- Down + closing
- —
- Monthly P&I
- —
- Monthly cashflow
- —
- DSCR
- —
- Eligible?
- —
No personal income docs; deal must DSCR.
Hard money
10% down · 12.0% · 12mo
- Down + closing
- —
- Monthly P&I
- —
- Monthly cashflow
- —
- DSCR
- —
- Eligible?
- —
Short-term bridge; refi at stabilization.
Rent comps 2 comps
| Address | Beds | Baths | Sqft | Rent | $/sqft | DOM | Units | Dist |
|---|---|---|---|---|---|---|---|---|
| 701 Water St Seaford, DE | 1.0–3.0 | 1.0–2.0 | 1174 | $2,095 | $1.78 | 14d | 1 | 0.49mi |
| 604 Sussex Ave Unit B Seaford, DE | 2.0 | 1.0 | 792 | $1,100 | $1.39 | 22d | 1 | 1.45mi |
Listing history 19 events
-
2026-06-21days on market $170,000 Active 58 DOM
-
2026-06-18days on market $170,000 Active 56 DOM
-
2026-06-17days on market $170,000 Active 55 DOM
-
2026-06-16days on market $170,000 Active 54 DOM
-
2026-06-15days on market $170,000 Active 53 DOM
-
2026-06-13days on market $170,000 Active 51 DOM
-
2026-06-12days on market $170,000 Active 50 DOM
-
2026-06-09days on market $170,000 Active 47 DOM
-
2026-06-08days on market $170,000 Active 46 DOM
-
2026-06-07remarks 364-char remark
-
2026-06-07pricedays on market $170,000 Active 45 DOM
-
2026-06-04days on market $189,900 Active 41 DOM
-
2026-06-02days on market $189,900 Active 40 DOM
-
2026-06-01days on market $189,900 Active 39 DOM
-
2026-05-31days on market $189,900 Active 38 DOM
-
2026-05-31days on market $189,900 Active 37 DOM
-
2026-05-09price $189,900 402-char remark
Show marketing remark (402 chars)
Charming 100+-year-old home full of potential — ready for your touch of modern updates and personalization. Sited on a generous, park-like lot with * possible subdivision opportunity (buyer to verify with county concerning subdividing). Perfect for investors, visionaries, or anyone seeking historic charm and room to grow. Property is being sold as-is, inspection for information purposes only.
-
2026-04-24$199,900 Active 402-char remark
Show marketing remark (402 chars)
Charming 100+-year-old home full of potential — ready for your touch of modern updates and personalization. Sited on a generous, park-like lot with * possible subdivision opportunity (buyer to verify with county concerning subdividing). Perfect for investors, visionaries, or anyone seeking historic charm and room to grow. Property is being sold as-is, inspection for information purposes only.
-
2026-04-19historical $199,900 402-char remark
Show marketing remark (402 chars)
Charming 100+-year-old home full of potential — ready for your touch of modern updates and personalization. Sited on a generous, park-like lot with * possible subdivision opportunity (buyer to verify with county concerning subdividing). Perfect for investors, visionaries, or anyone seeking historic charm and room to grow. Property is being sold as-is, inspection for information purposes only.
ⓘ Source: listings_history table (triggers on properties + properties_extension) + one-shot
backfill from property_details.listing_events for pre-trigger history.
Tax reassessment forecast DE · Partial reset (capped growth)
- Current annual tax
- $445 · $37/mo
- Projected year-2 tax
- $715 · $60/mo
- Expected delta
- +$271/yr (+$23/mo · 60.9%)
ⓘ Screening estimate from a state-policy table — verify with the county assessor before closing.
Climate risk First Street
- Flood 1/10 Low FEMA zone X (unshaded) · 0% chance over 30 yrs
- Wildfire 1/10 Low
- Heat 8/10 Severe 7 d/yr ≥105°F today · 16 d/yr by 30 yrs out
- Wind 6/10 Major 71% chance of damaging wind over 30 yrs
- Air quality 3/10 Moderate 2 unhealthy d/yr today · 2 by 30 yrs out
Nearby sold comps map
Loading sold comps map…
Walkable amenities ~0.75 mi
Loading nearby amenities…
Taxation est. · year 1
- Rental income
- $22,938
- − Mortgage interest
- −$9,523
- − Property taxes
- −$445
- − Insurance
- −$850
- − Repairs & maintenance
- −$1,835
- − Management
- −$1,835
- − Depreciation
- −$4,945
- Taxable income
- $3,505
- Est. tax owed @ 24.0%
- −$841
- After-tax cash flow
- $5,287/yr
For passive investors: Depreciation is non-cash, so a rental often shows a tax loss while cash-flowing — sheltering income. Rental losses are passive: they offset passive income freely, and up to $25,000/yr can offset ordinary (W-2) income if you actively participate and your MAGI is under $100k (phasing out to $0 by $150k); unused losses carry forward. On sale, claimed depreciation is recaptured at up to 25%, and gains may owe capital-gains tax (a 1031 exchange can defer both). Figures are a year-1 estimate at your 24.0% rate — not tax advice; consult a CPA.
Schools (NCES district)
- District
- Seaford School District
- NCES district ID
- 1001530
- Math proficiency
- 25% ▼ -18.00%
- Reading proficiency
- 40% ▼ -12.00%
- Median HH income
- $48,427
- Composite
- 28.07/100
- National rank
- #6835
- State rank
- #15 of 26 in DE
Livability — Blades
- Score
- 67/100
- State rank
- #37
- US rank
- #10492
Category grades
Schools grade is shown separately in the Schools card above.
Census & demographics
- Census place
- Blades, DE
- Population (ZIP)
- 25,786
Population outlook (Sussex County) Hauer SSP2
- Today (2025)
- 248,853 people
- By 2030
- 264,464 · +6.3%
- By 2040
- 290,980 · +16.9%
- By 2050
- 311,259 · +25.1%
- By 2075
- 352,488 · +41.6%
- By 2100
- 367,406 · +47.6%
Race, ethnicity, and origin ACS 2023
- Neighborhood character
- Diverse neighborhood (Simpson 0.61)
- Race & ethnicity
- White 58% Black 20% Two or more races 13% Hispanic / Latino 11%
- Hispanic origin (detail)
- Mexican 5% Puerto Rican 1% Dominican 2%
- Common ancestry
- Hispanic 4% Romanian 3% Italian 2%
- Foreign-born
- 9% · Canada, Vietnam
- Languages at home
- 85% English-only · Spanish 8% French/Haitian/Cajun 5% Vietnamese 1%
Political lean MEDSL · Sussex
- 2024 margin
- R (+11.0) · D 43.9% · R 54.9% · Other 1.2%
- 2008→2024 swing
- -2.4pp toward R · 2008: -8.6pp · 2024: -11.0pp
- All cycles
- 2024: R+11.0 2020: R+11.2 2016: R+22.0 2012: R+13.0 2008: R+8.6
Not yet ingested
- Civics
- —
Market trends
- HPI YoY
- ▼ -62.40%
- Current HPI
- 288.5652
- Rent YoY
- —
- Metro
- —
- State GDP YoY
- —
- F500 in state
- 0
Price history
-5.0% since first listed3 events — show timeline
- 2026-05-09 Price Changed $189,900 BRIGHT MLS
- 2026-04-24 Listed $199,900 BRIGHT MLS
- 2026-04-19 Coming Soon $199,900 BRIGHT MLS
Property tax history
+13.7%/yrLatest (2025): $445 · +220.5% YoY. Source: county tax records.
Cash-flow waterfall
monthlySold comps — $/sqft
last 12 mo · ≤1 miLoading sold comps…