 🏗️ New Construction
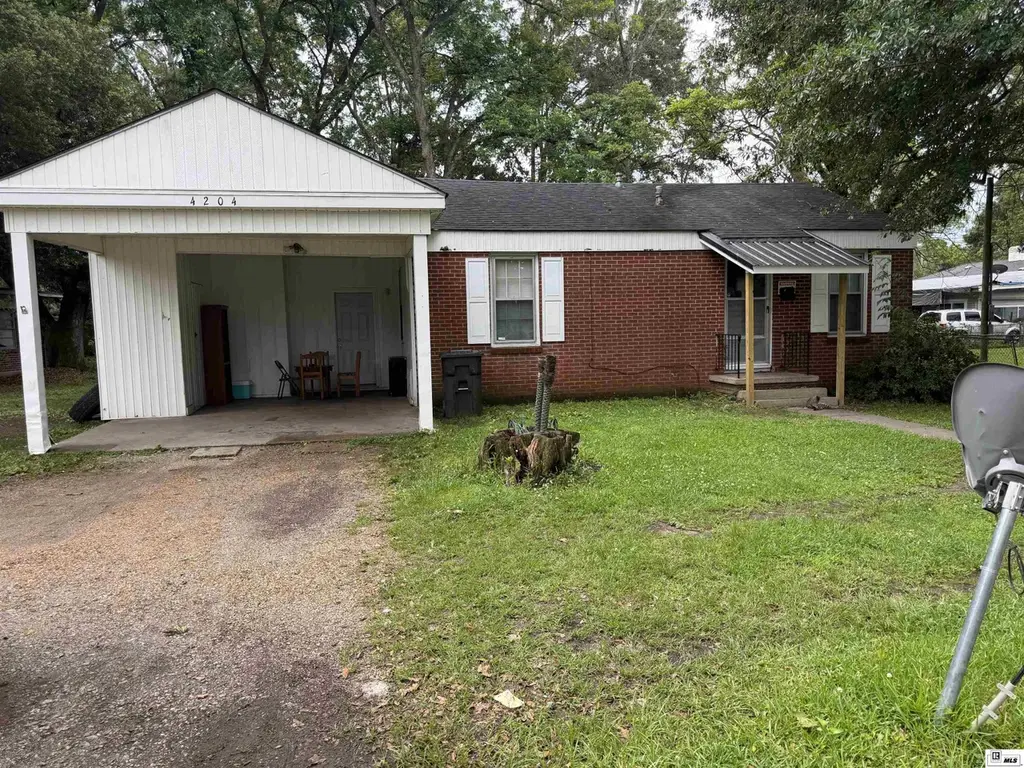
4204 Spurgeon Dr · Monroe, LA
Flood risk 1/10 · Minimal
- FEMA flood zone
- X (shaded)
- Chance of flooding over 30 yrs
- 0.0%
- Est. flood insurance / yr
- $507 – $1,088
Fire risk 1/10 · Minimal
- Est. fire insurance / yr
- $1,269 – $2,357
Heat risk 8/10 · Major
- Hot days now (above 112°F)
- 7 days/yr
- Hot days in 30 yrs
- 20 days/yr
Wind risk 6/10 · Moderate
- Chance of severe wind over 30 yrs
- 74.0%
Air-quality risk 1/10 · Minimal
- Unhealthy air days now
- 0 days/yr
- Unhealthy air days in 30 yrs
- 0 days/yr
Risk factors via First Street. Map © Google.
Why this score? — see what drove the B- grade
The composite is a weighted blend of 9 inputs, each scored 0–100. Each bar is that input's sub-score; the figure is the points it added to the 100-point composite (weight × sub-score).
- Cash flow +30.0/30.0
- DSCR +10.0/10.0
- 1% rule +8.5/10.0
- ARV discount +7.5/15.0
- Livability +3.3/5.0
- Rent growth +2.5/5.0
- Condition / age +2.5/5.0
- Schools +2.1/10.0
- Appreciation +0.0/10.0
$120,000
🖨 Deal sheet (PDF) 📄 Offer letter ✓ Due diligence
Listing remarks
Charming 3-bedroom, 1.5-bath home located in a desirable neighborhood less than one mile from University of Louisiana Monroe. The spacious backyard offers a great setting for outdoor entertaining, complete with a deck for relaxing and gathering with family and friends. Additional features include a double carport and convenient access to shopping, dining, and the university. Whether you’re a first-time homebuyer, investor, or looking for a rental property opportunity, this home offers excellent potential in a prime location.
Key facts
- Spacious backyard
- Deck for relaxing
- Double carport
Tags
Property features AI
Finance
- Other: Subdivision: SHERROUSE PARK
- HOA & community: No association amenities
Exterior
- Parking: 2-car garage; Has carport
- Utilities: Public water; Public sewer; Natural gas available and connected
- Home design: Single-family residence (site build); One story; Entry level: 1; New construction; Proposed development status
- Construction: Brick veneer construction; Pillar/post/pier foundation
- Exterior features: No fencing; Lot features: Other
Interior
- Kitchen: Refrigerator
- Bedrooms: 3 main-level bedrooms
- Bathrooms: 1 full bathroom; 1 half bathroom; 2 main-level bathrooms; 1 partial bathroom
- Heating & cooling: Central heating; Central air conditioning
- Interior features: Refrigerator; Electric water heater; No fireplace
- Laundry & utility: Electric water heater
Neighborhood map
What this means for you Summary
Snapshot
- This is a 2-bed/1.0-bath single-family listed at $120k.
Deal economics
- At list price, monthly cash flow is $440 ($5k/yr) — positive.
- The deal already cash-flows at list — no discount required.
- Meets the 1% rule at list price ($1k rent vs $120k).
- Cap rate 11.9% vs local median 5.8% in Monroe — top-decile yield for the area; either an underpriced asset or a hidden risk that comps aren't pricing in. Stress-test before assuming the spread holds.
Location & tenants
- Location reads 66/100 on livability (#128 in LA) — a middle-class / working-renter tenant base. Strengths: cost of living A+, health & safety A+; Watch: crime F, amenities F, commute F.
- City Of Monroe School District (urban): math 21% / reading 31% proficiency, ranked #60 of 98 in LA (top 61%) — low school quality limits family demand, transient renter base, plan for 1-2y turnover; 82% free/reduced lunch — lower-income household profile, screen leases tightly.
- Zoned schools: J.S. Clark Magnet Elementary School (math 41% / reading 52%, grade D-, #159 of 646 statewide, top 25%, 462 students, 66% FRL); Carroll Junior High School (math 4% / reading 18%, grade F, #195 of 218 statewide, top 90%, 335 students, 88% FRL); Carroll High School (math 8% / reading 17%, grade F, #230 of 265 statewide, top 88%, 609 students, 84% FRL) — zoned schools at 79% FRL track the district average.
- Market conditions: 440 active listings in the ZIP; 345 units permitted in Ouachita Parish in 2024 (0 in 5+ unit buildings).
Forward outlook
- Local home prices are declining (-3.0%/yr); year-one equity from $649 of loan paydown is wiped out by about $3k of value loss. Plan a longer hold.
- At projected returns (-3.0% appreciation + 3.0% rent growth), your $26k cash investment doubles in ~7 years — after that, you're playing with house money.
Negotiation context
- Only 9 days on market — expect competitive offers; lowballing is unlikely to land.
Risks & watch-outs
- Watch-outs: built in 1950 — expect roof / HVAC / electrical / plumbing capex.
- Climate carrying-cost: major wind risk, 74% chance of damaging wind over 30y; extreme-heat days projected 7→20/yr by 2055 (HVAC capex compounding) — expect insurance premiums to compound above CPI over the hold.
Questions for the listing agent
- Built in 1950 — when were the roof, HVAC, electrical panel, plumbing, and water heater last replaced?
- Is there a deadline driving the sale (1031 exchange, divorce, estate, relocation)? That informs how much negotiation room exists.
- Crime grade is F in this area — have there been break-ins, vandalism, or insurance claims at this property in the last 3 years? What carrier currently insures it and at what premium?
- What's the average days-on-market for RENTAL listings here right now (not sales)? A rising rental-DOM trend means longer vacancies and softer asking-rent achievability than the comps imply.
- What's the recent tenant-quality profile in this submarket — average credit score on applications, eviction rate, late-payment / NSF rate, and stable-employment percentage? A property-management company in the area should have these aggregated.
- How much new for-sale + rental construction is in the pipeline within 1–3 miles? Heavy new supply typically softens prices + rents 12–24 months out; constrained supply supports both.
Investment metrics
- 1% rule
- 1.35% ✓
- Cap rate
- 11.92%
- Cash-on-cash
- 20.09%
- DSCR
- 1.89
- GRM
- 6.2
CMA / ARV
- ARV (on-the-fly)
- $93,873
- Comps found
- 4
Show comp detail 4 sales within ~0.75 mi
| Address | Dist | Beds/Ba | Sqft | Sold | Price | $/sf | Match |
|---|---|---|---|---|---|---|---|
| 303 N Mcguire Ave | 0.50mi | 3/2.0 (+1) | 1,100 (+2%) | 7mo | $120,000 | $109 | 59 |
| 502 Darbonne St | 0.29mi | 3/1.0 (+1) | 1,150 (+7%) | 16mo | $97,000 | $84 | 57 |
| 303 Columbia Ave | 0.41mi | 3/1.5 (+1) | 1,202 (+11%) | 2mo | $36,000 | $30 | 54 |
| 3404 Grammont St | 0.56mi | 2/1.0 | 921 (-15%) | 2mo | $80,000 | $87 | 48 |
Match score weights: distance 35% · size 25% · config 20% · recency 20%. Top-matched comps best support the ARV.
Projected returns pro-forma
-3.0% appreciation · 3.0% rent growth · sell at horizon
- IRR
- 12.2%
- Equity multiple
- 1.49×
- Total profit
- $12,774
- Equity at exit
- $13,997
- IRR
- 21.1%
- Equity multiple
- 2.79×
- Total profit
- $47,057
- Equity at exit
- $8,116
Cash invested: $26,284 (down + closing). Projections, not guarantees.
Landlord ↔ Tenant lean methodology
- Overall (STATE)
- 90 Strongly Landlord-Friendly
- State Louisiana
- 90 Strongly Landlord-Friendly · R+12
- County
- — inherits STATE
- City
- — inherits STATE
ZIP-level market 71203
- Home prices YoY
- -32.4%
- Active inventory
- 440
- Price-to-rent
- 7.9×
Monthly cashflow live
- Estimated rent
- $1,263 medium interval (Pro) →
- Mortgage (P&I)
- −$492
- Tax from tax record
- −$26 /mo · $315/yr
- Insurance
- −$39
- HOA
- −$0
- Vacancy / Maint / Mgmt
- −$265
- Net cashflow
- $440
Break-even live
Sensitivity live
| Price | -10% $493 | -5% $467 | +0% $440 | +5% $413 | +10% $387 |
|---|---|---|---|---|---|
| Rent | -10% $340 | -5% $390 | +0% $440 | +5% $490 | +10% $540 |
| Rate | -1.0pp $487 | -0.5pp $464 | base $440 | +0.5pp $416 | +1.0pp $391 |
UW: 25.0% down · 7.5% · 30yr · 1.5% tax · 5.0% vac · 8.0% maint · 8.0% mgmt
Financing live
Cash to close
- Down payment
- $23,468
- Closing costs
- $2,816
- Reserves months
- —
- Total cash needed
- —
Loan-product check · same deal, 3 products live
Conventional
25% down · 7.5% · 30yr
- Down + closing
- —
- Monthly P&I
- —
- Monthly cashflow
- —
- DSCR
- —
- Eligible?
- —
Personal DTI + credit; lowest rate.
DSCR
20% down · 8.5% · 30yr
- Down + closing
- —
- Monthly P&I
- —
- Monthly cashflow
- —
- DSCR
- —
- Eligible?
- —
No personal income docs; deal must DSCR.
Hard money
10% down · 12.0% · 12mo
- Down + closing
- —
- Monthly P&I
- —
- Monthly cashflow
- —
- DSCR
- —
- Eligible?
- —
Short-term bridge; refi at stabilization.
Listing history 8 events
-
2026-06-21days on market $120,000 Active 9 DOM
-
2026-06-19days on market $120,000 Active 7 DOM
-
2026-06-18days on market $120,000 Active 6 DOM
-
2026-06-17days on market $120,000 Active 5 DOM
-
2026-06-16days on market $120,000 Active 4 DOM
-
2026-06-15days on market $120,000 Active 3 DOM
-
2026-06-13remarks 530-char remark
-
2026-06-13$120,000 Active 1 DOM
ⓘ Source: listings_history table (triggers on properties + properties_extension) + one-shot
backfill from property_details.listing_events for pre-trigger history.
Tax reassessment forecast LA · Resets to sale price
- Current annual tax
- $315 · $26/mo
- Projected year-2 tax
- $660 · $55/mo
- Expected delta
- +$345/yr (+$29/mo · 109.7%)
ⓘ Screening estimate from a state-policy table — verify with the county assessor before closing.
Climate risk First Street
- Flood 1/10 Low FEMA zone X (shaded) · 0% chance over 30 yrs
- Wildfire 1/10 Low
- Heat 8/10 Severe 7 d/yr ≥112°F today · 20 d/yr by 30 yrs out
- Wind 6/10 Major 74% chance of damaging wind over 30 yrs
- Air quality 1/10 Low 0 unhealthy d/yr today · 0 by 30 yrs out
Nearby sold comps map
Loading sold comps map…
Walkable amenities ~0.75 mi
Loading nearby amenities…
Taxation est. · year 1
- Rental income
- $15,153
- − Mortgage interest
- −$5,258
- − Property taxes
- −$315
- − Insurance
- −$469
- − Repairs & maintenance
- −$1,212
- − Management
- −$1,212
- − Depreciation
- −$2,731
- Taxable income
- $3,956
- Est. tax owed @ 24.0%
- −$949
- After-tax cash flow
- $4,330/yr
For passive investors: Depreciation is non-cash, so a rental often shows a tax loss while cash-flowing — sheltering income. Rental losses are passive: they offset passive income freely, and up to $25,000/yr can offset ordinary (W-2) income if you actively participate and your MAGI is under $100k (phasing out to $0 by $150k); unused losses carry forward. On sale, claimed depreciation is recaptured at up to 25%, and gains may owe capital-gains tax (a 1031 exchange can defer both). Figures are a year-1 estimate at your 24.0% rate — not tax advice; consult a CPA.
Schools (NCES district)
- District
- City Of Monroe School District
- NCES district ID
- 2201080
- Math proficiency
- 21% ▼ -36.00%
- Reading proficiency
- 31% ▼ -34.00%
- Median HH income
- $28,751
- Composite
- 20.82/100
- National rank
- #8505
- State rank
- #60 of 98 in LA
Livability — Monroe
- Score
- 66/100
- State rank
- #128
- US rank
- #11948
Category grades
Schools grade is shown separately in the Schools card above.
Census & demographics
- Census place
- Monroe, LA
- County
- Ouachita Parish · 118,340 people
- Metro
- Monroe, LA
- Population (ZIP)
- 38,354
- Household income
- $52,326
- Rent vs Own
- Severe rent burden
- 2085.0
Population outlook (Ouachita County) Hauer SSP2
- Today (2025)
- 163,370 people
- By 2030
- 165,520 · +1.3%
- By 2040
- 167,652 · +2.6%
- By 2050
- 166,699 · +2.0%
- By 2075
- 156,348 · -4.3%
- By 2100
- 134,102 · -17.9%
Race, ethnicity, and origin ACS 2023
- Neighborhood character
- Diverse neighborhood (Simpson 0.57)
- Race & ethnicity
- Black 48% White 45% Two or more races 4% Hispanic / Latino 3% Asian 1%
- Common ancestry
- Lithuanian 3% Slovak 1% Serbian 1%
- Foreign-born
- 3% · Canada
- Languages at home
- 96% English-only · Spanish 2% Other Indo-European 1%
Political lean MEDSL · Ouachita
- 2024 margin
- Strong R (+27.9) · D 35.5% · R 63.3% · Other 1.2%
- 2008→2024 swing
- -2.7pp toward R · 2008: -25.2pp · 2024: -27.9pp
- All cycles
- 2024: R+27.9 2020: R+23.6 2016: R+25.4 2012: R+20.9 2008: R+25.2
Not yet ingested
- Civics
- —
Market trends
- HPI YoY
- ▼ -99.01%
- Current HPI
- 206.1948
- Rent YoY
- —
- Metro
- Monroe, LA
- State GDP YoY
- ▲ 3.29%
- F500 in state
- 10
Industry mix (Fortune 500 HQ in LA)
| Industry | F500 HQs | Revenue |
|---|---|---|
| Telecommunications | 2 | $23B |
|
||
| Utilities | 1 | $12B |
|
||
| Wholesale / Distribution | 1 | $5B |
|
||
| Advertising | 1 | $2B |
|
||
Price history
1 event — show timeline
- 2026-06-12 Listed $120,000 NELABOR
Property tax history
-0.1%/yrLatest (2025): $315 · -0.1% YoY. Source: county tax records.
Cash-flow waterfall
monthlySold comps — $/sqft
last 12 mo · ≤1 miLoading sold comps…