 Multi-family
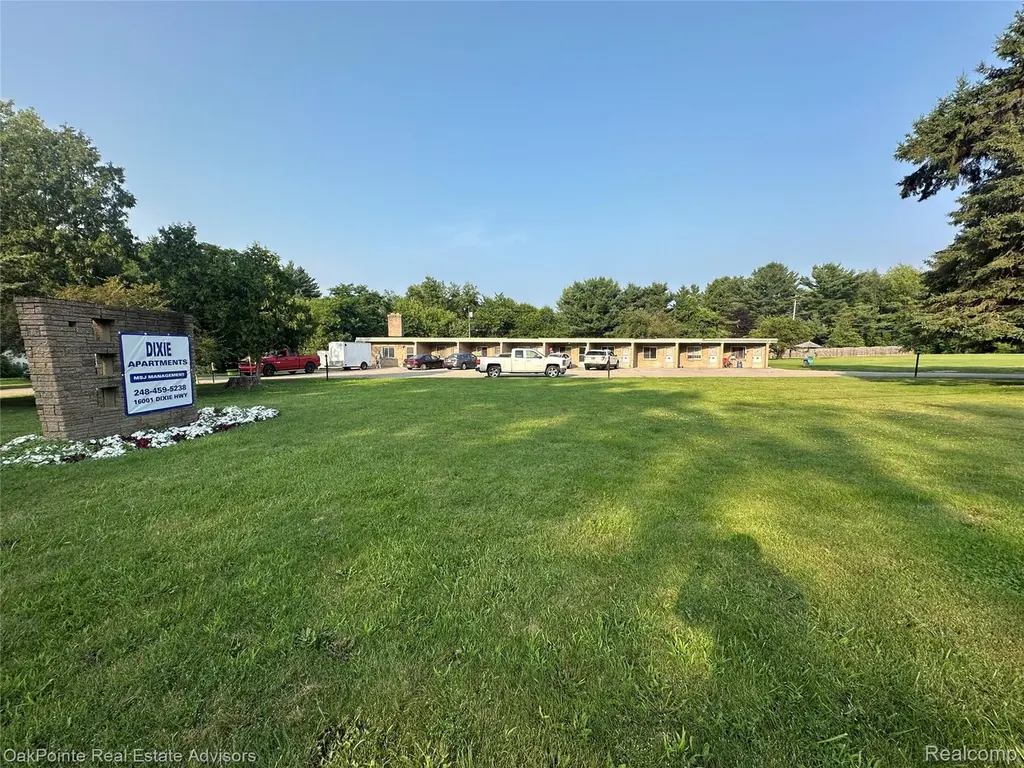
16001 Dixie Hwy · Holly, MI
Flood risk No data
- FEMA flood zone
- —
- Chance of flooding over 30 yrs
- —
- Est. flood insurance / yr
- —
Fire risk No data
- Est. fire insurance / yr
- —
Heat risk No data
- Hot days now (above threshold)
- —
- Hot days in 30 yrs
- —
Wind risk No data
- Chance of severe wind over 30 yrs
- —
Air-quality risk No data
- Unhealthy air days now
- —
- Unhealthy air days in 30 yrs
- —
Risk factors via First Street. Map © Google.
Why this score? — see what drove the C+ grade
The composite is a weighted blend of 9 inputs, each scored 0–100. Each bar is that input's sub-score; the figure is the points it added to the 100-point composite (weight × sub-score).
- Cash flow +24.7/30.0
- DSCR +8.0/10.0
- ARV discount +7.5/15.0
- 1% rule +6.4/10.0
- Livability +3.8/5.0
- Condition / age +3.8/5.0
- Schools +3.7/10.0
- Rent growth +2.5/5.0
- Appreciation +0.0/10.0
$900,000
🖨 Deal sheet 📄 Offer letter ✓ Due diligence
Multi-family units
County records classify this as Multi-Family (5+ Unit). Listing-text estimate: 1 unit. estimate disagrees with records
5+ unit building — per-unit beds/baths from public records are typically unavailable; the breakdown below (if shown) is an estimate from the listing text.
Listing remarks MLS
This cash flowing multifamily property is located in Holly, Michigan. The property consists of nine efficiency units on approximately 2.20 acres across two parcels with excess land and commercial zoning (buyer to verify). Units are in constant demand due to limited available housing supply in the submarket. In 2025, 7 of the 9 units were renovated. Average rents are approximately $1,085 per unit per month. The asking price reflects both the excess land value and a 7.97% cap rate on in-place financials. Owner pays water, gas, and trash; electric separately metered. Do not disturb tenants. Contact listing broker for financials.
Key facts
- Flexible zoning
- Multifamily property
- 2.2 acre lot
Tags
Neighborhood map
What this means for you Summary
Snapshot
- This is a ?-bed/9.0-bath multifamily listed at $900k. Condition is rated good.
Deal economics
- At list price, monthly cash flow is $2k ($23k/yr) — positive.
- The deal already cash-flows at list — no discount required.
- Meets the 1% rule at list price ($10k rent vs $900k).
- Recommended offer: $846k (6.0% below list) — sets the bar for market timing.
- Cap rate 8.8% vs local median 3.6% in Holly — top-decile yield for the area; either an underpriced asset or a hidden risk that comps aren't pricing in. Stress-test before assuming the spread holds.
Location & tenants
- Location reads 75/100 on livability (#156 in MI, #3,930 nationally) — a middle-class / working-renter tenant base. Strengths: crime A+, cost of living A+, housing A+; Watch: amenities F, commute F, employment D-.
- Holly Area School District (town): math 31% / reading 52% proficiency, ranked #165 of 540 in MI (top 31%) — families likely to look elsewhere, expect single-tenant / working-renter base with shorter leases.
- Market conditions: 153 active listings in the ZIP; solid renter incomes; 2,614 units permitted in Oakland County in 2024 (721 in 5+ unit buildings).
- At $10,252/mo this rent would consume 142% of the median local household income ($87k/yr) (locally 532% of renters already pay >50% of income on rent) — very limited rent-growth headroom before tenants either downsize or default.
Forward outlook
- Local home prices are declining (-3.0%/yr); year-one equity from $6k of loan paydown is wiped out by about $27k of value loss. Plan a longer hold.
- Oakland County population projected at +10% by 2050 — modest demand growth; plan on rents tracking national, not racing it.
Negotiation context
- It's been on market 75 days — a 6% lower offer ($846k) is reasonable based on typical stale-listing flexibility.
- 2 sale attempts; this cycle's ask has dropped $65k (7%) from the opening price — seller is motivated, your offer sets the floor, not the list.
Risks & watch-outs
- Watch-outs: built in 1950 — expect roof / HVAC / electrical / plumbing capex.
Questions for the listing agent
- It's been on market 75 days. Have you received any prior offers? Is the seller open to a 6% concession, seller financing, or rate buy-down credit?
- Built in 1950 — when were the roof, HVAC, electrical panel, plumbing, and water heater last replaced?
- Why hasn't it sold? Are there any deal-killer items the seller is aware of (foundation, flood, title, zoning, code violations)?
- Is there a deadline driving the sale (1031 exchange, divorce, estate, relocation)? That informs how much negotiation room exists.
- What's the average days-on-market for RENTAL listings here right now (not sales)? A rising rental-DOM trend means longer vacancies and softer asking-rent achievability than the comps imply.
- What's the recent tenant-quality profile in this submarket — average credit score on applications, eviction rate, late-payment / NSF rate, and stable-employment percentage? A property-management company in the area should have these aggregated.
- How much new apartment / multifamily construction is in the pipeline within 1–3 miles? Heavy new supply (>2% of stock underway) typically softens rents 12–24 months out; light construction supports rent growth.
Investment metrics
- 1% rule
- 1.14% ✓
- Cap rate
- 8.80%
- Cash-on-cash
- 8.95%
- DSCR
- 1.40
- GRM
- 7.3
CMA / ARV
No comps found within radius.
Projected returns pro-forma
-3.0% appreciation · 3.0% rent growth · sell at horizon
- IRR
- -2.7%
- Equity multiple
- 0.90×
- Total profit
- $-25,985
- Equity at exit
- $134,193
- IRR
- 7.0%
- Equity multiple
- 1.52×
- Total profit
- $132,133
- Equity at exit
- $77,816
Cash invested: $252,000 (down + closing). Projections, not guarantees.
Landlord ↔ Tenant lean methodology
- Overall (STATE)
- 62 Landlord-Friendly
- State Michigan
- 62 Landlord-Friendly · EVEN
- County
- — inherits STATE
- City
- — inherits STATE
ZIP-level market 48442
- Active inventory
- 153
- Price-to-rent
- 65.8×
Monthly cashflow live
- Estimated rent
- $10,252 medium interval (Pro) →
- Mortgage (P&I)
- −$4,720
- Tax est. 1.5%
- −$1,125 /mo · $13,500/yr
- Insurance
- −$375
- HOA
- −$0
- Vacancy / Maint / Mgmt
- −$2,153
- Net cashflow
- $1,879
Break-even live
9-unit breakdown (identical units grouped — click to expand)
| Units | Beds | Baths | Est. rent |
|---|---|---|---|
| 9× units | 1 | 1 | $10,251 |
| #1 | 1 | 1 | $1,139 |
| #2 | 1 | 1 | $1,139 |
| #3 | 1 | 1 | $1,139 |
| #4 | 1 | 1 | $1,139 |
| #5 | 1 | 1 | $1,139 |
| #6 | 1 | 1 | $1,139 |
| #7 | 1 | 1 | $1,139 |
| #8 | 1 | 1 | $1,139 |
| #9 | 1 | 1 | $1,139 |
| Total (9 units) | $10,252 | ||
UW: 25.0% down · 7.5% · 30yr · 1.5% tax · 5.0% vac · 8.0% maint · 8.0% mgmt
Financing live
Cash to close
- Down payment
- $225,000
- Closing costs
- $27,000
- Reserves months
- —
- Total cash needed
- —
Loan-product check · same deal, 3 products live
Conventional
25% down · 7.5% · 30yr
- Down + closing
- —
- Monthly P&I
- —
- Monthly cashflow
- —
- DSCR
- —
- Eligible?
- —
Personal DTI + credit; lowest rate.
DSCR
20% down · 8.5% · 30yr
- Down + closing
- —
- Monthly P&I
- —
- Monthly cashflow
- —
- DSCR
- —
- Eligible?
- —
No personal income docs; deal must DSCR.
Hard money
10% down · 12.0% · 12mo
- Down + closing
- —
- Monthly P&I
- —
- Monthly cashflow
- —
- DSCR
- —
- Eligible?
- —
Short-term bridge; refi at stabilization.
Listing history 6 events
-
2026-05-05status Pending 633-char remark
Show marketing remark (633 chars)
This cash flowing multifamily property is located in Holly, Michigan. The property consists of nine efficiency units on approximately 2.20 acres across two parcels with excess land and commercial zoning (buyer to verify). Units are in constant demand due to limited available housing supply in the submarket. In 2025, 7 of the 9 units were renovated. Average rents are approximately $1,085 per unit per month. The asking price reflects both the excess land value and a 7.97% cap rate on in-place financials. Owner pays water, gas, and trash; electric separately metered. Do not disturb tenants. Contact listing broker for financials.
-
2026-03-13price $900,000 633-char remark
Show marketing remark (633 chars)
This cash flowing multifamily property is located in Holly, Michigan. The property consists of nine efficiency units on approximately 2.20 acres across two parcels with excess land and commercial zoning (buyer to verify). Units are in constant demand due to limited available housing supply in the submarket. In 2025, 7 of the 9 units were renovated. Average rents are approximately $1,085 per unit per month. The asking price reflects both the excess land value and a 7.97% cap rate on in-place financials. Owner pays water, gas, and trash; electric separately metered. Do not disturb tenants. Contact listing broker for financials.
-
2026-02-19$965,000 Active 633-char remark
Show marketing remark (633 chars)
This cash flowing multifamily property is located in Holly, Michigan. The property consists of nine efficiency units on approximately 2.20 acres across two parcels with excess land and commercial zoning (buyer to verify). Units are in constant demand due to limited available housing supply in the submarket. In 2025, 7 of the 9 units were renovated. Average rents are approximately $1,085 per unit per month. The asking price reflects both the excess land value and a 7.97% cap rate on in-place financials. Owner pays water, gas, and trash; electric separately metered. Do not disturb tenants. Contact listing broker for financials.
ⓘ Source: listings_history table (triggers on properties + properties_extension) + one-shot
backfill from property_details.listing_events for pre-trigger history.
Nearby sold comps map
Loading sold comps map…
Walkable amenities ~0.75 mi
Loading nearby amenities…
Taxation est. · year 1
- Rental income
- $123,024
- − Mortgage interest
- −$50,414
- − Property taxes
- −$13,500
- − Insurance
- −$4,500
- − Repairs & maintenance
- −$9,842
- − Management
- −$9,842
- − Depreciation
- −$26,182
- Taxable income
- $8,744
- Est. tax owed @ 24.0%
- −$2,099
- After-tax cash flow
- $20,454/yr
For passive investors: Depreciation is non-cash, so a rental often shows a tax loss while cash-flowing — sheltering income. Rental losses are passive: they offset passive income freely, and up to $25,000/yr can offset ordinary (W-2) income if you actively participate and your MAGI is under $100k (phasing out to $0 by $150k); unused losses carry forward. On sale, claimed depreciation is recaptured at up to 25%, and gains may owe capital-gains tax (a 1031 exchange can defer both). Figures are a year-1 estimate at your 24.0% rate — not tax advice; consult a CPA.
Condition & rehab AI · 3 photos
This multi-family property is in good condition with cosmetic updates. Further interior and exterior improvements can significantly enhance its value.
Value-add opportunities
- Both Landscaping improvements — Enhanced landscaping can improve curb appeal and attract more tenants.
- Both Interior updates — Updating the interiors can increase the property's appeal and value, both for resale and rental.
- Both Exterior maintenance — Maintaining the exterior can improve the property's overall appearance and attract more tenants.
- Rental HVAC maintenance — Ensuring the HVAC systems are in good condition can reduce maintenance costs and attract tenants who value comfort and energy efficiency.
Renovation cost estimate screening
Value-add ROI direction
- Both Landscaping improvements — Enhanced landscaping can improve curb appeal and attract more tenants. ↑
- Both Interior updates — Updating the interiors can increase the property's appeal and value, both for resale and rental. ↑
- Both Exterior maintenance — Maintaining the exterior can improve the property's overall appearance and attract more tenants. ↑
- Rental HVAC maintenance — Ensuring the HVAC systems are in good condition can reduce maintenance costs and attract tenants who value comfort and energy efficiency. ↑
ⓘ Cost ranges are severity-bucket heuristics (US national rule-of-thumb). Get contractor quotes + a written scope before underwriting a rehab budget.
Schools (NCES district)
- District
- Holly Area School District
- NCES district ID
- 2618450
- Math proficiency
- 31% ▼ -12.00%
- Reading proficiency
- 52% ▼ -7.00%
- Median HH income
- $65,137
- Composite
- 37.1/100
- National rank
- #4496
- State rank
- #165 of 540 in MI
Livability — Holly
- Score
- 75/100
- State rank
- #156
- US rank
- #3930
Category grades
Schools grade is shown separately in the Schools card above.
Census & demographics
- County
- Oakland County · 1,009,092 people
- City population
- 22,788
- Metro
- Detroit-Warren-Dearborn, MI
- Population (ZIP)
- 22,788
- Household income
- $86,575
- Rent vs Own
- Severe rent burden
- 532.0
Population outlook (Oakland County) Hauer SSP2
- Today (2025)
- 1,335,747 people
- By 2030
- 1,375,100 · +2.9%
- By 2040
- 1,435,385 · +7.5%
- By 2050
- 1,469,250 · +10.0%
- By 2075
- 1,531,946 · +14.7%
- By 2100
- 1,450,485 · +8.6%
Race, ethnicity, and origin ACS 2023
- Neighborhood character
- Predominantly White (89%)
- Race & ethnicity
- White 89% Two or more races 6% Hispanic / Latino 3% Black 3%
- Common ancestry
- Romanian 8% Slovak 4% Lithuanian 3%
- Foreign-born
- 4% · Canada
- Languages at home
- 96% English-only · Spanish 1% Russian/Polish/Slavic 1% Arabic 1%
Political lean MEDSL · Oakland
- 2024 margin
- D (+10.6) · D 54.4% · R 43.8% · Other 1.9%
- 2008→2024 swing
- -3.9pp toward R · 2008: 14.5pp · 2024: 10.6pp
- All cycles
- 2024: D+10.6 2020: D+14.1 2016: D+8.1 2012: D+8.1 2008: D+14.5
Not yet ingested
- Civics
- —
Market trends
- HPI YoY
- ▼ -229.30%
- Current HPI
- 227.7078
- Rent YoY
- —
- Metro
- Detroit-Warren-Dearborn, MI
- State GDP YoY
- ▲ 1.37%
- F500 in state
- 28
Industry mix (Fortune 500 HQ in MI)
| Industry | F500 HQs | Revenue |
|---|---|---|
| Automotive Parts | 3 | $48B |
|
||
| Automotive | 2 | $372B |
|
||
| Chemicals | 1 | $45B |
|
||
| Automotive Retail | 1 | $29B |
|
||
| Healthcare / Medical Devices | 1 | $23B |
|
||
| Automotive Technology | 1 | $20B |
|
||
Price history
-6.7% since first listed6 events — show timeline
- 2026-05-05 Pending — MiRealSource-MiMLS
- 2026-05-05 Pending — REALCOMP
- 2026-03-13 Price Changed $900,000 MiRealSource-MiMLS
- 2026-03-13 Price Changed $900,000 REALCOMP
- 2026-02-19 Listed $965,000 REALCOMP
- 2026-02-19 Listed $965,000 MiRealSource-MiMLS
Cash-flow waterfall
monthlySold comps — $/sqft
last 12 mo · ≤1 miLoading sold comps…