10 Aqueduct Dr · Diamond, IL
Flood risk No data
- FEMA flood zone
- —
- Chance of flooding over 30 yrs
- —
- Est. flood insurance / yr
- —
Fire risk No data
- Est. fire insurance / yr
- —
Heat risk No data
- Hot days now (above threshold)
- —
- Hot days in 30 yrs
- —
Wind risk No data
- Chance of severe wind over 30 yrs
- —
Air-quality risk No data
- Unhealthy air days now
- —
- Unhealthy air days in 30 yrs
- —
Risk factors via First Street. Map © Google.
Why this score? — see what drove the C grade
The composite is a weighted blend of 9 inputs, each scored 0–100. Each bar is that input's sub-score; the figure is the points it added to the 100-point composite (weight × sub-score).
- Cash flow +22.9/30.0
- ARV discount +7.5/15.0
- DSCR +7.3/10.0
- 1% rule +6.0/10.0
- Schools +4.3/10.0
- Condition / age +4.0/5.0
- Livability +3.2/5.0
- Rent growth +2.5/5.0
- Appreciation +0.0/10.0
$134,999
🖨 Deal sheet 📄 Offer letter ✓ Due diligence
Listing remarks MLS
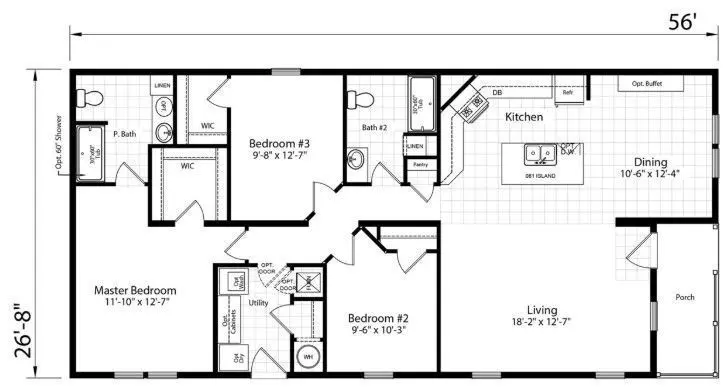
Welcome to this brand new, 3 bed/2 bath home that offers the perfect blend of comfort, affordability, and modern living. This home boasts an open floor plan, new appliances, and access to community amenities. Don't miss out on the chance to make this charming and affordable residence your own. Schedule a showing today! * All photos and renderings shown are for illustration purposes only. Actual home may vary.
Key facts
- Built 2025
- Listed 238 days
Neighborhood map
What this means for you Summary
Snapshot
- This is a 3-bed/2.0-bath manufactured listed at $135k. Condition is rated good.
Deal economics
- At list price, monthly cash flow is $236 ($3k/yr) — positive.
- The deal already cash-flows at list — no discount required.
- Meets the 1% rule at list price ($1k rent vs $135k).
- Recommended offer: $119k (12.0% below list) — sets the bar for market timing.
Location & tenants
- Location reads 64/100 on livability (#697 in IL) — a middle-class / working-renter tenant base. Strengths: crime A+, cost of living A+, housing B; Watch: health & safety C-, schools F, amenities F.
- Coal City CUSD 1 (town): math 46% / reading 50% proficiency, ranked #65 of 620 in IL (top 10%) — families likely to look elsewhere, expect single-tenant / working-renter base with shorter leases.
- Market conditions: 42 active listings in the ZIP; 3 comparable units currently listed for rent nearby; rentals leasing fast (median 3d on market — plan ~1-2 weeks tenant-placement turnaround); 84 units permitted in Grundy County in 2024 (0 in 5+ unit buildings).
Forward outlook
- Local home prices are declining (-3.0%/yr); year-one equity from $933 of loan paydown is wiped out by about $4k of value loss. Plan a longer hold.
- Grundy County population projected to shrink 9% by 2050 — rents likely to lag national; underwrite the cash flow, not the appreciation.
Negotiation context
- It's been on market 239 days — a 12% lower offer ($119k) is reasonable based on typical stale-listing flexibility.
Questions for the listing agent
- It's been on market 239 days. Have you received any prior offers? Is the seller open to a 12% concession, seller financing, or rate buy-down credit?
- Why hasn't it sold? Are there any deal-killer items the seller is aware of (foundation, flood, title, zoning, code violations)?
- Is there a deadline driving the sale (1031 exchange, divorce, estate, relocation)? That informs how much negotiation room exists.
- Schools are F-rated, which usually means shorter tenancies and higher turnover. Who's the typical renter profile here, and what's been the actual vacancy rate?
- What's the average days-on-market for RENTAL listings here right now (not sales)? A rising rental-DOM trend means longer vacancies and softer asking-rent achievability than the comps imply.
- What's the recent tenant-quality profile in this submarket — average credit score on applications, eviction rate, late-payment / NSF rate, and stable-employment percentage? A property-management company in the area should have these aggregated.
- How much new for-sale + rental construction is in the pipeline within 1–3 miles? Heavy new supply typically softens prices + rents 12–24 months out; constrained supply supports both.
Investment metrics
- 1% rule
- 1.10% ✓
- Cap rate
- 8.39%
- Cash-on-cash
- 7.50%
- DSCR
- 1.33
- GRM
- 7.6
CMA / ARV
No comps found within radius.
Projected returns pro-forma
-3.0% appreciation · 3.0% rent growth · sell at horizon
- IRR
- -4.8%
- Equity multiple
- 0.82×
- Total profit
- $-6,807
- Equity at exit
- $20,129
- IRR
- 4.9%
- Equity multiple
- 1.36×
- Total profit
- $13,537
- Equity at exit
- $11,672
Cash invested: $37,800 (down + closing). Projections, not guarantees.
Landlord ↔ Tenant lean methodology
- Overall (STATE)
- 43 Moderately Tenant-Leaning
- State Illinois
- 43 Moderately Tenant-Leaning · D+7
- County
- — inherits STATE
- City
- — inherits STATE
ZIP-level market 60416
- Active inventory
- 42
- Price-to-rent
- 7.6×
Monthly cashflow live
- Estimated rent
- $1,480 medium interval (Pro) →
- Mortgage (P&I)
- −$708
- Tax est. 1.5%
- −$169 /mo · $2,025/yr
- Insurance
- −$56
- HOA
- −$0
- Vacancy / Maint / Mgmt
- −$311
- Net cashflow
- $236
Break-even live
UW: 25.0% down · 7.5% · 30yr · 1.5% tax · 5.0% vac · 8.0% maint · 8.0% mgmt
Financing live
Cash to close
- Down payment
- $33,750
- Closing costs
- $4,050
- Reserves months
- —
- Total cash needed
- —
Loan-product check · same deal, 3 products live
Conventional
25% down · 7.5% · 30yr
- Down + closing
- —
- Monthly P&I
- —
- Monthly cashflow
- —
- DSCR
- —
- Eligible?
- —
Personal DTI + credit; lowest rate.
DSCR
20% down · 8.5% · 30yr
- Down + closing
- —
- Monthly P&I
- —
- Monthly cashflow
- —
- DSCR
- —
- Eligible?
- —
No personal income docs; deal must DSCR.
Hard money
10% down · 12.0% · 12mo
- Down + closing
- —
- Monthly P&I
- —
- Monthly cashflow
- —
- DSCR
- —
- Eligible?
- —
Short-term bridge; refi at stabilization.
Rent comps 3 comps
| Address | Beds | Baths | Sqft | Rent | $/sqft | DOM | Units | Dist |
|---|---|---|---|---|---|---|---|---|
| 2364 Cherry Tree Ln Diamond, IL | 2.0 | 1.5 | 1200 | $1,550 | $1.29 | 2d | 1 | 0.22mi |
| 300 N Daley St Diamond, IL | 3.0 | 2.0 | 1216 | $1,199 | $0.99 | 1d | 1 | 0.24mi |
| 480 N 3rd Ave Coal City, IL | 3.0 | 1.5 | 1300 | $2,300 | $1.77 | 44d | 1 | 0.99mi |
Listing history 4 events
-
2026-05-14price $134,999 412-char remark
Show marketing remark (412 chars)
Welcome to this brand new, 3 bed/2 bath home that offers the perfect blend of comfort, affordability, and modern living. This home boasts an open floor plan, new appliances, and access to community amenities. Don't miss out on the chance to make this charming and affordable residence your own. Schedule a showing today! * All photos and renderings shown are for illustration purposes only. Actual home may vary.
-
2026-05-12price $135,999 412-char remark
Show marketing remark (412 chars)
Welcome to this brand new, 3 bed/2 bath home that offers the perfect blend of comfort, affordability, and modern living. This home boasts an open floor plan, new appliances, and access to community amenities. Don't miss out on the chance to make this charming and affordable residence your own. Schedule a showing today! * All photos and renderings shown are for illustration purposes only. Actual home may vary.
-
2026-04-02price $134,999 412-char remark
Show marketing remark (412 chars)
Welcome to this brand new, 3 bed/2 bath home that offers the perfect blend of comfort, affordability, and modern living. This home boasts an open floor plan, new appliances, and access to community amenities. Don't miss out on the chance to make this charming and affordable residence your own. Schedule a showing today! * All photos and renderings shown are for illustration purposes only. Actual home may vary.
-
2025-10-04$134,900 Active 412-char remark
Show marketing remark (412 chars)
Welcome to this brand new, 3 bed/2 bath home that offers the perfect blend of comfort, affordability, and modern living. This home boasts an open floor plan, new appliances, and access to community amenities. Don't miss out on the chance to make this charming and affordable residence your own. Schedule a showing today! * All photos and renderings shown are for illustration purposes only. Actual home may vary.
ⓘ Source: listings_history table (triggers on properties + properties_extension) + one-shot
backfill from property_details.listing_events for pre-trigger history.
Nearby sold comps map
Loading sold comps map…
Walkable amenities ~0.75 mi
Loading nearby amenities…
Taxation est. · year 1
- Rental income
- $17,760
- − Mortgage interest
- −$7,562
- − Property taxes
- −$2,025
- − Insurance
- −$675
- − Repairs & maintenance
- −$1,421
- − Management
- −$1,421
- − Depreciation
- −$3,927
- Taxable income
- $729
- Est. tax owed @ 24.0%
- −$175
- After-tax cash flow
- $2,660/yr
For passive investors: Depreciation is non-cash, so a rental often shows a tax loss while cash-flowing — sheltering income. Rental losses are passive: they offset passive income freely, and up to $25,000/yr can offset ordinary (W-2) income if you actively participate and your MAGI is under $100k (phasing out to $0 by $150k); unused losses carry forward. On sale, claimed depreciation is recaptured at up to 25%, and gains may owe capital-gains tax (a 1031 exchange can defer both). Figures are a year-1 estimate at your 24.0% rate — not tax advice; consult a CPA.
Condition & rehab AI · 1 photo
This 3-bedroom, 2-bathroom manufactured home is in good condition with no major repairs needed. It offers a good return on investment with minor cosmetic updates that can significantly increase its resale and rental value.
Value-add opportunities
- Both Painting exterior and interior walls — Fresh paint enhances curb appeal and interior aesthetics.
- Both Landscaping improvements — Enhanced landscaping can increase curb appeal and property value.
- Both Add a small patio or deck — A patio or deck can increase outdoor living space and add value to the property.
Renovation cost estimate screening
Value-add ROI direction
- Both Painting exterior and interior walls — Fresh paint enhances curb appeal and interior aesthetics. ↑
- Both Landscaping improvements — Enhanced landscaping can increase curb appeal and property value. ↑
- Both Add a small patio or deck — A patio or deck can increase outdoor living space and add value to the property. ↑
ⓘ Cost ranges are severity-bucket heuristics (US national rule-of-thumb). Get contractor quotes + a written scope before underwriting a rehab budget.
Schools (NCES district)
- District
- Coal City CUSD 1
- NCES district ID
- 1710530
- Math proficiency
- 46% ▬ 0.00%
- Reading proficiency
- 50% ▼ -7.00%
- Median HH income
- $67,347
- Composite
- 42.77/100
- National rank
- #3151
- State rank
- #65 of 620 in IL
Livability — Diamond
- Score
- 64/100
- State rank
- #697
- US rank
- #14220
Category grades
Schools grade is shown separately in the Schools card above.
Census & demographics
- Census place
- Diamond, IL
- Population (ZIP)
- 9,277
Population outlook (Grundy County) Hauer SSP2
- Today (2025)
- 50,716 people
- By 2030
- 50,218 · -1.0%
- By 2040
- 48,599 · -4.2%
- By 2050
- 46,212 · -8.9%
- By 2075
- 40,033 · -21.1%
- By 2100
- 32,966 · -35.0%
Race, ethnicity, and origin ACS 2023
- Neighborhood character
- Predominantly White (91%)
- Race & ethnicity
- White 91% Hispanic / Latino 7% Two or more races 3%
- Hispanic origin (detail)
- Mexican 6%
- Common ancestry
- Romanian 12% Iranian 4% Portuguese 3%
- Foreign-born
- 2% · Canada
- Languages at home
- 96% English-only · Spanish 3%
Political lean MEDSL · Grundy
- 2024 margin
- Strong R (+29.6) · D 34.5% · R 64.0% · Other 1.5%
- 2008→2024 swing
- -31.3pp toward R · 2008: 1.7pp · 2024: -29.6pp
- All cycles
- 2024: R+29.6 2020: R+25.8 2016: R+23.6 2012: R+9.0 2008: D+1.7
Not yet ingested
- Civics
- —
Market trends
- HPI YoY
- ▼ -129.40%
- Current HPI
- 154.913
- Rent YoY
- —
- Metro
- —
- State GDP YoY
- ▲ 1.59%
- F500 in state
- 60
Industry mix (Fortune 500 HQ in IL)
| Industry | F500 HQs | Revenue |
|---|---|---|
| Insurance | 4 | $201B |
|
||
| Consumer Goods | 4 | $87B |
|
||
| Industrial Machinery | 3 | $64B |
|
||
| Healthcare | 2 | $55B |
|
||
| Retail / Pharmacy | 1 | $148B |
|
||
| Agriculture / Food | 1 | $86B |
|
||
Price history
+0.1% since first listed4 events — show timeline
- 2026-05-14 Price Changed $134,999 Zillow
- 2026-05-12 Price Changed $135,999 Zillow
- 2026-04-02 Price Changed $134,999 Zillow
- 2025-10-04 Listed $134,900 Zillow
Cash-flow waterfall
monthlySold comps — $/sqft
last 12 mo · ≤1 miLoading sold comps…