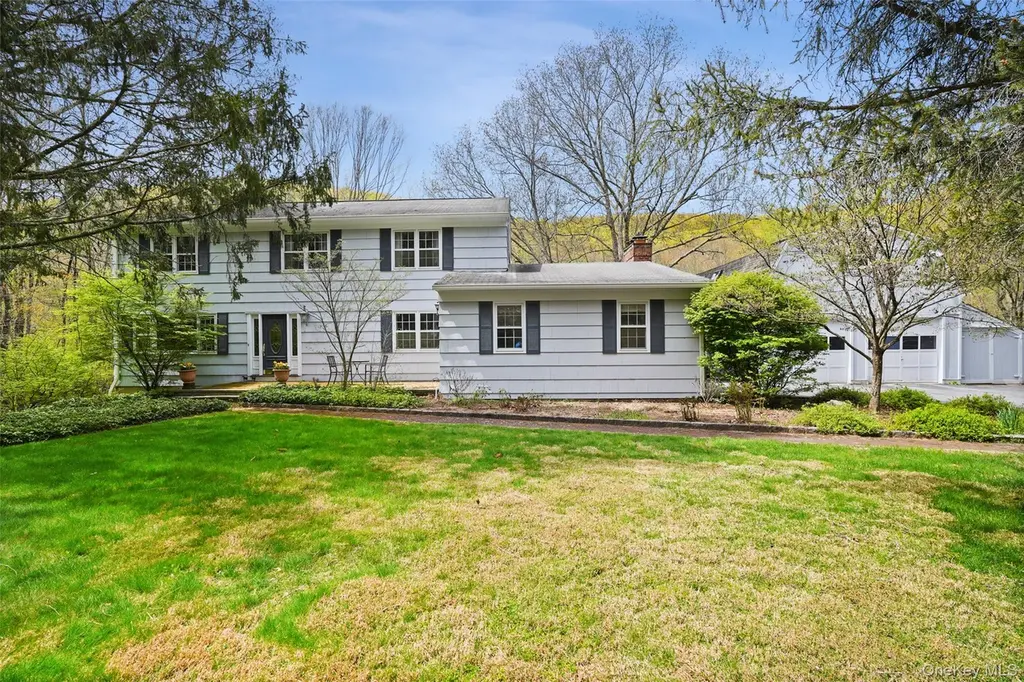
112 Parkview Rd N · West Mountain, CT
Flood risk 1/10 · Minimal
- FEMA flood zone
- X (unshaded)
- Chance of flooding over 30 yrs
- 0.0%
- Est. flood insurance / yr
- $473 – $860
Fire risk 3/10 · Minor
- Est. fire insurance / yr
- $691 – $1,283
Heat risk 4/10 · Minor
- Hot days now (above 98°F)
- 7 days/yr
- Hot days in 30 yrs
- 16 days/yr
Wind risk 5/10 · Moderate
- Chance of severe wind over 30 yrs
- 26.0%
Air-quality risk 4/10 · Minor
- Unhealthy air days now
- 4 days/yr
- Unhealthy air days in 30 yrs
- 7 days/yr
Risk factors via First Street. Map © Google.
Why this score? — see what drove the A- grade
The composite is a weighted blend of 9 inputs, each scored 0–100. Each bar is that input's sub-score; the figure is the points it added to the 100-point composite (weight × sub-score).
- Cash flow +30.0/30.0
- ARV discount +15.0/15.0
- 1% rule +10.0/10.0
- DSCR +10.0/10.0
- Appreciation +6.9/10.0
- Schools +5.3/10.0
- Rent growth +2.5/5.0
- Livability +2.5/5.0
- Condition / age +2.5/5.0
$1,100,000
🖨 Deal sheet (PDF) 📄 Offer letter ✓ Due diligence
Listing remarks
Lovely and inviting 4 bedroom house, set on a remarkable property adjoining Ward Pound Ridge Reservation. This property offers quiet privacy, scenic views, and direct access to thousands of acres of protected parkland. The property features a large spring-fed pond, two streams, and immediate access to miles of multi-use trails for year-round recreation. Generous living spaces provide a comfortable layout for everyday living and entertaining, while the attractive and spacious rear deck and three-season sun porch overlook the natural surroundings and a charming barn. A detached garage includes approximately 750 square feet of finished space above, offering flexible use options. Conveniently l
Key facts
- Multi-use trails
- Full house generator
- Spring-fed pond
Tags
Property features AI
Exterior
- Parking: Driveway; Garage (heated); 2-car garage
- Security: Security system
- Utilities: Electric: NYSEG; Septic tank; Private trash collection
- Home design: Single family residence; Actual property condition
- Construction: Frame construction; Finished walk-out basement
- Exterior features: Frame construction; Barn(s); No fencing; Not waterfront; Security system
Interior
- Kitchen: Dishwasher; Electric cooktop; Oven; Refrigerator; Eat-in kitchen
- Bedrooms: Total rooms: 10
- Flooring: Hardwood; Ceramic tile; Tile
- Bathrooms: 3 full bathrooms; 1 half bathroom
- Heating & cooling: Baseboard heat; Heat pump; Oil heating; Central air conditioning; 1 fireplace (family room)
- Interior features: Beamed ceilings; Ceiling fan(s); Eat-in kitchen; Primary bathroom; Finished walk-out basement; Attic with pull-down stairs; Deck, patio, porch (screened)
- Laundry & utility: Laundry room; Washer; Dryer
Neighborhood map
What this means for you Summary
Snapshot
- This is a 4-bed/3.5-bath single-family listed at $1.10M.
Deal economics
- At list price, monthly cash flow is $6k ($78k/yr) — positive.
- The deal already cash-flows at list — no discount required.
- Meets the 1% rule at list price ($18k rent vs $1.10M).
- Cap rate 13.4% vs local median 3.1% in West Mountain — top-decile yield for the area; either an underpriced asset or a hidden risk that comps aren't pricing in. Stress-test before assuming the spread holds.
Location & tenants
- Location reads: area grade A — affects rentability + tenant quality, not the cash-flow math above.
- Bedford Central School District (rural): math 54% / reading 60% proficiency, ranked #211 of 590 in NY (top 36%) — acceptable for families but not a draw, mixed tenant base, ~2y average lease; only 10% free/reduced lunch — higher-income household profile.
- Zoned schools: Pound Ridge Elementary School (math 52% / reading 77%, grade B, #591 of 2,108 statewide, top 31%, 238 students, 10% FRL); Fox Lane Middle School (math 42% / reading 55%, grade C-, #300 of 729 statewide, top 41%, 765 students, 38% FRL); Fox Lane High School (math 97% / reading 82%, grade A+, #265 of 1,100 statewide, top 26%, 1,241 students, 36% FRL) — zoned schools average 28% FRL vs 10% district-wide (17 pts higher); higher-poverty schools than district average — tighter screening recommended.
- Market conditions: 1 comparable units currently listed for rent nearby; 954 units permitted in Westchester County in 2024 (649 in 5+ unit buildings).
Forward outlook
- In year one you build about $50k of equity ($8k loan paydown + $42k appreciation (3.8% local appreciation)).
- Westchester County population projected at +10% by 2050 — modest demand growth; plan on rents tracking national, not racing it.
- At projected returns (3.8% appreciation + 3.0% rent growth), your $308k cash investment doubles in ~3 years — after that, you're playing with house money.
- By year 2, paydown + projected appreciation supports a ~$80k cash-out refi (75% LTV) — recoverable capital for the next deal without selling this one.
Negotiation context
- Only 12 days on market — expect competitive offers; lowballing is unlikely to land.
- 7 sale attempts since 17y ago with the ask held roughly flat each time — persistent listings suggest the price (not the market) is what's stuck; bring a comps-based counter.
- Current owner paid $798k; 38% above their basis — modest negotiation headroom, anchor on the comps not their cost.
Risks & watch-outs
- Climate carrying-cost: moderate wind risk, 26% chance of damaging wind over 30y — expect insurance premiums to compound above CPI over the hold.
Questions for the listing agent
- Built in 1971 — when were the roof, HVAC, electrical panel, plumbing, and water heater last replaced?
- Is there a deadline driving the sale (1031 exchange, divorce, estate, relocation)? That informs how much negotiation room exists.
- What's the average days-on-market for RENTAL listings here right now (not sales)? A rising rental-DOM trend means longer vacancies and softer asking-rent achievability than the comps imply.
- What's the recent tenant-quality profile in this submarket — average credit score on applications, eviction rate, late-payment / NSF rate, and stable-employment percentage? A property-management company in the area should have these aggregated.
- How much new for-sale + rental construction is in the pipeline within 1–3 miles? Heavy new supply typically softens prices + rents 12–24 months out; constrained supply supports both.
Investment metrics
- 1% rule
- 1.64% ✓
- Cap rate
- 13.38%
- Cash-on-cash
- 25.32%
- DSCR
- 2.13
- GRM
- 5.1
CMA / ARV
- ARV (median comp)
- $1,432,173
- List price
- $1,100,000
- Delta
- -23.19%
- Verdict
- UNDERPRICED
- Comps
- 20 within 1.0 mi
Show comp detail 4 sales within ~0.75 mi
| Address | Dist | Beds/Ba | Sqft | Sold | Price | $/sf | Match |
|---|---|---|---|---|---|---|---|
| 25 Highview Rd | 0.51mi | 4/3.5 | 3,552 (-2%) | 13mo | $1,300,000 | $366 | 63 |
| 309 Salem Rd | 0.49mi | 4/2.0 | 3,621 (+0%) | 12mo | $673,000 | $186 | 61 |
| 119 Cross Pond Rd | 0.32mi | 4/3.5 | 3,186 (-12%) | 11mo | $1,505,000 | $472 | 56 |
| 168 Park View Rd | 0.55mi | 3/2.5 (-1) | 3,292 (-9%) | 12mo | $1,325,000 | $402 | 40 |
Match score weights: distance 35% · size 25% · config 20% · recency 20%. Top-matched comps best support the ARV.
Projected returns pro-forma
3.84% appreciation · 3.0% rent growth · sell at horizon
- IRR
- 32.9%
- Equity multiple
- 2.94×
- Total profit
- $596,333
- Equity at exit
- $547,333
- IRR
- 32.4%
- Equity multiple
- 5.82×
- Total profit
- $1,484,299
- Equity at exit
- $887,024
Cash invested: $308,000 (down + closing). Projections, not guarantees.
Landlord ↔ Tenant lean methodology
- Overall (STATE)
- 27 Tenant-Leaning
- State Connecticut
- 27 Tenant-Leaning · D+7
- County
- — inherits STATE
- City
- — inherits STATE
ZIP-level market 10576
- Home prices YoY
- 1.6%
- Price-to-rent
- 5.1×
Monthly cashflow live
- Estimated rent
- $18,000 medium interval (Pro) →
- Mortgage (P&I)
- −$5,769
- Tax from tax record
- −$1,494 /mo · $17,932/yr
- Insurance
- −$458
- HOA
- −$0
- Vacancy / Maint / Mgmt
- −$3,780
- Net cashflow
- $6,499
Break-even live
Sensitivity live
| Price | -10% $7,122 | -5% $6,810 | +0% $6,499 | +5% $6,188 | +10% $5,876 |
|---|---|---|---|---|---|
| Rent | -10% $5,077 | -5% $5,788 | +0% $6,499 | +5% $7,210 | +10% $7,921 |
| Rate | -1.0pp $7,053 | -0.5pp $6,779 | base $6,499 | +0.5pp $6,214 | +1.0pp $5,924 |
UW: 25.0% down · 7.5% · 30yr · 1.5% tax · 5.0% vac · 8.0% maint · 8.0% mgmt
Financing live
Cash to close
- Down payment
- $275,000
- Closing costs
- $33,000
- Reserves months
- —
- Total cash needed
- —
Loan-product check · same deal, 3 products live
Conventional
25% down · 7.5% · 30yr
- Down + closing
- —
- Monthly P&I
- —
- Monthly cashflow
- —
- DSCR
- —
- Eligible?
- —
Personal DTI + credit; lowest rate.
DSCR
20% down · 8.5% · 30yr
- Down + closing
- —
- Monthly P&I
- —
- Monthly cashflow
- —
- DSCR
- —
- Eligible?
- —
No personal income docs; deal must DSCR.
Hard money
10% down · 12.0% · 12mo
- Down + closing
- —
- Monthly P&I
- —
- Monthly cashflow
- —
- DSCR
- —
- Eligible?
- —
Short-term bridge; refi at stabilization.
Rent comps 1 comps
| Address | Beds | Baths | Sqft | Rent | $/sqft | DOM | Units | Dist |
|---|---|---|---|---|---|---|---|---|
| 106 Old Stone Hill Rd Pound Ridge, NY | 5.0 | 5.5 | 4534 | $18,000 | $3.97 | 3d | 1 | 1.19mi |
Listing history 16 events
-
2026-05-11status Pending 929-char remark
-
2026-04-29$1,100,000 Active 929-char remark
-
2021-01-29soldstatus $798,000
-
2016-09-10historical Expired
-
2016-09-09historical
-
2016-07-09price
-
2016-03-09Active
-
2016-03-09$775,000
-
2015-12-18historical
-
2015-12-12historical Temporarily off Market
-
2015-11-19Active
-
2015-11-18$799,000
-
2010-05-01historical
-
2009-10-21Active
-
2009-10-21historical Cancelled
-
2009-04-22
ⓘ Source: listings_history table (triggers on properties + properties_extension) + one-shot
backfill from property_details.listing_events for pre-trigger history.
Tax reassessment forecast CT · Partial reset (capped growth)
- Current annual tax
- $17,932 · $1,494/mo
- Projected year-2 tax
- $20,736 · $1,728/mo
- Expected delta
- +$2,804/yr (+$234/mo · 15.6%)
ⓘ Screening estimate from a state-policy table — verify with the county assessor before closing.
Climate risk First Street
- Flood 1/10 Low FEMA zone X (unshaded) · 0% chance over 30 yrs
- Wildfire 3/10 Moderate
- Heat 4/10 Moderate 7 d/yr ≥98°F today · 16 d/yr by 30 yrs out
- Wind 5/10 Major 26% chance of damaging wind over 30 yrs
- Air quality 4/10 Moderate 4 unhealthy d/yr today · 7 by 30 yrs out
Nearby sold comps map
Loading sold comps map…
Walkable amenities ~0.75 mi
Loading nearby amenities…
Taxation est. · year 1
- Rental income
- $216,000
- − Mortgage interest
- −$61,617
- − Property taxes
- −$17,932
- − Insurance
- −$5,500
- − Repairs & maintenance
- −$17,280
- − Management
- −$17,280
- − Depreciation
- −$32,000
- Taxable income
- $64,391
- Est. tax owed @ 24.0%
- −$15,454
- After-tax cash flow
- $62,532/yr
For passive investors: Depreciation is non-cash, so a rental often shows a tax loss while cash-flowing — sheltering income. Rental losses are passive: they offset passive income freely, and up to $25,000/yr can offset ordinary (W-2) income if you actively participate and your MAGI is under $100k (phasing out to $0 by $150k); unused losses carry forward. On sale, claimed depreciation is recaptured at up to 25%, and gains may owe capital-gains tax (a 1031 exchange can defer both). Figures are a year-1 estimate at your 24.0% rate — not tax advice; consult a CPA.
Schools (NCES district)
- District
- Bedford Central School District
- NCES district ID
- 3619950
- Math proficiency
- 54% ▼ -9.00%
- Reading proficiency
- 60% ▬ 0.00%
- Median HH income
- $98,055
- Composite
- 53.17/100
- National rank
- #1508
- State rank
- #211 of 590 in NY
Livability — West Mountain
No livability data for this city. (Only ~50 U.S. cities are tracked.)
Census & demographics
- Population (ZIP)
- 4,904
Population outlook (Westchester County) Hauer SSP2
- Today (2025)
- 1,028,035 people
- By 2030
- 1,051,636 · +2.3%
- By 2040
- 1,098,520 · +6.9%
- By 2050
- 1,136,044 · +10.5%
- By 2075
- 1,196,925 · +16.4%
- By 2100
- 1,175,147 · +14.3%
Race, ethnicity, and origin ACS 2023
- Neighborhood character
- Predominantly White (90%)
- Race & ethnicity
- White 90% Hispanic / Latino 4% Two or more races 3% Asian 2% Black 1%
- Common ancestry
- Romanian 6% Scotch-Irish 4% Italian 3%
- Foreign-born
- 10% · Canada, China, Jamaica
- Languages at home
- 88% English-only · Other Indo-European 5% Spanish 3% French/Haitian/Cajun 2%
Political lean MEDSL · Westchester
- 2024 margin
- Strong D (+26.3) · D 63.1% · R 36.9%
- 2008→2024 swing
- -1.3pp toward R · 2008: 27.6pp · 2024: 26.3pp
- All cycles
- 2024: D+26.3 2020: D+36.3 2016: D+32.8 2012: D+22.2 2008: D+27.6
Not yet ingested
- Civics
- —
Market trends
- HPI YoY
- ▲ 3.84%
- Current HPI
- 239.5803
- Rent YoY
- —
- Metro
- —
- State GDP YoY
- ▲ 1.06%
- F500 in state
- 38
Industry mix (Fortune 500 HQ in CT)
| Industry | F500 HQs | Revenue |
|---|---|---|
| Industrial Machinery | 4 | $38B |
|
||
| Insurance | 3 | $71B |
|
||
| Financial Services | 2 | $25B |
|
||
| Transportation / Logistics | 2 | $18B |
|
||
| Healthcare | 1 | $247B |
|
||
| Telecommunications | 1 | $55B |
|
||
Price history
+37.7% since first listed16 events — show timeline
- 2026-05-11 Pending — OneKey® MLS as Distributed by MLS Grid
- 2026-04-29 Listed $1,100,000 OneKey® MLS as Distributed by MLS Grid
- 2021-01-29 Sold (Public Records) $798,000 Public Records
- 2016-09-10 Delisted — HGMLS
- 2016-09-09 Listing Removed — OneKey® MLS as Distributed by MLS Grid
- 2016-07-09 Price Changed — HGMLS
- 2016-03-09 Listed — HGMLS
- 2016-03-09 Listed $775,000 OneKey® MLS as Distributed by MLS Grid
- 2015-12-18 Listing Removed — OneKey® MLS as Distributed by MLS Grid
- 2015-12-12 Delisted — HGMLS
- 2015-11-19 Listed — HGMLS
- 2015-11-18 Listed $799,000 OneKey® MLS as Distributed by MLS Grid
- 2010-05-01 Delisted — HGMLS
- 2009-10-21 Listed — HGMLS
- 2009-10-21 Delisted — HGMLS
- 2009-04-22 Listed — HGMLS
Property tax history
+4.7%/yrLatest (2025): $17,932 · +7.8% YoY. Source: county tax records.
Cash-flow waterfall
monthlySold comps — $/sqft
last 12 mo · ≤1 miLoading sold comps…