448 Coyote Creek Ct · Potosi, TX
Flood risk 1/10 · Minimal
- FEMA flood zone
- A
- Chance of flooding over 30 yrs
- 0.0%
- Est. flood insurance / yr
- $1,009 – $1,996
Fire risk 4/10 · Minor
- Est. fire insurance / yr
- $1,222 – $2,270
Heat risk 7/10 · Major
- Hot days now (above 103°F)
- 7 days/yr
- Hot days in 30 yrs
- 24 days/yr
Wind risk 4/10 · Minor
- Chance of severe wind over 30 yrs
- 22.0%
Air-quality risk 1/10 · Minimal
- Unhealthy air days now
- 0 days/yr
- Unhealthy air days in 30 yrs
- 0 days/yr
Risk factors via First Street. Map © Google.
Why this score? — see what drove the D+ grade
The composite is a weighted blend of 9 inputs, each scored 0–100. Each bar is that input's sub-score; the figure is the points it added to the 100-point composite (weight × sub-score).
- Cash flow +13.0/30.0
- Schools +5.6/10.0
- ARV discount +5.5/15.0
- Rent growth +5.0/5.0
- Condition / age +5.0/5.0
- DSCR +3.9/10.0
- 1% rule +3.7/10.0
- Livability +3.5/5.0
- Appreciation +0.0/10.0
$233,990
🖨 Deal sheet (PDF) 📄 Offer letter ✓ Due diligence
Listing remarks
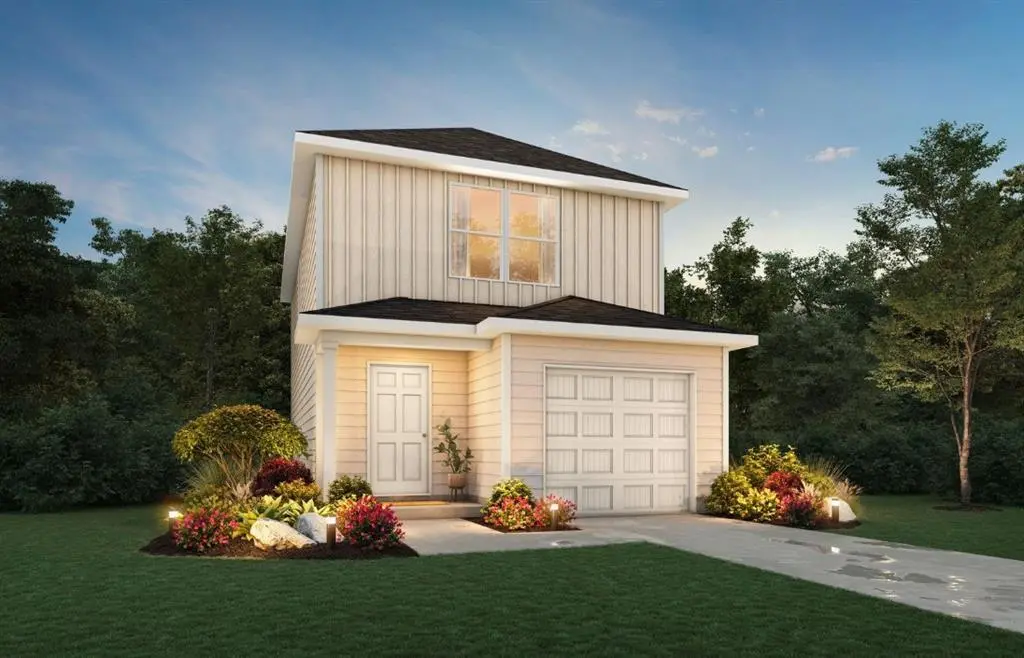
MLS# 21292252 - Built by NHC - Sep 2026 completion! ~ Model 1212 B1 - Navajo The Navajo Plan from our Celebration Series offers a thoughtfully designed two-story layout that blends open main-level living with private bedroom suites upstairs. With 2 bedrooms, 2.5 bathrooms, and 1,212 square feet of well-planned space, this home is ideal for buyers seeking comfort, efficiency, and modern design. The main level welcomes you with a covered front porch and foyer, leading into a hallway that opens to the kitchen, dining, and family room. The kitchen features an island with breakfast bar seating and generous counter space, opening to the dining and family room for easy everyday living. A patio do
Key facts
- 3,055 sq ft lot
- 2 garage spots
- Built 2026
Property features AI
Finance
- Other: Special listing condition: Builder; Possession at closing/funding
- Financial info: Treat as clear loan status; No second mortgage; Listing terms: Cash, Conventional, FHA, VA
- HOA & community: No homeowners association
Exterior
- Parking: Attached 2-car garage (garage faces front); 1 carport space; 2 covered parking spaces; Garage approximately 19 ft by 19 ft
- Utilities: City water; City sewer; Electricity available; Not in a municipal utility district
- Home design: Single-family residence; Residential property; Not attached to another unit; New construction (incomplete) expected 2026
- Construction: Composition roof; Siding exterior; Slab foundation; Year built 2026 (new construction - incomplete)
- Exterior features: Condo/townhome lot (community: Cedar Creek On Maple); Directions available to the community
Interior
- Kitchen: Dishwasher; Electric range; Microwave
- Bedrooms: 2 bedrooms (primary bedroom on second level with walk-in closet)
- Flooring: Carpet; Laminate
- Bathrooms: 2 full bathrooms and 1 half bathroom (3 total)
- Heating & cooling: Electric heating; Central electric air conditioning
- Interior features: Eat-in kitchen; Walk-in closet(s); 7 total rooms; One living area; One dining area; Two levels
Neighborhood map
What this means for you Summary
Snapshot
- This is a 2-bed/2.5-bath single-family listed at $234k. Condition is rated excellent.
Deal economics
- At list price, monthly cash flow is $-139 ($-2k/yr) — negative.
- To cash-flow at today's rent, offer at most $214k (8.6% below list).
- To meet the 1% rule (rent ≥ 1% of price), the offer needs to be $203k (13.2% below list).
- Recommended offer: $203k (13.2% below list) — sets the bar for 1% rule.
- Cap rate 6.2% vs local median 4.9% in Potosi — meaningfully above typical; check what's discounted (condition, days-on-market, listing class) to confirm the premium yield is real.
Location & tenants
- Location reads 69/100 on livability (#398 in TX) — a middle-class / working-renter tenant base. Strengths: crime A+, employment A+, cost of living A+; Watch: health & safety D+, amenities F, commute F.
- Wylie ISD (rural): math 63% / reading 62% proficiency, ranked #32 of 826 in TX (top 4%) — acceptable for families but not a draw, mixed tenant base, ~2y average lease; only 17% free/reduced lunch — higher-income household profile.
- Zoned schools: Wylie West Int (math 64% / reading 64%, grade B, #283 of 4,322 statewide, top 7%, 459 students, 24% FRL); Wylie West J H (math 62% / reading 58%, grade B, #158 of 1,662 statewide, top 10%, 972 students, 24% FRL); Wylie H S (math 60% / reading 76%, grade B, #150 of 1,632 statewide, top 10%, 1,467 students, 18% FRL) — zoned schools at 22% FRL track the district average.
- Market conditions: Rents rising fast (+33.5%/yr); 374 active listings in the ZIP; solid renter incomes; 508 units permitted in Taylor County in 2024 (0 in 5+ unit buildings).
Forward outlook
- Local home prices are declining (-3.0%/yr); year-one equity from $2k of loan paydown is wiped out by about $7k of value loss. Plan a longer hold.
- Taylor County population projected at +16% by 2050 — long-run rental-demand tailwind backs the buy-and-hold thesis.
Negotiation context
- Only 1 days on market — expect competitive offers; lowballing is unlikely to land.
Risks & watch-outs
- Watch-outs: flood insurance adds $125/mo.
- Climate carrying-cost: in FEMA flood zone A (mandatory federal flood insurance); extreme-heat days projected 7→24/yr by 2055 (HVAC capex compounding) — expect insurance premiums to compound above CPI over the hold.
Questions for the listing agent
- What do current leases actually rent for vs. the listed asking? Can we see a recent rent roll and the last 12 months of T-12 income?
- What's the actual annual flood-insurance premium (NFIP or private), and is the property in a SFHA with mandatory coverage?
- Is there a deadline driving the sale (1031 exchange, divorce, estate, relocation)? That informs how much negotiation room exists.
- Schools are F-rated, which usually means shorter tenancies and higher turnover. Who's the typical renter profile here, and what's been the actual vacancy rate?
- The area grade is low — what's the realistic commute time and amenity access for the typical tenant pool here? Any planned neighborhood developments (good or bad) we should know about?
- What's the average days-on-market for RENTAL listings here right now (not sales)? A rising rental-DOM trend means longer vacancies and softer asking-rent achievability than the comps imply.
- What's the recent tenant-quality profile in this submarket — average credit score on applications, eviction rate, late-payment / NSF rate, and stable-employment percentage? A property-management company in the area should have these aggregated.
- How much new for-sale + rental construction is in the pipeline within 1–3 miles? Heavy new supply typically softens prices + rents 12–24 months out; constrained supply supports both.
Investment metrics
- 1% rule
- 0.87% ✗
- Cap rate
- 6.22%
- Cash-on-cash
- -0.24%
- DSCR
- 0.99
- GRM
- 9.6
CMA / ARV
- ARV (on-the-fly)
- $224,220
- Comps found
- 12
Show comp detail 12 sales within ~0.75 mi
| Address | Dist | Beds/Ba | Sqft | Sold | Price | $/sf | Match |
|---|---|---|---|---|---|---|---|
| 1899 Trigger Happy Trl | 0.01mi | 3/2.0 (+1) | 1,217 (+0%) | 6mo | $225,000 | $185 | 87 |
| 1905 Trigger Happy Trl | 0.01mi | 3/2.0 (+1) | 1,217 (+0%) | 6mo | $225,000 | $185 | 87 |
| 1906 Trigger Happy Trl | 0.01mi | 3/2.0 (+1) | 1,217 (+0%) | 6mo | $225,000 | $185 | 87 |
| 1900 Trigger Happy Trl | 0.01mi | 3/2.0 (+1) | 1,217 (+0%) | 7mo | $225,000 | $185 | 86 |
| 184 Showdown Rd | 0.01mi | 3/2.0 (+1) | 1,237 (+2%) | 7mo | $226,900 | $183 | 84 |
| 268 Showdown Rd | 0.01mi | 3/2.0 (+1) | 1,217 (+0%) | 13mo | $210,500 | $173 | 81 |
| 190 Showdown Rd | 0.01mi | 3/2.0 (+1) | 1,237 (+2%) | 10mo | $226,900 | $183 | 81 |
| 196 Showdown Rd | 0.01mi | 3/2.0 (+1) | 1,237 (+2%) | 10mo | $226,900 | $183 | 81 |
| 319 Showdown Rd | 0.01mi | 3/2.0 (+1) | 1,270 (+5%) | 9mo | $239,900 | $189 | 77 |
| 292 Tombstone Dr | 0.01mi | 3/2.0 (+1) | 1,143 (-6%) | 17mo | $199,900 | $175 | 69 |
| 103 Waterloo Dr | 0.01mi | 3/2.0 (+1) | 1,380 (+14%) | 19mo | $250,000 | $181 | 54 |
| 526 FM 1750 | 0.67mi | 2/2.5 | 1,336 (+10%) | 3mo | $480,000 | $359 | 50 |
Match score weights: distance 35% · size 25% · config 20% · recency 20%. Top-matched comps best support the ARV.
Projected returns pro-forma
-3.0% appreciation · 8.0% rent growth · sell at horizon
- IRR
- -14.6%
- Equity multiple
- 0.45×
- Total profit
- $-35,903
- Equity at exit
- $34,889
- IRR
- 1.2%
- Equity multiple
- 1.10×
- Total profit
- $6,642
- Equity at exit
- $20,231
Cash invested: $65,517 (down + closing). Projections, not guarantees.
Landlord ↔ Tenant lean methodology
- Overall (STATE)
- 87 Strongly Landlord-Friendly
- State Texas
- 87 Strongly Landlord-Friendly · R+5
- County
- — inherits STATE
- City
- — inherits STATE
ZIP-level market 79602
- Home prices YoY
- -19.6%
- Rents YoY
- 33.5%
- Active inventory
- 374
- Price-to-rent
- 9.6×
Monthly cashflow live
- Estimated rent
- $2,030 medium interval (Pro) →
- Mortgage (P&I)
- −$1,227
- Tax est. 1.5%
- −$292 /mo · $3,510/yr
- Insurance
- −$97
- Flood insurance flood zone
- −$125 /mo · $1,502/yr
- HOA
- −$0
- Vacancy / Maint / Mgmt
- −$426
- Net cashflow
- $-139
Break-even live
Sensitivity live
| Price | -10% $23 | -5% $-58 | +0% $-139 | +5% $-219 | +10% $-300 |
|---|---|---|---|---|---|
| Rent | -10% $-299 | -5% $-219 | +0% $-139 | +5% $-58 | +10% $22 |
| Rate | -1.0pp $-21 | -0.5pp $-79 | base $-139 | +0.5pp $-199 | +1.0pp $-261 |
UW: 25.0% down · 7.5% · 30yr · 1.5% tax · 5.0% vac · 8.0% maint · 8.0% mgmt
Financing live
Cash to close
- Down payment
- $58,498
- Closing costs
- $7,020
- Reserves months
- —
- Total cash needed
- —
Loan-product check · same deal, 3 products live
Conventional
25% down · 7.5% · 30yr
- Down + closing
- —
- Monthly P&I
- —
- Monthly cashflow
- —
- DSCR
- —
- Eligible?
- —
Personal DTI + credit; lowest rate.
DSCR
20% down · 8.5% · 30yr
- Down + closing
- —
- Monthly P&I
- —
- Monthly cashflow
- —
- DSCR
- —
- Eligible?
- —
No personal income docs; deal must DSCR.
Hard money
10% down · 12.0% · 12mo
- Down + closing
- —
- Monthly P&I
- —
- Monthly cashflow
- —
- DSCR
- —
- Eligible?
- —
Short-term bridge; refi at stabilization.
Listing history 2 events
-
2026-06-05remarks 699-char remark
-
2026-06-05$233,990 Active 1 DOM
ⓘ Source: listings_history table (triggers on properties + properties_extension) + one-shot
backfill from property_details.listing_events for pre-trigger history.
Climate risk First Street
- Flood 1/10 Low FEMA zone A · 0% chance over 30 yrs
- Wildfire 4/10 Moderate
- Heat 7/10 Severe 7 d/yr ≥103°F today · 24 d/yr by 30 yrs out
- Wind 4/10 Moderate 22% chance of damaging wind over 30 yrs
- Air quality 1/10 Low 0 unhealthy d/yr today · 0 by 30 yrs out
Nearby sold comps map
Loading sold comps map…
Walkable amenities ~0.75 mi
Loading nearby amenities…
Taxation est. · year 1
- Rental income
- $24,361
- − Mortgage interest
- −$13,107
- − Property taxes
- −$3,510
- − Insurance
- −$2,672
- − Repairs & maintenance
- −$1,949
- − Management
- −$1,949
- − Depreciation
- −$6,807
- Taxable loss
- −$5,633
- Est. tax savings @ 24.0%
- +$1,352
- After-tax cash flow
- $-310/yr
For passive investors: Depreciation is non-cash, so a rental often shows a tax loss while cash-flowing — sheltering income. Rental losses are passive: they offset passive income freely, and up to $25,000/yr can offset ordinary (W-2) income if you actively participate and your MAGI is under $100k (phasing out to $0 by $150k); unused losses carry forward. On sale, claimed depreciation is recaptured at up to 25%, and gains may owe capital-gains tax (a 1031 exchange can defer both). Figures are a year-1 estimate at your 24.0% rate — not tax advice; consult a CPA.
Condition & rehab AI · 2 photos
The property is a new construction with no visible damage or repairs needed. It is move-in ready and ideal for buyers seeking comfort, efficiency, and modern design.
Schools (NCES district)
- District
- Wylie ISD
- NCES district ID
- 4846500
- Math proficiency
- 63% ▼ -12.00%
- Reading proficiency
- 62% ▼ -4.00%
- Median HH income
- $78,248
- Composite
- 55.86/100
- National rank
- #1206
- State rank
- #32 of 826 in TX
Livability — Potosi
- Score
- 69/100
- State rank
- #398
- US rank
- #8264
Category grades
Schools grade is shown separately in the Schools card above.
Census & demographics
- Census place
- Potosi, TX
- County
- Taylor County · 136,672 people
- City population
- 26,588
- Metro
- Abilene, TX
- Population (ZIP)
- 27,425
- Household income
- $89,551
- Rent vs Own
- Severe rent burden
- 338.0
Population outlook (Taylor County) Hauer SSP2
- Today (2025)
- 145,270 people
- By 2030
- 150,050 · +3.3%
- By 2040
- 159,417 · +9.7%
- By 2050
- 168,883 · +16.3%
- By 2075
- 194,436 · +33.8%
- By 2100
- 203,163 · +39.9%
Race, ethnicity, and origin ACS 2023
- Neighborhood character
- Majority White (64%)
- Race & ethnicity
- White 64% Hispanic / Latino 22% Two or more races 12% Black 10% Asian 2%
- Hispanic origin (detail)
- Mexican 19%
- Common ancestry
- Romanian 2% Italian 2% Portuguese 2%
- Foreign-born
- 6% · Canada, Vietnam, Jamaica
- Languages at home
- 87% English-only · Spanish 9% Other Asian/Pacific 1% French/Haitian/Cajun 1%
Political lean MEDSL · Taylor
- 2024 margin
- Solid R (+49.8) · D 24.6% · R 74.4% · Other 1.0%
- 2008→2024 swing
- -4.2pp toward R · 2008: -45.6pp · 2024: -49.8pp
- All cycles
- 2024: R+49.8 2020: R+45.3 2016: R+51.1 2012: R+53.6 2008: R+45.6
Not yet ingested
- Civics
- —
Market trends
- HPI YoY
- ▼ -46.04%
- Current HPI
- 189.3098
- Rent YoY
- ▲ 33.46%
- Metro
- Abilene, TX
- State GDP YoY
- ▲ 3.95%
- F500 in state
- 110
Industry mix (Fortune 500 HQ in TX)
| Industry | F500 HQs | Revenue |
|---|---|---|
| Energy | 16 | $1,198B |
|
||
| Technology | 5 | $198B |
|
||
| Engineering / Construction | 4 | $72B |
|
||
| Energy Services | 3 | $60B |
|
||
| Utilities | 3 | $41B |
|
||
| Healthcare | 2 | $330B |
|
||
Price history
1 event — show timeline
- 2026-06-04 Listed $233,990 NTREIS
Cash-flow waterfall
monthlySold comps — $/sqft
last 12 mo · ≤1 miLoading sold comps…