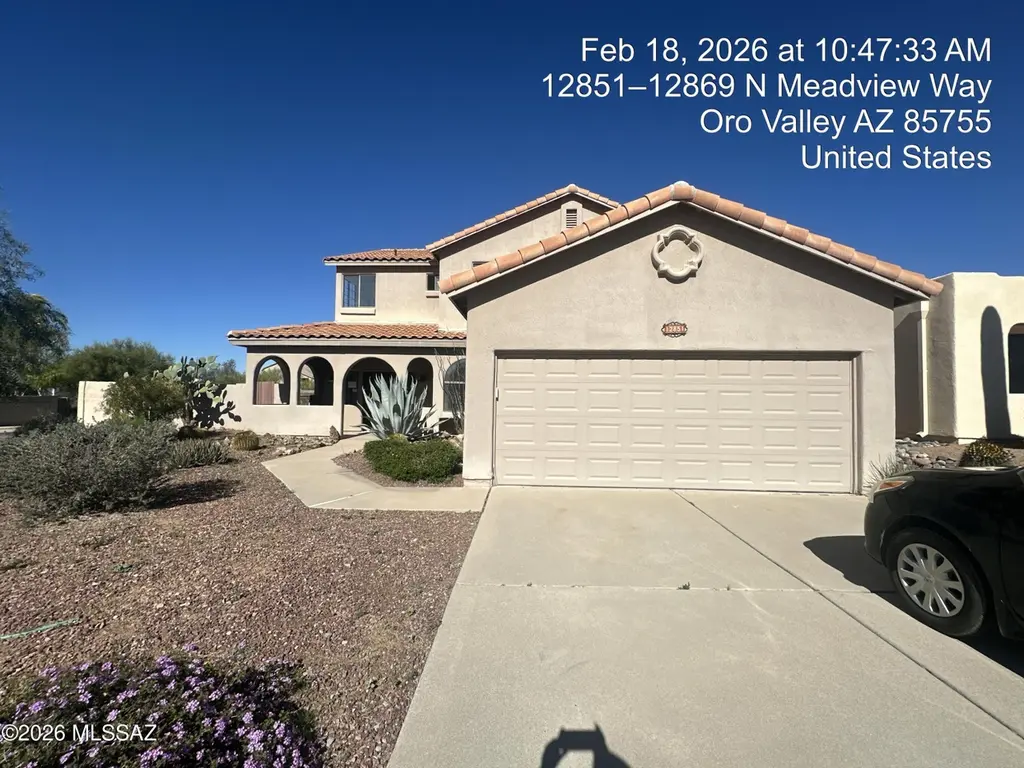
12851 N Meadview Way · Oro Valley, AZ
Flood risk 1/10 · Minimal
- FEMA flood zone
- X (unshaded)
- Chance of flooding over 30 yrs
- 0.0%
- Est. flood insurance / yr
- $507 – $1,088
Fire risk 6/10 · Moderate
- Est. fire insurance / yr
- $610 – $1,132
Heat risk 7/10 · Major
- Hot days now (above 104°F)
- 5 days/yr
- Hot days in 30 yrs
- 14 days/yr
Wind risk 1/10 · Minimal
- Chance of severe wind over 30 yrs
- —
Air-quality risk 1/10 · Minimal
- Unhealthy air days now
- 0 days/yr
- Unhealthy air days in 30 yrs
- 0 days/yr
Risk factors via First Street. Map © Google.
Why this score? — see what drove the C grade
The composite is a weighted blend of 9 inputs, each scored 0–100. Each bar is that input's sub-score; the figure is the points it added to the 100-point composite (weight × sub-score).
- Cash flow +18.4/30.0
- ARV discount +15.0/15.0
- DSCR +5.8/10.0
- 1% rule +4.5/10.0
- Livability +4.0/5.0
- Schools +3.1/10.0
- Rent growth +2.5/5.0
- Condition / age +2.5/5.0
- Appreciation +0.0/10.0
$389,900
🖨 Deal sheet 📄 Offer letter ✓ Due diligence
Listing remarks MLS
Two story home with a finished basement and private swimming pool.
Key facts
- Finished basement
- 7,710 sq ft lot
- 2 garage spots
Tags
Neighborhood map
What this means for you Summary
Snapshot
- This is a 5-bed/4.0-bath single-family listed at $390k.
Deal economics
- At list price, monthly cash flow is $363 ($4k/yr) — positive.
- The deal already cash-flows at list — no discount required.
- To meet the 1% rule (rent ≥ 1% of price), the offer needs to be $370k (5.1% below list).
- Recommended offer: $355k (9.0% below list) — sets the bar for market timing.
- Cap rate 7.4% vs local median 3.2% in Oro Valley — top-decile yield for the area; either an underpriced asset or a hidden risk that comps aren't pricing in. Stress-test before assuming the spread holds.
Location & tenants
- Location reads 81/100 on livability (#2 in AZ, #1,339 nationally) — a professional / high-income tenant draw. Strengths: crime A+, employment A+, housing A+; Watch: commute D, amenities F, cost of living D-.
- Amphitheater Unified District (4406) (suburban): math 32% / reading 40% proficiency, ranked #85 of 249 in AZ (top 34%) — families likely to look elsewhere, expect single-tenant / working-renter base with shorter leases.
- Market conditions: 232 active listings in the ZIP; 8 comparable units currently listed for rent nearby; rentals lingering (median 44d on market — plan ~5-8 weeks vacancy on turnover, expect pricing pressure); 62% of comp listings sitting > 30 days — soft ceiling on asking rent; high-income renter base; 5,268 units permitted in Pima County in 2024 (996 in 5+ unit buildings).
- This rent runs 39% of the median local income ($114k/yr) — at the standard rent-burdened threshold; future hikes will face affordability resistance.
Forward outlook
- Local home prices are declining (-3.0%/yr); year-one equity from $3k of loan paydown is wiped out by about $12k of value loss. Plan a longer hold.
- Pima County population projected at +8% by 2050 — modest demand growth; plan on rents tracking national, not racing it.
Negotiation context
- It's been on market 113 days — a 9% lower offer ($355k) is reasonable based on typical stale-listing flexibility.
- 9 sale attempts since 32y ago; this cycle's ask has dropped $50k (11%) from the opening price — seller is motivated, your offer sets the floor, not the list.
Risks & watch-outs
- Climate carrying-cost: major wildfire risk; extreme-heat days projected 5→14/yr by 2055 (HVAC capex compounding) — expect insurance premiums to compound above CPI over the hold.
Questions for the listing agent
- It's been on market 113 days. Have you received any prior offers? Is the seller open to a 9% concession, seller financing, or rate buy-down credit?
- What does the HOA fee cover, when was the last increase, and are there any pending special assessments or reserve-fund shortfalls?
- Why hasn't it sold? Are there any deal-killer items the seller is aware of (foundation, flood, title, zoning, code violations)?
- Is there a deadline driving the sale (1031 exchange, divorce, estate, relocation)? That informs how much negotiation room exists.
- Schools are A-rated — typically a magnet for longer-tenancy family renters. What's the average tenant stay here, and is there a school-zone premium baked into asking?
- What's the average days-on-market for RENTAL listings here right now (not sales)? A rising rental-DOM trend means longer vacancies and softer asking-rent achievability than the comps imply.
- What's the recent tenant-quality profile in this submarket — average credit score on applications, eviction rate, late-payment / NSF rate, and stable-employment percentage? A property-management company in the area should have these aggregated.
- How much new for-sale + rental construction is in the pipeline within 1–3 miles? Heavy new supply typically softens prices + rents 12–24 months out; constrained supply supports both.
Investment metrics
- 1% rule
- 0.95% ✗
- Cap rate
- 7.41%
- Cash-on-cash
- 3.99%
- DSCR
- 1.18
- GRM
- 8.8
CMA / ARV
- ARV (median comp)
- $557,370
- List price
- $389,900
- Delta
- -30.05%
- Verdict
- UNDERPRICED
- Comps
- 20 within 1.0 mi
Show comp detail 12 sales within ~0.75 mi
| Address | Dist | Beds/Ba | Sqft | Sold | Price | $/sf | Match |
|---|---|---|---|---|---|---|---|
| 12734 N Pioneer Way | 0.31mi | 5/3.0 | 3,130 (-7%) | 1mo | $630,000 | $201 | 69 |
| 94 E Brookdale Way | 0.26mi | 5/3.0 | 3,104 (-8%) | 2mo | $650,000 | $209 | 69 |
| 12510 N Piping Rock Rd | 0.60mi | 5/3.5 | 3,311 (-1%) | 3mo | $835,000 | $252 | 65 |
| 12654 N Vistoso View Pl | 0.28mi | 4/2.5 (-1) | 3,531 (+5%) | 4mo | $1,000,000 | $283 | 64 |
| 12450 N Copper Queen Way | 0.50mi | 5/2.5 | 3,209 (-4%) | 0mo | $637,200 | $199 | 63 |
| 12834 N Lantern Way | 0.17mi | 5/3.0 | 2,908 (-13%) | 6mo | $599,900 | $206 | 60 |
| 13258 N Pioneer Way | 0.51mi | 5/2.5 | 3,540 (+5%) | 1mo | $650,000 | $184 | 60 |
| 12932 N Pioneer Way | 0.22mi | 5/3.0 | 2,908 (-13%) | 7mo | $679,500 | $234 | 57 |
| 12410 N Forest Lake Way | 0.55mi | 5/3.5 | 2,942 (-12%) | 0mo | $647,000 | $220 | 51 |
| 250 W Milbrae Springs Dr | 0.30mi | 4/2.5 (-1) | 2,914 (-13%) | 6mo | $595,000 | $204 | 48 |
| 12403 N Echo Valley Dr | 0.66mi | 4/2.5 (-1) | 3,032 (-10%) | 5mo | $610,000 | $201 | 38 |
| 12370 N Copper Queen Way | 0.61mi | 4/2.5 (-1) | 2,944 (-12%) | 4mo | $645,000 | $219 | 37 |
Match score weights: distance 35% · size 25% · config 20% · recency 20%. Top-matched comps best support the ARV.
Projected returns pro-forma
-3.0% appreciation · 3.0% rent growth · sell at horizon
- IRR
- -10.1%
- Equity multiple
- 0.63×
- Total profit
- $-40,074
- Equity at exit
- $58,135
- IRR
- -0.7%
- Equity multiple
- 0.95×
- Total profit
- $-5,219
- Equity at exit
- $33,711
Cash invested: $109,172 (down + closing). Projections, not guarantees.
Landlord ↔ Tenant lean methodology
- Overall (STATE)
- 87 Strongly Landlord-Friendly
- State Arizona
- 87 Strongly Landlord-Friendly · R+3
- County
- — inherits STATE
- City
- — inherits STATE
ZIP-level market 85755
- Home prices YoY
- -20.4%
- Active inventory
- 232
- Price-to-rent
- 8.8×
Monthly cashflow live
- Estimated rent
- $3,698 high interval (Pro) →
- Mortgage (P&I)
- −$2,045
- Tax from tax record
- −$319 /mo · $3,832/yr
- Insurance
- −$162
- HOA
- −$32
- Vacancy / Maint / Mgmt
- −$777
- Net cashflow
- $363
Break-even live
UW: 25.0% down · 7.5% · 30yr · 1.5% tax · 5.0% vac · 8.0% maint · 8.0% mgmt
Financing live
Cash to close
- Down payment
- $97,475
- Closing costs
- $11,697
- Reserves months
- —
- Total cash needed
- —
Loan-product check · same deal, 3 products live
Conventional
25% down · 7.5% · 30yr
- Down + closing
- —
- Monthly P&I
- —
- Monthly cashflow
- —
- DSCR
- —
- Eligible?
- —
Personal DTI + credit; lowest rate.
DSCR
20% down · 8.5% · 30yr
- Down + closing
- —
- Monthly P&I
- —
- Monthly cashflow
- —
- DSCR
- —
- Eligible?
- —
No personal income docs; deal must DSCR.
Hard money
10% down · 12.0% · 12mo
- Down + closing
- —
- Monthly P&I
- —
- Monthly cashflow
- —
- DSCR
- —
- Eligible?
- —
Short-term bridge; refi at stabilization.
Rent comps 8 comps
| Address | Beds | Baths | Sqft | Rent | $/sqft | DOM | Units | Dist |
|---|---|---|---|---|---|---|---|---|
| 12884 N Pioneer Way Tucson, AZ | 4.0 | 2.5 | 2448 | $4,500 | $1.84 | 3d | 1 | 0.24mi |
| 12825 N Mystic View Pl Oro Valley, AZ | 4.0 | 2.5 | 2965 | $3,300 | $1.11 | 23d | 1 | 0.29mi |
| 12949 N Desert Olive Dr Oro Valley, AZ | 4.0 | 2.5 | 2784 | $2,526 | $0.91 | 43d | 1 | 0.69mi |
| 12936 N Salt Cedar Dr Tucson, AZ | 5.0 | 2.5 | 2750 | $2,600 | $0.95 | 43d | 1 | 0.74mi |
| 13391 N Flaxleaf Pl Tucson, AZ | 4.0 | 3.0 | 2663 | $2,500 | $0.94 | 43d | 1 | 1.05mi |
| 13914 N Flaxleaf Pl Oro Valley, AZ | 4.0 | 3.0 | 2663 | $2,650 | $1.00 | 43d | 1 | 1.18mi |
| 12129 N Tall Grass Dr Oro Valley, AZ | 5.0 | 3.0 | 3480 | $3,900 | $1.12 | 23d | 1 | 1.24mi |
| 13323 N Barlassina Dr Tucson, AZ | 4.0 | 3.0 | 2321 | $2,295 | $0.99 | 43d | 1 | 1.36mi |
HOA detail
- Monthly dues
- $32 · $384/yr
- Likely covers
- pool
Listing history 43 events
-
2026-06-18days on market $389,900 Active 113 DOM
-
2026-06-17days on market $389,900 Active 112 DOM
-
2026-06-16days on market $389,900 Active 111 DOM
-
2026-06-15days on market $389,900 Active 110 DOM
-
2026-06-13days on market $389,900 Active 108 DOM
-
2026-06-10days on market $389,900 Active 105 DOM
-
2026-06-09days on market $389,900 Active 104 DOM
-
2026-06-08days on market $389,900 Active 103 DOM
-
2026-06-07days on market $389,900 Active 102 DOM
-
2026-06-05pricedays on market $389,900 Active 99 DOM
-
2026-06-03days on market $419,900 Active 98 DOM
-
2026-06-02days on market $419,900 Active 97 DOM
-
2026-06-01days on market $419,900 Active 96 DOM
-
2026-05-31days on market $419,900 Active 95 DOM
-
2026-04-13price $419,900 66-char remark
Show marketing remark (66 chars)
Two story home with a finished basement and private swimming pool.
-
2026-02-25$439,900 Active 66-char remark
Show marketing remark (66 chars)
Two story home with a finished basement and private swimming pool.
-
2026-01-08status Pending
-
2026-01-08historical
-
2025-11-24$1 Active
-
2025-10-16historical
-
2025-08-12price $465,000
-
2025-05-15$485,000 Active
-
2022-05-31status Pending
-
2022-05-19soldstatus $515,000 Closed
-
2022-05-19soldstatus $515,000
-
2022-04-17historical Active Contingent
-
2022-04-07price $510,000
-
2022-03-28status Active
-
2022-03-17historical Active Contingent
-
2022-03-03status Active
-
2022-02-11historical Active Contingent
-
2022-01-20$520,000 Active
-
2021-11-17soldstatus $491,700
-
2005-08-31soldstatus $349,900
-
2005-08-29soldstatus $349,900
-
2005-07-15$349,900
-
1995-03-24soldstatus $190,000
-
1995-03-23soldstatus $190,000
-
1994-08-25historical
-
1994-06-15$195,000
-
1994-02-25$199,999
-
1990-11-01soldstatus $163,529
-
1989-10-01soldstatus $480,600
ⓘ Source: listings_history table (triggers on properties + properties_extension) + one-shot
backfill from property_details.listing_events for pre-trigger history.
Tax reassessment forecast AZ · Resets to sale price
- Current annual tax
- $3,832 · $319/mo
- Projected year-2 tax
- $3,832 · $319/mo
- Expected delta
- $0/yr ($0/mo · -0.0%)
ⓘ Screening estimate from a state-policy table — verify with the county assessor before closing.
Climate risk First Street
- Flood 1/10 Low FEMA zone X (unshaded) · 0% chance over 30 yrs
- Wildfire 6/10 Major
- Heat 7/10 Severe 5 d/yr ≥104°F today · 14 d/yr by 30 yrs out
- Wind 1/10 Low
- Air quality 1/10 Low 0 unhealthy d/yr today · 0 by 30 yrs out
Nearby sold comps map
Loading sold comps map…
Walkable amenities ~0.75 mi
Loading nearby amenities…
Taxation est. · year 1
- Rental income
- $44,380
- − Mortgage interest
- −$21,840
- − Property taxes
- −$3,832
- − Insurance
- −$1,950
- − Repairs & maintenance
- −$3,550
- − Management
- −$3,550
- − HOA
- −$384
- − Depreciation
- −$11,343
- Taxable loss
- −$2,069
- Est. tax savings @ 24.0%
- +$497
- After-tax cash flow
- $4,855/yr
For passive investors: Depreciation is non-cash, so a rental often shows a tax loss while cash-flowing — sheltering income. Rental losses are passive: they offset passive income freely, and up to $25,000/yr can offset ordinary (W-2) income if you actively participate and your MAGI is under $100k (phasing out to $0 by $150k); unused losses carry forward. On sale, claimed depreciation is recaptured at up to 25%, and gains may owe capital-gains tax (a 1031 exchange can defer both). Figures are a year-1 estimate at your 24.0% rate — not tax advice; consult a CPA.
Schools (NCES district)
- District
- Amphitheater Unified District (4406)
- NCES district ID
- 0400680
- Math proficiency
- 32% ▼ -13.00%
- Reading proficiency
- 40% ▼ -8.00%
- Median HH income
- $46,524
- Composite
- 30.82/100
- National rank
- #6135
- State rank
- #85 of 249 in AZ
Livability — Oro Valley
- Score
- 81/100
- State rank
- #2
- US rank
- #1339
Category grades
Schools grade is shown separately in the Schools card above.
Census & demographics
- Census place
- Oro Valley, AZ
- County
- Pima County · 1,012,107 people
- City population
- 41,345
- Metro
- Tucson, AZ
- Population (ZIP)
- 18,560
- Household income
- $113,831
- Rent vs Own
- Severe rent burden
- 211.0
Population outlook (Pima County) Hauer SSP2
- Today (2025)
- 1,066,056 people
- By 2030
- 1,086,684 · +1.9%
- By 2040
- 1,117,160 · +4.8%
- By 2050
- 1,149,778 · +7.9%
- By 2075
- 1,271,480 · +19.3%
- By 2100
- 1,321,160 · +23.9%
Race, ethnicity, and origin ACS 2023
- Neighborhood character
- Predominantly White (78%)
- Race & ethnicity
- White 78% Hispanic / Latino 12% Two or more races 10% Asian 5% Black 1%
- Hispanic origin (detail)
- Mexican 9% Puerto Rican 1%
- Common ancestry
- Lithuanian 7% Romanian 3% Italian 3%
- Foreign-born
- 11% · Canada, China
- Languages at home
- 86% English-only · Spanish 5% French/Haitian/Cajun 3% Tagalog/Filipino 1%
Political lean MEDSL · Pima
- 2024 margin
- D (+15.2) · D 57.0% · R 41.8% · Other 1.2%
- 2008→2024 swing
- +9.1pp toward D · 2008: 6.1pp · 2024: 15.2pp
- All cycles
- 2024: D+15.2 2020: D+18.7 2016: D+13.5 2012: D+5.8 2008: D+6.1
Not yet ingested
- Civics
- —
Market trends
- HPI YoY
- ▼ -64.99%
- Current HPI
- 254.1505
- Rent YoY
- —
- Metro
- Tucson, AZ
- State GDP YoY
- ▲ 4.54%
- F500 in state
- 20
Industry mix (Fortune 500 HQ in AZ)
| Industry | F500 HQs | Revenue |
|---|---|---|
| Technology | 2 | $13B |
|
||
| Mining / Metals | 1 | $23B |
|
||
| Environmental Services | 1 | $16B |
|
||
| Metals / Steel | 1 | $14B |
|
||
| Technology Distribution | 1 | $9B |
|
||
| Homebuilding | 1 | $8B |
|
||
Price history
-12.6% since first listed29 events — show timeline
- 2026-04-13 Price Changed $419,900 MLSSAZ
- 2026-02-25 Listed $439,900 MLSSAZ
- 2026-01-08 Pending — MLSSAZ
- 2026-01-08 Listing Removed — MLSSAZ
- 2025-11-24 Listed $1 MLSSAZ
- 2025-10-16 Listing Removed — MLSSAZ
- 2025-08-12 Price Changed $465,000 MLSSAZ
- 2025-05-15 Listed $485,000 MLSSAZ
- 2022-05-31 Pending — MLSSAZ
- 2022-05-19 Sold (Public Records) $515,000 Public Records
- 2022-05-19 Sold (MLS) $515,000 MLSSAZ
- 2022-04-17 Contingent — MLSSAZ
- 2022-04-07 Price Changed $510,000 MLSSAZ
- 2022-03-28 Relisted — MLSSAZ
- 2022-03-17 Contingent — MLSSAZ
- 2022-03-03 Relisted — MLSSAZ
- 2022-02-11 Contingent — MLSSAZ
- 2022-01-20 Listed $520,000 MLSSAZ
- 2021-11-17 Sold (Public Records) $491,700 Public Records
- 2005-08-31 Sold (Public Records) $349,900 Public Records
- 2005-08-29 Sold (MLS) $349,900 MLSSAZ
- 2005-07-15 Listed $349,900 MLSSAZ
- 1995-03-24 Sold (Public Records) $190,000 Public Records
- 1995-03-23 Sold (MLS) $190,000 MLSSAZ
- 1994-08-25 Listing Removed — MLSSAZ
- 1994-06-15 Listed $195,000 MLSSAZ
- 1994-02-25 Listed $199,999 MLSSAZ
- 1990-11-01 Sold (Public Records) $163,529 Public Records
- 1989-10-01 Sold (Public Records) $480,600 Public Records
Property tax history
+1.5%/yrLatest (2025): $3,832 · +4.4% YoY. Source: county tax records.
Cash-flow waterfall
monthlySold comps — $/sqft
last 12 mo · ≤1 miLoading sold comps…