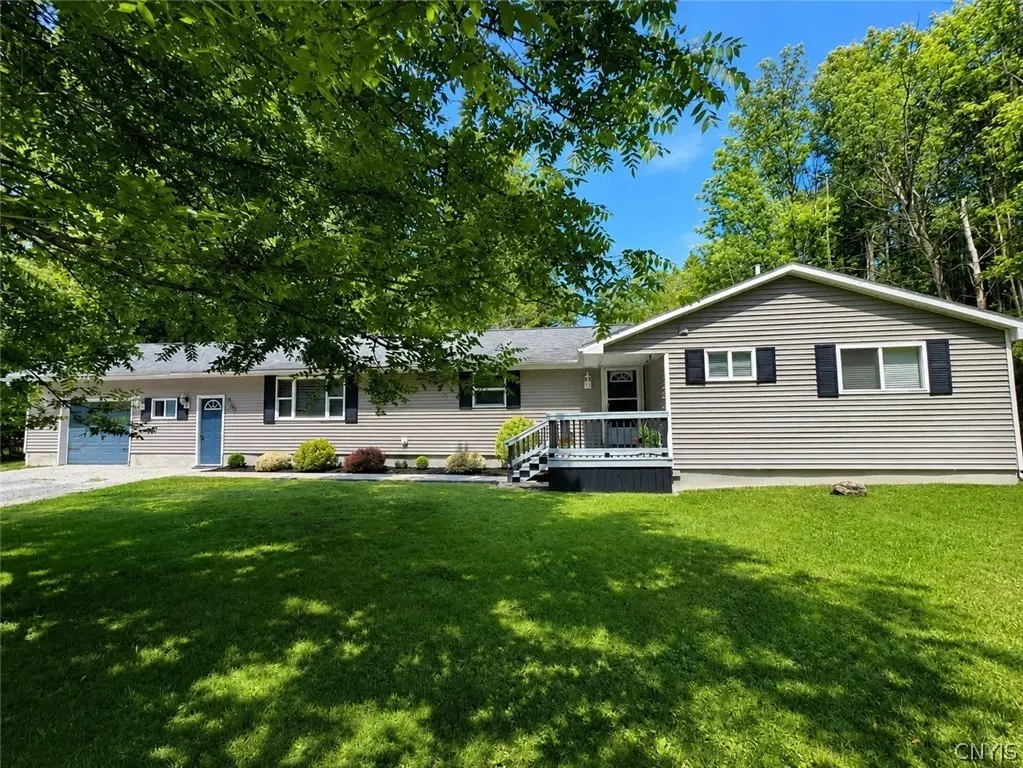
3100 Austin Rd · Clinton, NY
Flood risk 9/10 · Severe
- FEMA flood zone
- X (unshaded)
- Chance of flooding over 30 yrs
- 0.99%
- Est. flood insurance / yr
- $507 – $1,088
Fire risk 1/10 · Minimal
- Est. fire insurance / yr
- $691 – $1,283
Heat risk 2/10 · Minimal
- Hot days now (above 94°F)
- 7 days/yr
- Hot days in 30 yrs
- 16 days/yr
Wind risk 1/10 · Minimal
- Chance of severe wind over 30 yrs
- 1.0%
Air-quality risk 1/10 · Minimal
- Unhealthy air days now
- 0 days/yr
- Unhealthy air days in 30 yrs
- 0 days/yr
Risk factors via First Street. Map © Google.
Why this score? — see what drove the C- grade
The composite is a weighted blend of 9 inputs, each scored 0–100. Each bar is that input's sub-score; the figure is the points it added to the 100-point composite (weight × sub-score).
- Cash flow +15.2/30.0
- ARV discount +15.0/15.0
- Schools +5.5/10.0
- DSCR +4.7/10.0
- Livability +4.5/5.0
- 1% rule +3.2/10.0
- Rent growth +2.5/5.0
- Condition / age +2.5/5.0
- Appreciation +0.0/10.0
$249,900
🖨 Deal sheet 📄 Offer letter ✓ Due diligence
Listing remarks MLS
"Like new" open concept ranch on private wooded setting. Granite kitchen with hickory cabinetry, stainless appliances, hardwood floors, master suite, so many updates!
Key facts
- Expansive yard
- Nearby creek
- Corner lot
Tags
Property features AI
Exterior
- Parking: Attached garage; Driveway; Garage with approximately 1.5 spaces
- Utilities: Well water; Septic tank
- Home design: Single-story home; Existing construction; Block foundation
- Construction: Vinyl siding; Block foundation
- Exterior features: Leased propane tank; Corner lot; Irregular lot
Interior
- Kitchen: Dishwasher; Electric oven; Electric range; Refrigerator
- Bedrooms: Three main-level bedrooms
- Flooring: Carpet; Hardwood; Varied flooring
- Bathrooms: Two full bathrooms (both on main level)
- Heating & cooling: Propane heating with forced air; Has heating
- Interior features: Separate/formal living room; Kitchen-family room combo; Living-dining room; Main level primary suite; Primary suite
- Laundry & utility: Main-level laundry
Neighborhood map
What this means for you Summary
Snapshot
- This is a 3-bed/1.0-bath single-family listed at $250k.
Deal economics
- At list price, monthly cash flow is $22 ($266/yr) — positive.
- The deal already cash-flows at list — no discount required.
- To meet the 1% rule (rent ≥ 1% of price), the offer needs to be $205k (18.2% below list).
- Recommended offer: $205k (18.2% below list) — sets the bar for 1% rule.
Location & tenants
- Location reads 91/100 on livability (#2 in NY, #45 nationally) — a professional / high-income tenant draw. Strengths: schools A+, crime A+, commute A+; Watch: amenities D.
- Clinton Central School District (suburban): math 57% / reading 71% proficiency, ranked #185 of 590 in NY (top 31%) — acceptable for families but not a draw, mixed tenant base, ~2y average lease; only 17% free/reduced lunch — higher-income household profile.
- Market conditions: 41 active listings in the ZIP; 204 units permitted in Oneida County in 2024 (68 in 5+ unit buildings).
Forward outlook
- Local home prices are declining (-3.0%/yr); year-one equity from $2k of loan paydown is wiped out by about $7k of value loss. Plan a longer hold.
- Oneida County population projected at -12% by 2050 — secular population decline; favor cash flow + early exit over multi-decade hold.
Negotiation context
- It's been on market 28 days — a 2% lower offer ($246k) is reasonable based on typical stale-listing flexibility.
- 7 sale attempts since 14y ago with the ask held roughly flat each time — persistent listings suggest the price (not the market) is what's stuck; bring a comps-based counter.
- Current owner paid $190k; 32% above their basis — modest negotiation headroom, anchor on the comps not their cost.
Risks & watch-outs
- Watch-outs: flood insurance adds $66/mo; built in 1954 — expect roof / HVAC / electrical / plumbing capex.
- Climate carrying-cost: severe flood risk — expect insurance premiums to compound above CPI over the hold.
Questions for the listing agent
- Built in 1954 — when were the roof, HVAC, electrical panel, plumbing, and water heater last replaced?
- What's the actual annual flood-insurance premium (NFIP or private), and is the property in a SFHA with mandatory coverage?
- Is there a deadline driving the sale (1031 exchange, divorce, estate, relocation)? That informs how much negotiation room exists.
- Schools are A-rated — typically a magnet for longer-tenancy family renters. What's the average tenant stay here, and is there a school-zone premium baked into asking?
- What's the average days-on-market for RENTAL listings here right now (not sales)? A rising rental-DOM trend means longer vacancies and softer asking-rent achievability than the comps imply.
- What's the recent tenant-quality profile in this submarket — average credit score on applications, eviction rate, late-payment / NSF rate, and stable-employment percentage? A property-management company in the area should have these aggregated.
- How much new for-sale + rental construction is in the pipeline within 1–3 miles? Heavy new supply typically softens prices + rents 12–24 months out; constrained supply supports both.
Investment metrics
- 1% rule
- 0.82% ✗
- Cap rate
- 6.72%
- Cash-on-cash
- 1.52%
- DSCR
- 1.07
- GRM
- 10.2
CMA / ARV
- ARV (median comp)
- $354,925
- List price
- $249,900
- Delta
- -29.59%
- Verdict
- UNDERPRICED
- Comps
- 7 within 1.0 mi
Projected returns pro-forma
-3.0% appreciation · 3.0% rent growth · sell at horizon
- IRR
- -15.7%
- Equity multiple
- 0.44×
- Total profit
- $-39,136
- Equity at exit
- $37,261
- IRR
- -7.3%
- Equity multiple
- 0.54×
- Total profit
- $-32,472
- Equity at exit
- $21,607
Cash invested: $69,972 (down + closing). Projections, not guarantees.
Landlord ↔ Tenant lean methodology
- Overall (STATE)
- 15 Strongly Tenant-Friendly
- State New York
- 15 Strongly Tenant-Friendly · D+10
- County
- — inherits STATE
- City
- — inherits STATE
ZIP-level market 13323
- Home prices YoY
- -22.2%
- Active inventory
- 41
- Price-to-rent
- 10.2×
Monthly cashflow live
- Estimated rent
- $2,045 medium interval (Pro) →
- Mortgage (P&I)
- −$1,311
- Tax from tax record
- −$112 /mo · $1,350/yr
- Insurance
- −$104
- Flood insurance flood zone
- −$66 /mo · $798/yr
- HOA
- −$0
- Vacancy / Maint / Mgmt
- −$429
- Net cashflow
- $22
Break-even live
UW: 25.0% down · 7.5% · 30yr · 1.5% tax · 5.0% vac · 8.0% maint · 8.0% mgmt
Financing live
Cash to close
- Down payment
- $62,475
- Closing costs
- $7,497
- Reserves months
- —
- Total cash needed
- —
Loan-product check · same deal, 3 products live
Conventional
25% down · 7.5% · 30yr
- Down + closing
- —
- Monthly P&I
- —
- Monthly cashflow
- —
- DSCR
- —
- Eligible?
- —
Personal DTI + credit; lowest rate.
DSCR
20% down · 8.5% · 30yr
- Down + closing
- —
- Monthly P&I
- —
- Monthly cashflow
- —
- DSCR
- —
- Eligible?
- —
No personal income docs; deal must DSCR.
Hard money
10% down · 12.0% · 12mo
- Down + closing
- —
- Monthly P&I
- —
- Monthly cashflow
- —
- DSCR
- —
- Eligible?
- —
Short-term bridge; refi at stabilization.
Listing history 30 events
-
2026-06-13statusdays on market $249,900 Pending 28 DOM
-
2026-06-10days on market $249,900 Active 27 DOM
-
2026-06-09days on market $249,900 Active 26 DOM
-
2026-06-08days on market $249,900 Active 25 DOM
-
2026-06-07days on market $249,900 Active 24 DOM
-
2026-06-05days on market $249,900 Active 21 DOM
-
2026-06-03days on market $249,900 Active 20 DOM
-
2026-06-02days on market $249,900 Active 19 DOM
-
2026-06-01days on market $249,900 Active 18 DOM
-
2026-05-31days on market $249,900 Active 17 DOM
-
2026-05-30days on market $249,900 Active 16 DOM
-
2026-05-14$249,900 Active 1236-char remark
-
2025-09-17historical
-
2025-09-17historical
-
2025-09-08price $249,900
-
2025-08-07price $275,000
-
2025-07-27$299,900 Active
-
2021-08-03soldstatus $190,000 Closed Sale or Rented
Show marketing remark (176 chars)
"Like new" open concept ranch on private wooded setting. Granite kitchen with hickory cabinetry, stainless appliances, hardwood floors, master suite, so many updates!
-
2021-05-21historical
Show marketing remark (176 chars)
"Like new" open concept ranch on private wooded setting. Granite kitchen with hickory cabinetry, stainless appliances, hardwood floors, master suite, so many updates!
-
2021-05-05$189,900
Show marketing remark (176 chars)
"Like new" open concept ranch on private wooded setting. Granite kitchen with hickory cabinetry, stainless appliances, hardwood floors, master suite, so many updates!
-
2017-09-01soldstatus $132,000
-
2017-09-01soldstatus $132,000
-
2017-08-30soldstatus $132,000
-
2017-08-28$139,900
-
2017-07-01$139,900
-
2012-11-16soldstatus $118,000
-
2012-11-16soldstatus $118,000
-
2012-11-16soldstatus $118,000
-
2012-02-24$120,000
-
2012-02-24$120,000
ⓘ Source: listings_history table (triggers on properties + properties_extension) + one-shot
backfill from property_details.listing_events for pre-trigger history.
Tax reassessment forecast NY · Partial reset (capped growth)
- Current annual tax
- $1,350 · $112/mo
- Projected year-2 tax
- $2,787 · $232/mo
- Expected delta
- +$1,437/yr (+$120/mo · 106.4%)
ⓘ Screening estimate from a state-policy table — verify with the county assessor before closing.
Climate risk First Street
- Flood 9/10 Extreme FEMA zone X (unshaded) · 99% chance over 30 yrs
- Wildfire 1/10 Low
- Heat 2/10 Low 7 d/yr ≥94°F today · 16 d/yr by 30 yrs out
- Wind 1/10 Low 100% chance of damaging wind over 30 yrs
- Air quality 1/10 Low 0 unhealthy d/yr today · 0 by 30 yrs out
Nearby sold comps map
Loading sold comps map…
Walkable amenities ~0.75 mi
Loading nearby amenities…
Taxation est. · year 1
- Rental income
- $24,542
- − Mortgage interest
- −$13,998
- − Property taxes
- −$1,350
- − Insurance
- −$2,047
- − Repairs & maintenance
- −$1,963
- − Management
- −$1,963
- − Depreciation
- −$7,270
- Taxable loss
- −$4,049
- Est. tax savings @ 24.0%
- +$972
- After-tax cash flow
- $1,237/yr
For passive investors: Depreciation is non-cash, so a rental often shows a tax loss while cash-flowing — sheltering income. Rental losses are passive: they offset passive income freely, and up to $25,000/yr can offset ordinary (W-2) income if you actively participate and your MAGI is under $100k (phasing out to $0 by $150k); unused losses carry forward. On sale, claimed depreciation is recaptured at up to 25%, and gains may owe capital-gains tax (a 1031 exchange can defer both). Figures are a year-1 estimate at your 24.0% rate — not tax advice; consult a CPA.
Schools (NCES district)
- District
- Clinton Central School District
- NCES district ID
- 3607770
- Math proficiency
- 57% ▼ -11.00%
- Reading proficiency
- 71% ▲ 6.00%
- Median HH income
- $57,439
- Composite
- 55.05/100
- National rank
- #1290
- State rank
- #185 of 590 in NY
Livability — Clinton
- Score
- 91/100
- State rank
- #2
- US rank
- #45
Category grades
Schools grade is shown separately in the Schools card above.
Census & demographics
- Population (ZIP)
- 11,014
Population outlook (Oneida County) Hauer SSP2
- Today (2025)
- 225,223 people
- By 2030
- 220,384 · -2.1%
- By 2040
- 209,071 · -7.2%
- By 2050
- 197,920 · -12.1%
- By 2075
- 175,541 · -22.1%
- By 2100
- 148,491 · -34.1%
Race, ethnicity, and origin ACS 2023
- Neighborhood character
- Predominantly White (90%)
- Race & ethnicity
- White 90% Hispanic / Latino 4% Two or more races 3% Asian 2%
- Common ancestry
- Romanian 8% Lithuanian 3% Italian 2%
- Foreign-born
- 4% · Canada, China
- Languages at home
- 94% English-only · Spanish 2% Other Asian/Pacific 1% Other Indo-European 1%
Political lean MEDSL · Oneida
- 2024 margin
- Strong R (+21.3) · D 39.4% · R 60.6%
- 2008→2024 swing
- -15.2pp toward R · 2008: -6.1pp · 2024: -21.3pp
- All cycles
- 2024: R+21.3 2020: R+15.5 2016: R+21.1 2012: R+5.3 2008: R+6.1
Not yet ingested
- Civics
- —
Market trends
- HPI YoY
- ▼ -83.30%
- Current HPI
- 292.0471
- Rent YoY
- —
- Metro
- —
- State GDP YoY
- ▲ 2.60%
- F500 in state
- 92
Industry mix (Fortune 500 HQ in NY)
| Industry | F500 HQs | Revenue |
|---|---|---|
| Financial Services | 10 | $950B |
|
||
| Consumer Goods | 9 | $162B |
|
||
| Insurance | 4 | $225B |
|
||
| Telecommunications | 2 | $144B |
|
||
| Pharmaceuticals | 2 | $112B |
|
||
| Media / Entertainment | 2 | $69B |
|
||
Price history
+108.2% since first listed20 events — show timeline
- 2026-06-11 Pending — CNYIS
- 2026-05-14 Listed $249,900 CNYIS
- 2025-09-17 Listing Removed — CNYIS
- 2025-09-17 Listing Removed — CNYIS
- 2025-09-08 Price Changed $249,900 CNYIS
- 2025-08-07 Price Changed $275,000 CNYIS
- 2025-07-27 Listed $299,900 CNYIS
- 2021-08-03 Sold (MLS) $190,000 CNYIS
- 2021-05-21 Listing Removed — CNYIS
- 2021-05-05 Listed $189,900 CNYIS
- 2017-09-01 Sold (Public Records) $132,000 Public Records
- 2017-09-01 Sold (MLS) $132,000 CNYIS
- 2017-08-30 Sold (MLS) $132,000 CNYIS
- 2017-08-28 Listed $139,900 CNYIS
- 2017-07-01 Listed $139,900 CNYIS
- 2012-11-16 Sold (Public Records) $118,000 Public Records
- 2012-11-16 Sold (MLS) $118,000 CNYIS
- 2012-11-16 Sold (MLS) $118,000 CNYIS
- 2012-02-24 Listed $120,000 CNYIS
- 2012-02-24 Listed $120,000 CNYIS
Property tax history
+11.6%/yrLatest (2025): $1,350 · +5.1% YoY. Source: county tax records.
Cash-flow waterfall
monthlySold comps — $/sqft
last 12 mo · ≤1 miLoading sold comps…