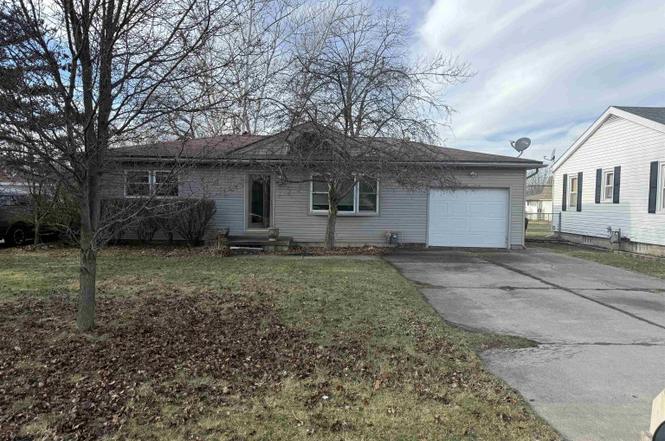
540 S Concetta Dr · West Monroe, MI
Flood risk 1/10 · Minimal
- FEMA flood zone
- X (unshaded)
- Chance of flooding over 30 yrs
- 0.0%
- Est. flood insurance / yr
- $473 – $860
Fire risk 1/10 · Minimal
- Est. fire insurance / yr
- $784 – $1,456
Heat risk 4/10 · Minor
- Hot days now (above 101°F)
- 7 days/yr
- Hot days in 30 yrs
- 16 days/yr
Wind risk 2/10 · Minimal
- Chance of severe wind over 30 yrs
- —
Air-quality risk 4/10 · Minor
- Unhealthy air days now
- 3 days/yr
- Unhealthy air days in 30 yrs
- 6 days/yr
Risk factors via First Street. Map © Google.
Why this score? — see what drove the D+ grade
The composite is a weighted blend of 9 inputs, each scored 0–100. Each bar is that input's sub-score; the figure is the points it added to the 100-point composite (weight × sub-score).
- Cash flow +17.2/30.0
- ARV discount +9.6/15.0
- DSCR +5.4/10.0
- Livability +4.0/5.0
- 1% rule +3.4/10.0
- Schools +3.0/10.0
- Rent growth +2.5/5.0
- Condition / age +2.5/5.0
- Appreciation +0.0/10.0
$149,900
🖨 Deal sheet 📄 Offer letter ✓ Due diligence
Listing remarks MLS
Two bedroom ranch home with attached garage, close to Shopping and Schools , near Parks , Deep lot that is fenced , all appliances stay . natural gas fire place in the living room , gazebo in the back yard, A tree branch went into the main bedroom roof , the roof is fixed, but not the drywall is not yet. looking into dry wall bids, more pictures to come in the next two days of the inside of the house.
Key facts
- Attached garage
- Deep lot
- Fenced
Tags
Neighborhood map
What this means for you Summary
Snapshot
- This is a 3-bed/1.0-bath single-family listed at $150k.
Deal economics
- At list price, monthly cash flow is $107 ($1k/yr) — positive.
- The deal already cash-flows at list — no discount required.
- To meet the 1% rule (rent ≥ 1% of price), the offer needs to be $126k (16.1% below list).
- Recommended offer: $126k (16.1% below list) — sets the bar for 1% rule.
Location & tenants
- Location reads 81/100 on livability (#70 in MI, #1,533 nationally) — a professional / high-income tenant draw. Strengths: commute A+, cost of living A+, housing A+; Watch: schools D-, amenities F, employment F.
- Monroe Public Schools (suburban): math 24% / reading 47% proficiency, ranked #278 of 540 in MI (top 52%) — families likely to look elsewhere, expect single-tenant / working-renter base with shorter leases.
- Market conditions: 142 active listings in the ZIP; 8 comparable units currently listed for rent nearby; rentals lingering (median 44d on market — plan ~5-8 weeks vacancy on turnover, expect pricing pressure); 50% of comp listings sitting > 30 days — soft ceiling on asking rent; 264 units permitted in Monroe County in 2024 (40 in 5+ unit buildings).
Forward outlook
- Local home prices are declining (-3.0%/yr); year-one equity from $1k of loan paydown is wiped out by about $4k of value loss. Plan a longer hold.
- Monroe County population projected at -20% by 2050 — secular population decline; favor cash flow + early exit over multi-decade hold.
Negotiation context
- Only 11 days on market — expect competitive offers; lowballing is unlikely to land.
- 6 sale attempts since 4y ago with the ask held roughly flat each time — persistent listings suggest the price (not the market) is what's stuck; bring a comps-based counter.
Questions for the listing agent
- Built in 1965 — when were the roof, HVAC, electrical panel, plumbing, and water heater last replaced?
- Is there a deadline driving the sale (1031 exchange, divorce, estate, relocation)? That informs how much negotiation room exists.
- Schools are D-rated, which usually means shorter tenancies and higher turnover. Who's the typical renter profile here, and what's been the actual vacancy rate?
- The area grade is low — what's the realistic commute time and amenity access for the typical tenant pool here? Any planned neighborhood developments (good or bad) we should know about?
- What's the average days-on-market for RENTAL listings here right now (not sales)? A rising rental-DOM trend means longer vacancies and softer asking-rent achievability than the comps imply.
- What's the recent tenant-quality profile in this submarket — average credit score on applications, eviction rate, late-payment / NSF rate, and stable-employment percentage? A property-management company in the area should have these aggregated.
- How much new for-sale + rental construction is in the pipeline within 1–3 miles? Heavy new supply typically softens prices + rents 12–24 months out; constrained supply supports both.
Investment metrics
- 1% rule
- 0.84% ✗
- Cap rate
- 7.15%
- Cash-on-cash
- 3.05%
- DSCR
- 1.14
- GRM
- 9.9
CMA / ARV
- ARV (on-the-fly)
- $157,248
- Comps found
- 10
Show comp detail 10 sales within ~0.75 mi
| Address | Dist | Beds/Ba | Sqft | Sold | Price | $/sf | Match |
|---|---|---|---|---|---|---|---|
| 958 Woodville Ave | 0.40mi | 3/1.0 | 920 (-2%) | 2mo | $177,900 | $193 | 76 |
| 804 Rambow Dr | 0.33mi | 2/1.0 (-1) | 900 (-4%) | 11mo | $149,900 | $167 | 64 |
| 958 Western Ave | 0.38mi | 3/1.0 | 1,014 (+8%) | 10mo | $245,000 | $242 | 60 |
| 769 Westwood Dr | 0.31mi | 2/1.0 (-1) | 962 (+3%) | 20mo | $150,000 | $156 | 59 |
| 856 Rambow Dr | 0.38mi | 2/1.0 (-1) | 846 (-10%) | 10mo | $65,000 | $77 | 53 |
| 620 Palmwood Ave | 0.42mi | 3/1.0 | 1,055 (+13%) | 11mo | $145,000 | $137 | 50 |
| 405 Richards Dr | 0.56mi | 3/1.0 | 975 (+4%) | 24mo | $238,000 | $244 | 47 |
| 877 Rambow Dr | 0.39mi | 2/1.0 (-1) | 1,044 (+12%) | 13mo | $133,000 | $127 | 47 |
| 227 Huber Dr | 0.74mi | 2/1.0 (-1) | 836 (-11%) | 4mo | $157,000 | $188 | 40 |
| 211 Huber Dr | 0.72mi | 2/1.0 (-1) | 832 (-11%) | 10mo | $140,007 | $168 | 34 |
Match score weights: distance 35% · size 25% · config 20% · recency 20%. Top-matched comps best support the ARV.
Projected returns pro-forma
-3.0% appreciation · 3.0% rent growth · sell at horizon
- IRR
- -11.5%
- Equity multiple
- 0.58×
- Total profit
- $-17,567
- Equity at exit
- $22,351
- IRR
- -2.4%
- Equity multiple
- 0.84×
- Total profit
- $-6,841
- Equity at exit
- $12,961
Cash invested: $41,972 (down + closing). Projections, not guarantees.
Landlord ↔ Tenant lean methodology
- Overall (STATE)
- 62 Landlord-Friendly
- State Michigan
- 62 Landlord-Friendly · EVEN
- County
- — inherits STATE
- City
- — inherits STATE
ZIP-level market 48161
- Active inventory
- 142
- Price-to-rent
- 9.9×
Monthly cashflow live
- Estimated rent
- $1,258 high interval (Pro) →
- Mortgage (P&I)
- −$786
- Tax from tax record
- −$38 /mo · $462/yr
- Insurance
- −$62
- HOA
- −$0
- Vacancy / Maint / Mgmt
- −$264
- Net cashflow
- $107
Break-even live
UW: 25.0% down · 7.5% · 30yr · 1.5% tax · 5.0% vac · 8.0% maint · 8.0% mgmt
Financing live
Cash to close
- Down payment
- $37,475
- Closing costs
- $4,497
- Reserves months
- —
- Total cash needed
- —
Loan-product check · same deal, 3 products live
Conventional
25% down · 7.5% · 30yr
- Down + closing
- —
- Monthly P&I
- —
- Monthly cashflow
- —
- DSCR
- —
- Eligible?
- —
Personal DTI + credit; lowest rate.
DSCR
20% down · 8.5% · 30yr
- Down + closing
- —
- Monthly P&I
- —
- Monthly cashflow
- —
- DSCR
- —
- Eligible?
- —
No personal income docs; deal must DSCR.
Hard money
10% down · 12.0% · 12mo
- Down + closing
- —
- Monthly P&I
- —
- Monthly cashflow
- —
- DSCR
- —
- Eligible?
- —
Short-term bridge; refi at stabilization.
Rent comps 8 comps
| Address | Beds | Baths | Sqft | Rent | $/sqft | DOM | Units | Dist |
|---|---|---|---|---|---|---|---|---|
| 1985 S Custer Rd Apt 3 Monroe, MI | 2.0 | 1.0 | 1000 | $1,200 | $1.20 | 43d | 1 | 0.14mi |
| 1250 Strandwyck Dr Monroe, MI | 3.0 | 2.0 | 1256 | $1,274 | $1.01 | 13d | 1 | 0.82mi |
| 620 John Anderson Ct Unit 628-28 Monroe, MI | 2.0 | 1.5 | 800 | $1,095 | $1.37 | 43d | 1 | 0.87mi |
| 620 John Anderson Ct Monroe, MI | 1.0–2.0 | 1.0–1.5 | 787 | $1,195 | $1.52 | 2d | 12 | 0.88mi |
| 620 John Anderson Ct Monroe, MI | 1.0–2.0 | 1.0–1.5 | 787 | $1,295 | $1.64 | 43d | 7 | 0.88mi |
| 733 Smith St Monroe, MI | 3.0 | 1.5 | 1000 | $1,500 | $1.50 | 43d | 1 | 1.19mi |
| 1450 S Monroe St Monroe, MI | 1.0–2.0 | 1.0–2.0 | 851 | $1,350 | $1.59 | 23d | 1 | 1.26mi |
| 1250 Josephine Ct Monroe, MI | 1.0–2.0 | 1.0 | 792 | $975 | $1.23 | 4d | 2 | 1.49mi |
Listing history 14 events
-
2026-01-19status Pending
-
2026-01-18status Pending 405-char remark
Show marketing remark (405 chars)
Two bedroom ranch home with attached garage, close to Shopping and Schools , near Parks , Deep lot that is fenced , all appliances stay . natural gas fire place in the living room , gazebo in the back yard, A tree branch went into the main bedroom roof , the roof is fixed, but not the drywall is not yet. looking into dry wall bids, more pictures to come in the next two days of the inside of the house.
-
2026-01-08$149,900 Active
Show marketing remark (405 chars)
Two bedroom ranch home with attached garage, close to Shopping and Schools , near Parks , Deep lot that is fenced , all appliances stay . natural gas fire place in the living room , gazebo in the back yard, A tree branch went into the main bedroom roof , the roof is fixed, but not the drywall is not yet. looking into dry wall bids, more pictures to come in the next two days of the inside of the house.
-
2026-01-08$149,900 Active 405-char remark
Show marketing remark (405 chars)
Two bedroom ranch home with attached garage, close to Shopping and Schools , near Parks , Deep lot that is fenced , all appliances stay . natural gas fire place in the living room , gazebo in the back yard, A tree branch went into the main bedroom roof , the roof is fixed, but not the drywall is not yet. looking into dry wall bids, more pictures to come in the next two days of the inside of the house.
-
2024-02-12historical
-
2024-02-12historical
-
2023-10-31price $129,900
-
2023-10-31price $129,900
-
2023-09-30$139,900 Active
-
2023-09-30$139,900 Active
-
2023-03-07historical
-
2023-03-07historical
-
2022-11-11$179,900 Active
-
2022-11-10$179,900 Active
ⓘ Source: listings_history table (triggers on properties + properties_extension) + one-shot
backfill from property_details.listing_events for pre-trigger history.
Tax reassessment forecast MI · Partial reset (capped growth)
- Current annual tax
- $462 · $38/mo
- Projected year-2 tax
- $1,385 · $115/mo
- Expected delta
- +$923/yr (+$77/mo · 199.9%)
ⓘ Screening estimate from a state-policy table — verify with the county assessor before closing.
Climate risk First Street
- Flood 1/10 Low FEMA zone X (unshaded) · 0% chance over 30 yrs
- Wildfire 1/10 Low
- Heat 4/10 Moderate 7 d/yr ≥101°F today · 16 d/yr by 30 yrs out
- Wind 2/10 Low
- Air quality 4/10 Moderate 3 unhealthy d/yr today · 6 by 30 yrs out
Nearby sold comps map
Loading sold comps map…
Walkable amenities ~0.75 mi
Loading nearby amenities…
Taxation est. · year 1
- Rental income
- $15,095
- − Mortgage interest
- −$8,397
- − Property taxes
- −$462
- − Insurance
- −$750
- − Repairs & maintenance
- −$1,208
- − Management
- −$1,208
- − Depreciation
- −$4,361
- Taxable loss
- −$1,289
- Est. tax savings @ 24.0%
- +$309
- After-tax cash flow
- $1,590/yr
For passive investors: Depreciation is non-cash, so a rental often shows a tax loss while cash-flowing — sheltering income. Rental losses are passive: they offset passive income freely, and up to $25,000/yr can offset ordinary (W-2) income if you actively participate and your MAGI is under $100k (phasing out to $0 by $150k); unused losses carry forward. On sale, claimed depreciation is recaptured at up to 25%, and gains may owe capital-gains tax (a 1031 exchange can defer both). Figures are a year-1 estimate at your 24.0% rate — not tax advice; consult a CPA.
Schools (NCES district)
- District
- Monroe Public Schools
- NCES district ID
- 2624150
- Math proficiency
- 24% ▲ 3.00%
- Reading proficiency
- 47% ▲ 12.00%
- Median HH income
- $46,437
- Composite
- 30.33/100
- National rank
- #6269
- State rank
- #278 of 540 in MI
Livability — West Monroe
- Score
- 81/100
- State rank
- #70
- US rank
- #1533
Category grades
Schools grade is shown separately in the Schools card above.
Census & demographics
- Census place
- West Monroe, MI
- County
- Monroe County · 54,460 people
- Metro
- Monroe, MI
- Population (ZIP)
- 26,304
- Household income
- $67,414
- Rent vs Own
- Severe rent burden
- 733.0
Population outlook (Monroe County) Hauer SSP2
- Today (2025)
- 144,439 people
- By 2030
- 140,033 · -3.1%
- By 2040
- 128,408 · -11.1%
- By 2050
- 115,024 · -20.4%
- By 2075
- 87,273 · -39.6%
- By 2100
- 63,110 · -56.3%
Race, ethnicity, and origin ACS 2023
- Neighborhood character
- Predominantly White (85%)
- Race & ethnicity
- White 85% Two or more races 7% Black 5% Hispanic / Latino 5%
- Common ancestry
- Lithuanian 10% Romanian 8% Italian 2%
- Foreign-born
- 3% · Canada, Jamaica
- Languages at home
- 96% English-only · Spanish 2% Other Indo-European 1% Arabic 1%
Political lean MEDSL · Monroe
- 2024 margin
- Strong R (+27.1) · D 35.7% · R 62.9% · Other 1.4%
- 2008→2024 swing
- -31.5pp toward R · 2008: 4.3pp · 2024: -27.1pp
- All cycles
- 2024: R+27.1 2020: R+22.6 2016: R+22.1 2012: D+1.0 2008: D+4.3
Not yet ingested
- Civics
- —
Market trends
- HPI YoY
- ▼ -178.99%
- Current HPI
- 126.2638
- Rent YoY
- —
- Metro
- Monroe, MI
- State GDP YoY
- ▲ 1.37%
- F500 in state
- 28
Industry mix (Fortune 500 HQ in MI)
| Industry | F500 HQs | Revenue |
|---|---|---|
| Automotive Parts | 3 | $48B |
|
||
| Automotive | 2 | $372B |
|
||
| Chemicals | 1 | $45B |
|
||
| Automotive Retail | 1 | $29B |
|
||
| Healthcare / Medical Devices | 1 | $23B |
|
||
| Automotive Technology | 1 | $20B |
|
||
Price history
-16.7% since first listed14 events — show timeline
- 2026-01-19 Pending — REALCOMP
- 2026-01-18 Pending — MiRealSource-MiMLS
- 2026-01-08 Listed $149,900 MiRealSource-MiMLS
- 2026-01-08 Listed $149,900 REALCOMP
- 2024-02-12 Listing Removed — MiRealSource-MiMLS
- 2024-02-12 Listing Removed — REALCOMP
- 2023-10-31 Price Changed $129,900 MiRealSource-MiMLS
- 2023-10-31 Price Changed $129,900 REALCOMP
- 2023-09-30 Listed $139,900 MiRealSource-MiMLS
- 2023-09-30 Listed $139,900 REALCOMP
- 2023-03-07 Listing Removed — MiRealSource-MiMLS
- 2023-03-07 Listing Removed — REALCOMP
- 2022-11-11 Listed $179,900 REALCOMP
- 2022-11-10 Listed $179,900 MiRealSource-MiMLS
Property tax history
-5.3%/yrLatest (2025): $462 · -63.3% YoY. Source: county tax records.
Cash-flow waterfall
monthlySold comps — $/sqft
last 12 mo · ≤1 miLoading sold comps…