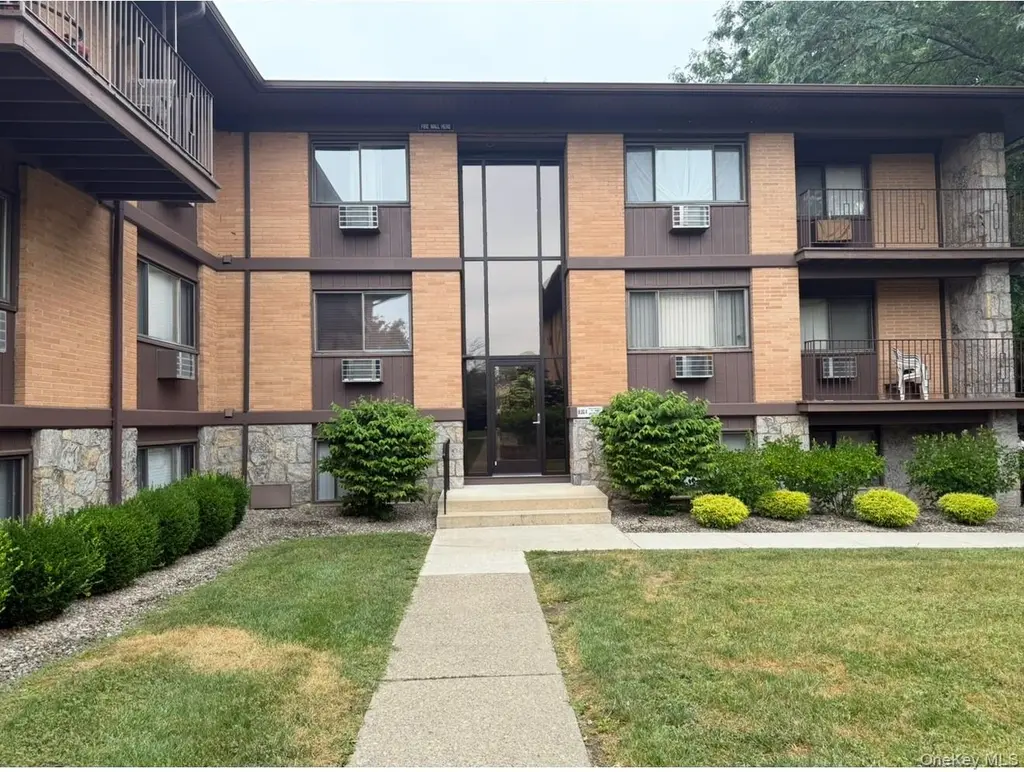
10 Oakwood Ter #65 · New Windsor, NY
Flood risk 1/10 · Minimal
- FEMA flood zone
- X (unshaded)
- Chance of flooding over 30 yrs
- 0.0%
- Est. flood insurance / yr
- $507 – $1,088
Fire risk 1/10 · Minimal
- Est. fire insurance / yr
- $691 – $1,283
Heat risk 5/10 · Moderate
- Hot days now (above 99°F)
- 7 days/yr
- Hot days in 30 yrs
- 16 days/yr
Wind risk 4/10 · Minor
- Chance of severe wind over 30 yrs
- 16.0%
Air-quality risk 3/10 · Minor
- Unhealthy air days now
- 2 days/yr
- Unhealthy air days in 30 yrs
- 3 days/yr
Risk factors via First Street. Map © Google.
Why this score? — see what drove the C- grade
The composite is a weighted blend of 9 inputs, each scored 0–100. Each bar is that input's sub-score; the figure is the points it added to the 100-point composite (weight × sub-score).
- ARV discount +14.5/15.0
- Cash flow +13.1/30.0
- 1% rule +9.9/10.0
- DSCR +3.9/10.0
- Schools +3.5/10.0
- Livability +3.4/5.0
- Rent growth +2.5/5.0
- Condition / age +2.5/5.0
- Appreciation +0.0/10.0
$134,900
🖨 Deal sheet 📄 Offer letter ✓ Due diligence
Listing remarks MLS
Why Rent when you can own this immaculate top floor unit at Oakwood Terrace! This inviting and spacious 1 bedroom and 1 bathroom unit has been freshly painted and meticulously maintained. Steps to the pool, laundry, and parking, this unit will not disappoint!
Key facts
- Community pool
- Landscaped grounds
- Private balcony
Tags
Property features AI
Finance
- HOA & community: Has association; Monthly association fee of $664; Association fee includes common area maintenance, exterior maintenance, grounds care, pool service, snow removal, trash, and water
Exterior
- Parking: Off-street parking; Parking lot
- Utilities: Public sewer; Cable available
- Home design: Stock Cooperative; Entry level is 1
- Construction: Block construction
- Exterior features: Block construction; Not waterfront
Interior
- Kitchen: Range; Refrigerator
- Bedrooms: 4 total rooms (bedroom count not specified separately)
- Bathrooms: 1 full bathroom
- Heating & cooling: Wall/window air conditioning units; Other heating
- Interior features: Other interior features
Neighborhood map
What this means for you Summary
Snapshot
- This is a 1-bed/1.0-bath condo listed at $135k.
Deal economics
- At list price, monthly cash flow is $-5 ($-58/yr) — negative.
- To cash-flow at today's rent, offer at most $134k (0.5% below list).
- Meets the 1% rule at list price ($2k rent vs $135k).
- Recommended offer: $131k (3.0% below list) — sets the bar for market timing.
- Cap rate 6.3% vs local median 3.8% in New Windsor — top-decile yield for the area; either an underpriced asset or a hidden risk that comps aren't pricing in. Stress-test before assuming the spread holds.
Location & tenants
- Location reads 68/100 on livability (#529 in NY) — a middle-class / working-renter tenant base. Strengths: housing A+, health & safety A, employment B+; Watch: crime C-, cost of living D+, amenities F.
- Newburgh City School District (suburban): math 33% / reading 48% proficiency, ranked #500 of 590 in NY (top 85%) — families likely to look elsewhere, expect single-tenant / working-renter base with shorter leases; 61% free/reduced lunch — lower-income household profile, screen leases tightly.
- Zoned schools: New Windsor School (math 47% / reading 52%, grade D, #1,085 of 2,108 statewide, top 56%, 418 students, 60% FRL); Newburgh Free Academy (math 76% / reading 85%, grade A, #506 of 1,100 statewide, top 46%, 3,433 students, 56% FRL) — zoned schools at 58% FRL track the district average.
- Zoned-school proficiency averages 65% at this address vs 40% district-wide (+24 pts) — the actual schools serving this property are materially stronger than the Newburgh City School District average implies; a family-tenant draw the district grade alone would hide.
- Market conditions: 169 active listings in the ZIP; 6 comparable units currently listed for rent nearby; rentals leasing fast (median 14d on market — plan ~1-2 weeks tenant-placement turnaround); solid renter incomes; 1,746 units permitted in Orange County in 2024 (1,265 in 5+ unit buildings).
Forward outlook
- Local home prices are declining (-3.0%/yr); year-one equity from $933 of loan paydown is wiped out by about $4k of value loss. Plan a longer hold.
Negotiation context
- It's been on market 45 days — a 3% lower offer ($131k) is reasonable based on typical stale-listing flexibility.
- 6 sale attempts since 12y ago with the ask held roughly flat each time — persistent listings suggest the price (not the market) is what's stuck; bring a comps-based counter.
- Current owner paid $100k; 35% above their basis — modest negotiation headroom, anchor on the comps not their cost.
Risks & watch-outs
- Watch-outs: HOA is 33% of rent.
- Climate carrying-cost: extreme-heat days projected 7→16/yr by 2055 (HVAC capex compounding) — expect insurance premiums to compound above CPI over the hold.
Questions for the listing agent
- What do current leases actually rent for vs. the listed asking? Can we see a recent rent roll and the last 12 months of T-12 income?
- It's been on market 45 days. Have you received any prior offers? Is the seller open to a 3% concession, seller financing, or rate buy-down credit?
- Built in 1960 — when were the roof, HVAC, electrical panel, plumbing, and water heater last replaced?
- What does the HOA fee cover, when was the last increase, and are there any pending special assessments or reserve-fund shortfalls?
- Any open or pending special assessments — roof, HVAC, plumbing, elevator, façade? What's the per-unit balance and payoff schedule, and is the seller paying it off at close or rolling it to the buyer?
- Is there a deadline driving the sale (1031 exchange, divorce, estate, relocation)? That informs how much negotiation room exists.
- What's the average days-on-market for RENTAL listings here right now (not sales)? A rising rental-DOM trend means longer vacancies and softer asking-rent achievability than the comps imply.
- What's the recent tenant-quality profile in this submarket — average credit score on applications, eviction rate, late-payment / NSF rate, and stable-employment percentage? A property-management company in the area should have these aggregated.
- How much new apartment / multifamily construction is in the pipeline within 1–3 miles? Heavy new supply (>2% of stock underway) typically softens rents 12–24 months out; light construction supports rent growth.
Investment metrics
- 1% rule
- 1.49% ✓
- Cap rate
- 6.25%
- Cash-on-cash
- -0.15%
- DSCR
- 0.99
- GRM
- 5.6
CMA / ARV
- ARV (median comp)
- $159,568
- List price
- $134,900
- Delta
- -15.46%
- Verdict
- UNDERPRICED
- Comps
- 20 within 1.0 mi
Projected returns pro-forma
-3.0% appreciation · 3.0% rent growth · sell at horizon
- IRR
- -16.1%
- Equity multiple
- 0.42×
- Total profit
- $-21,727
- Equity at exit
- $20,114
- IRR
- -7.2%
- Equity multiple
- 0.54×
- Total profit
- $-17,532
- Equity at exit
- $11,664
Cash invested: $37,772 (down + closing). Projections, not guarantees.
Landlord ↔ Tenant lean methodology
- Overall (STATE)
- 15 Strongly Tenant-Friendly
- State New York
- 15 Strongly Tenant-Friendly · D+10
- County
- — inherits STATE
- City
- — inherits STATE
ZIP-level market 12553
- Home prices YoY
- -31.7%
- Active inventory
- 169
- Price-to-rent
- 5.6×
Monthly cashflow live
- Estimated rent
- $2,015 high interval (Pro) →
- Mortgage (P&I)
- −$707
- Tax est. 1.5%
- −$169 /mo · $2,024/yr
- Insurance
- −$56
- HOA
- −$664
- Vacancy / Maint / Mgmt
- −$423
- Net cashflow
- $-5
Break-even live
UW: 25.0% down · 7.5% · 30yr · 1.5% tax · 5.0% vac · 8.0% maint · 8.0% mgmt
Financing live
Cash to close
- Down payment
- $33,725
- Closing costs
- $4,047
- Reserves months
- —
- Total cash needed
- —
Loan-product check · same deal, 3 products live
Conventional
25% down · 7.5% · 30yr
- Down + closing
- —
- Monthly P&I
- —
- Monthly cashflow
- —
- DSCR
- —
- Eligible?
- —
Personal DTI + credit; lowest rate.
DSCR
20% down · 8.5% · 30yr
- Down + closing
- —
- Monthly P&I
- —
- Monthly cashflow
- —
- DSCR
- —
- Eligible?
- —
No personal income docs; deal must DSCR.
Hard money
10% down · 12.0% · 12mo
- Down + closing
- —
- Monthly P&I
- —
- Monthly cashflow
- —
- DSCR
- —
- Eligible?
- —
Short-term bridge; refi at stabilization.
Rent comps 6 comps
| Address | Beds | Baths | Sqft | Rent | $/sqft | DOM | Units | Dist |
|---|---|---|---|---|---|---|---|---|
| 34 Cross St New Windsor, NY | 2.0 | 1.0 | 992 | $2,250 | $2.27 | 43d | 1 | 0.52mi |
| 40 Cedar Ln Unit 9 New Windsor, NY | 1.0 | 1.0 | 770 | $1,700 | $2.21 | 13d | 1 | 0.69mi |
| 810 Blooming Grove Tpke New Windsor, NY | 1.0 | 1.0 | 680 | $1,875 | $2.76 | 13d | 2 | 1.14mi |
| 276 Temple Hill Rd New Windsor, NY | 1.0–2.0 | 1.0–1.5 | 1048 | $1,795 | $1.71 | 13d | 2 | 1.14mi |
| 2201 Vails Gate Heights Dr Vails Gate, NY | 1.0–2.0 | 1.0 | 897 | $1,995 | $2.22 | 13d | 9 | 1.27mi |
| 109 Myrtle Ave New Windsor, NY | 2.0 | 1.0 | 1079 | $2,200 | $2.04 | 43d | 1 | 1.43mi |
HOA detail condo
- Monthly dues
- $664 · $7,968/yr
- Likely covers
- pool
- Assessments
- None detected in remarks — confirm with the listing agent.
Listing history 32 events
-
2026-06-18days on market $134,900 Active 45 DOM
-
2026-06-17days on market $134,900 Active 44 DOM
-
2026-06-16days on market $134,900 Active 43 DOM
-
2026-06-15days on market $134,900 Active 42 DOM
-
2026-06-14days on market $134,900 Active 40 DOM
-
2026-06-13days on market $134,900 Active 39 DOM
-
2026-06-10days on market $134,900 Active 37 DOM
-
2026-06-09days on market $134,900 Active 36 DOM
-
2026-06-08days on market $134,900 Active 35 DOM
-
2026-06-07days on market $134,900 Active 34 DOM
-
2026-06-03days on market $134,900 Active 30 DOM
-
2026-06-02days on market $134,900 Active 29 DOM
-
2026-06-01days on market $134,900 Active 28 DOM
-
2026-05-31days on market $134,900 Active 27 DOM
-
2026-05-30days on market $134,900 Active 26 DOM
-
2026-05-04status Active
-
2026-05-04historical
-
2026-05-04$134,900 Active 772-char remark
-
2026-04-28historical
-
2025-10-29price $139,000
-
2025-09-21$144,000 Active
-
2022-01-07soldstatus $99,900 Closed
Show marketing remark (259 chars)
Why Rent when you can own this immaculate top floor unit at Oakwood Terrace! This inviting and spacious 1 bedroom and 1 bathroom unit has been freshly painted and meticulously maintained. Steps to the pool, laundry, and parking, this unit will not disappoint!
-
2021-08-27status Pending
Show marketing remark (259 chars)
Why Rent when you can own this immaculate top floor unit at Oakwood Terrace! This inviting and spacious 1 bedroom and 1 bathroom unit has been freshly painted and meticulously maintained. Steps to the pool, laundry, and parking, this unit will not disappoint!
-
2021-07-06$99,900 Active
Show marketing remark (259 chars)
Why Rent when you can own this immaculate top floor unit at Oakwood Terrace! This inviting and spacious 1 bedroom and 1 bathroom unit has been freshly painted and meticulously maintained. Steps to the pool, laundry, and parking, this unit will not disappoint!
-
2014-09-03price $42,000 Sold
-
2014-09-03soldstatus $42,000 Sold
-
2014-08-08historical Pending
-
2014-08-08price $45,000
-
2014-04-30price $45,000
-
2014-04-25status Active
-
2014-04-08historical Expired
-
2014-04-05$59,900 Active
ⓘ Source: listings_history table (triggers on properties + properties_extension) + one-shot
backfill from property_details.listing_events for pre-trigger history.
Climate risk First Street
- Flood 1/10 Low FEMA zone X (unshaded) · 0% chance over 30 yrs
- Wildfire 1/10 Low
- Heat 5/10 Major 7 d/yr ≥99°F today · 16 d/yr by 30 yrs out
- Wind 4/10 Moderate 16% chance of damaging wind over 30 yrs
- Air quality 3/10 Moderate 2 unhealthy d/yr today · 3 by 30 yrs out
Nearby sold comps map
Loading sold comps map…
Walkable amenities ~0.75 mi
Loading nearby amenities…
Taxation est. · year 1
- Rental income
- $24,174
- − Mortgage interest
- −$7,556
- − Property taxes
- −$2,024
- − Insurance
- −$674
- − Repairs & maintenance
- −$1,934
- − Management
- −$1,934
- − HOA
- −$7,968
- − Depreciation
- −$3,924
- Taxable loss
- −$1,841
- Est. tax savings @ 24.0%
- +$442
- After-tax cash flow
- $384/yr
For passive investors: Depreciation is non-cash, so a rental often shows a tax loss while cash-flowing — sheltering income. Rental losses are passive: they offset passive income freely, and up to $25,000/yr can offset ordinary (W-2) income if you actively participate and your MAGI is under $100k (phasing out to $0 by $150k); unused losses carry forward. On sale, claimed depreciation is recaptured at up to 25%, and gains may owe capital-gains tax (a 1031 exchange can defer both). Figures are a year-1 estimate at your 24.0% rate — not tax advice; consult a CPA.
Schools (NCES district)
- District
- Newburgh City School District
- NCES district ID
- 3620700
- Math proficiency
- 33% ▼ -8.00%
- Reading proficiency
- 48% ▲ 10.00%
- Median HH income
- $56,387
- Composite
- 35.46/100
- National rank
- #4927
- State rank
- #500 of 590 in NY
Livability — New Windsor
- Score
- 68/100
- State rank
- #529
- US rank
- #9423
Category grades
Schools grade is shown separately in the Schools card above.
Census & demographics
- Census place
- New Windsor, NY
- County
- Orange County · 267,004 people
- City population
- 27,384
- Metro
- Poughkeepsie-Newburgh-Middletown, NY
- Population (ZIP)
- 27,384
- Household income
- $92,757
- Rent vs Own
- Severe rent burden
- 960.0
Population outlook (Orange County) Hauer SSP2
- Today (2025)
- 379,830 people
- By 2030
- 378,955 · -0.2%
- By 2040
- 375,444 · -1.2%
- By 2050
- 369,311 · -2.8%
- By 2075
- 354,233 · -6.7%
- By 2100
- 318,150 · -16.2%
Race, ethnicity, and origin ACS 2023
- Neighborhood character
- Diverse neighborhood (Simpson 0.62)
- Race & ethnicity
- White 53% Hispanic / Latino 27% Black 13% Two or more races 9% Asian 5%
- Hispanic origin (detail)
- Mexican 3% Puerto Rican 14% Dominican 5%
- Common ancestry
- Romanian 3% Slovak 2% Portuguese 1%
- Foreign-born
- 14% · Canada, China, Vietnam
- Languages at home
- 76% English-only · Spanish 16% Other Indo-European 2% Chinese 1%
Political lean MEDSL · Orange
- 2024 margin
- Lean R (+8.4) · D 45.8% · R 54.2%
- 2008→2024 swing
- -12.5pp toward R · 2008: 4.1pp · 2024: -8.4pp
- All cycles
- 2024: R+8.4 2020: R+0.2 2016: R+6.5 2012: D+5.2 2008: D+4.1
Not yet ingested
- Civics
- —
Market trends
- HPI YoY
- ▼ -145.96%
- Current HPI
- 314.8506
- Rent YoY
- —
- Metro
- Poughkeepsie-Newburgh-Middletown, NY
- State GDP YoY
- ▲ 2.60%
- F500 in state
- 92
Industry mix (Fortune 500 HQ in NY)
| Industry | F500 HQs | Revenue |
|---|---|---|
| Financial Services | 10 | $950B |
|
||
| Consumer Goods | 9 | $162B |
|
||
| Insurance | 4 | $225B |
|
||
| Telecommunications | 2 | $144B |
|
||
| Pharmaceuticals | 2 | $112B |
|
||
| Media / Entertainment | 2 | $69B |
|
||
Price history
+125.2% since first listed17 events — show timeline
- 2026-05-04 Relisted — OneKey® MLS as Distributed by MLS Grid
- 2026-05-04 Listed $134,900 OneKey® MLS as Distributed by MLS Grid
- 2026-05-04 Listing Removed — OneKey® MLS as Distributed by MLS Grid
- 2026-04-28 Listing Removed — OneKey® MLS as Distributed by MLS Grid
- 2025-10-29 Price Changed $139,000 OneKey® MLS as Distributed by MLS Grid
- 2025-09-21 Listed $144,000 OneKey® MLS as Distributed by MLS Grid
- 2022-01-07 Sold (MLS) $99,900 OneKey® MLS as Distributed by MLS Grid
- 2021-08-27 Pending — OneKey® MLS as Distributed by MLS Grid
- 2021-07-06 Listed $99,900 OneKey® MLS as Distributed by MLS Grid
- 2014-09-03 Sold (MLS) $42,000 HGMLS
- 2014-09-03 Price Changed $42,000 HGMLS
- 2014-08-08 Contingent — HGMLS
- 2014-08-08 Price Changed $45,000 HGMLS
- 2014-04-30 Price Changed $45,000 HGMLS
- 2014-04-25 Relisted — HGMLS
- 2014-04-08 Delisted — HGMLS
- 2014-04-05 Listed $59,900 HGMLS
Cash-flow waterfall
monthlySold comps — $/sqft
last 12 mo · ≤1 miLoading sold comps…