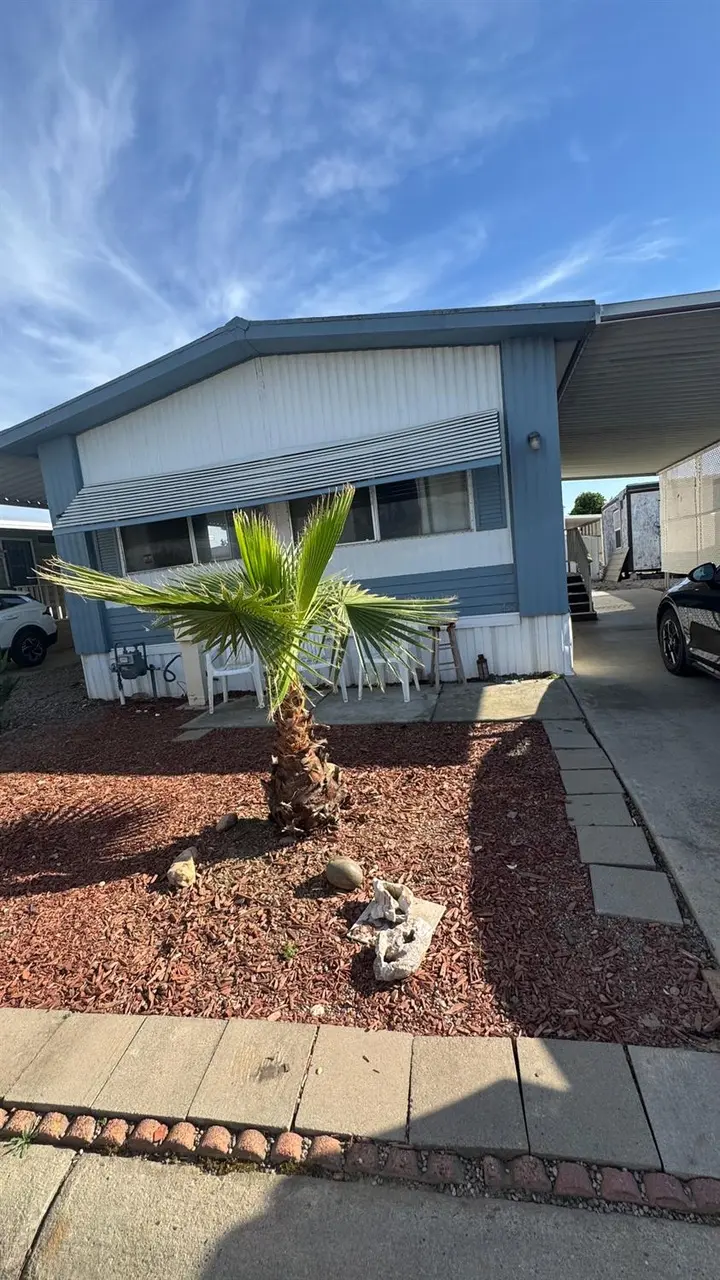
1218 E Cleveland Ave #98 · Madera, CA
Flood risk 8/10 · Major
- FEMA flood zone
- X (unshaded)
- Chance of flooding over 30 yrs
- 0.99%
- Est. flood insurance / yr
- $507 – $1,088
Fire risk 9/10 · Severe
- Est. fire insurance / yr
- $659 – $1,223
Heat risk 8/10 · Major
- Hot days now (above 106°F)
- 6 days/yr
- Hot days in 30 yrs
- 14 days/yr
Wind risk 1/10 · Minimal
- Chance of severe wind over 30 yrs
- —
Air-quality risk 10/10 · Severe
- Unhealthy air days now
- 38 days/yr
- Unhealthy air days in 30 yrs
- 40 days/yr
Risk factors via First Street. Map © Google.
Why this score? — see what drove the D grade
The composite is a weighted blend of 9 inputs, each scored 0–100. Each bar is that input's sub-score; the figure is the points it added to the 100-point composite (weight × sub-score).
- Cash flow +15.0/30.0
- ARV discount +9.2/15.0
- 1% rule +5.0/10.0
- DSCR +5.0/10.0
- Schools +2.7/10.0
- Livability +2.6/5.0
- Rent growth +2.5/5.0
- Condition / age +2.5/5.0
- Appreciation +0.0/10.0
$36,500
🖨 Deal sheet (PDF) 📄 Offer letter ✓ Due diligence
Listing remarks MLS
This home is located within the Meadows Mobile Home Park, a 55+ community. It features a nice open floor plan with laminate flooring in the living and dining areas, along with ample storage space throughout.With a little imagination, this home could truly shine again. It is centrally located within the park, providing easy access to the office, clubhouse, and pool.
Key facts
- 10.85 acre lot
- Community pool
- Built 1975
Neighborhood map
What this means for you Summary
Snapshot
- This is a 2-bed/1.0-bath other listed at $36k.
Deal economics
- At list price, monthly cash flow is $1k ($13k/yr) — positive.
- The deal already cash-flows at list — no discount required.
- Meets the 1% rule at list price ($2k rent vs $36k).
- Recommended offer: $34k (6.0% below list) — sets the bar for market timing.
- Cap rate 42.8% vs local median 4.1% in Madera — top-decile yield for the area; either an underpriced asset or a hidden risk that comps aren't pricing in. Stress-test before assuming the spread holds.
Location & tenants
- Location reads 51/100 on livability (#1,053 in CA) — a working-class tenant base; expect higher turnover. Strengths: housing A+; Watch: amenities F, commute F, employment D-.
- Madera Unified (urban): math 22% / reading 35% proficiency, ranked #1,095 of 1,400 in CA (top 78%) — low school quality limits family demand, transient renter base, plan for 1-2y turnover; 75% free/reduced lunch — lower-income household profile, screen leases tightly.
- Zoned schools: Millview Elementary (636 students, 99% FRL); Martin Luther King Jr. Middle (919 students, 97% FRL); Madera South High (1,994 students, 93% FRL) — zoned schools average 96% FRL vs 75% district-wide (21 pts higher); higher-poverty schools than district average — tighter screening recommended.
- Market conditions: 125 active listings in the ZIP; 2 comparable units currently listed for rent nearby; 1,346 units permitted in Madera County in 2024 (8 in 5+ unit buildings).
- This rent runs 32% of the median local income ($62k/yr) — at the standard rent-burdened threshold; future hikes will face affordability resistance.
Forward outlook
- Local home prices are declining (-3.0%/yr); year-one equity from $252 of loan paydown is wiped out by about $1k of value loss. Plan a longer hold.
- Madera County population projected at +6% by 2050 — modest demand growth; plan on rents tracking national, not racing it.
- At projected returns (-3.0% appreciation + 3.0% rent growth), your $10k cash investment doubles in ~1 year — after that, you're playing with house money.
Negotiation context
- It's been on market 83 days — a 6% lower offer ($34k) is reasonable based on typical stale-listing flexibility.
Risks & watch-outs
- Watch-outs: flood insurance adds $66/mo.
- Climate carrying-cost: severe flood risk; severe wildfire risk; extreme-heat days projected 6→14/yr by 2055 (HVAC capex compounding) — expect insurance premiums to compound above CPI over the hold.
Questions for the listing agent
- It's been on market 83 days. Have you received any prior offers? Is the seller open to a 6% concession, seller financing, or rate buy-down credit?
- Built in 1975 — when were the roof, HVAC, electrical panel, plumbing, and water heater last replaced?
- What's the actual annual flood-insurance premium (NFIP or private), and is the property in a SFHA with mandatory coverage?
- Why hasn't it sold? Are there any deal-killer items the seller is aware of (foundation, flood, title, zoning, code violations)?
- Is there a deadline driving the sale (1031 exchange, divorce, estate, relocation)? That informs how much negotiation room exists.
- Schools are F-rated, which usually means shorter tenancies and higher turnover. Who's the typical renter profile here, and what's been the actual vacancy rate?
- The area grade is low — what's the realistic commute time and amenity access for the typical tenant pool here? Any planned neighborhood developments (good or bad) we should know about?
- What's the average days-on-market for RENTAL listings here right now (not sales)? A rising rental-DOM trend means longer vacancies and softer asking-rent achievability than the comps imply.
- What's the recent tenant-quality profile in this submarket — average credit score on applications, eviction rate, late-payment / NSF rate, and stable-employment percentage? A property-management company in the area should have these aggregated.
- How much new for-sale + rental construction is in the pipeline within 1–3 miles? Heavy new supply typically softens prices + rents 12–24 months out; constrained supply supports both.
Investment metrics
- 1% rule
- 4.62% ✓
- Cap rate
- 42.80%
- Cash-on-cash
- 130.37%
- DSCR
- 6.80
- GRM
- 1.8
CMA / ARV
- ARV (median comp)
- $37,934
- List price
- $36,500
- Delta
- -3.78%
- Verdict
- FAIR
- Comps
- 2 within 1.0 mi
Projected returns pro-forma
-3.0% appreciation · 3.0% rent growth · sell at horizon
- IRR
- —
- Equity multiple
- 6.93×
- Total profit
- $60,616
- Equity at exit
- $5,442
- IRR
- —
- Equity multiple
- 14.56×
- Total profit
- $138,586
- Equity at exit
- $3,156
Cash invested: $10,220 (down + closing). Projections, not guarantees.
Landlord ↔ Tenant lean methodology
- Overall (STATE)
- 18 Strongly Tenant-Friendly
- State California
- 18 Strongly Tenant-Friendly · D+13
- County
- — inherits STATE
- City
- — inherits STATE
ZIP-level market 93638
- Home prices YoY
- -30.1%
- Active inventory
- 125
- Price-to-rent
- 1.8×
Monthly cashflow live
- Estimated rent
- $1,688 medium interval (Pro) →
- Mortgage (P&I)
- −$191
- Tax from tax record
- −$16 /mo · $197/yr
- Insurance
- −$15
- Flood insurance flood zone
- −$66 /mo · $798/yr
- HOA
- −$0
- Vacancy / Maint / Mgmt
- −$354
- Net cashflow
- $1,044
Break-even live
Sensitivity live
| Price | -10% $1,064 | -5% $1,054 | +0% $1,044 | +5% $1,033 | +10% $1,023 |
|---|---|---|---|---|---|
| Rent | -10% $910 | -5% $977 | +0% $1,044 | +5% $1,110 | +10% $1,177 |
| Rate | -1.0pp $1,062 | -0.5pp $1,053 | base $1,044 | +0.5pp $1,034 | +1.0pp $1,025 |
UW: 25.0% down · 7.5% · 30yr · 1.5% tax · 5.0% vac · 8.0% maint · 8.0% mgmt
Financing live
Cash to close
- Down payment
- $9,125
- Closing costs
- $1,095
- Reserves months
- —
- Total cash needed
- —
Loan-product check · same deal, 3 products live
Conventional
25% down · 7.5% · 30yr
- Down + closing
- —
- Monthly P&I
- —
- Monthly cashflow
- —
- DSCR
- —
- Eligible?
- —
Personal DTI + credit; lowest rate.
DSCR
20% down · 8.5% · 30yr
- Down + closing
- —
- Monthly P&I
- —
- Monthly cashflow
- —
- DSCR
- —
- Eligible?
- —
No personal income docs; deal must DSCR.
Hard money
10% down · 12.0% · 12mo
- Down + closing
- —
- Monthly P&I
- —
- Monthly cashflow
- —
- DSCR
- —
- Eligible?
- —
Short-term bridge; refi at stabilization.
Rent comps 2 comps
| Address | Beds | Baths | Sqft | Rent | $/sqft | DOM | Units | Dist |
|---|---|---|---|---|---|---|---|---|
| 924 E Yosemite Ave Unit 101 Madera, CA | 1.0 | 1.0 | 492 | $1,220 | $2.48 | 45d | 1 | 0.36mi |
| 117 S K St Unit A Madera, CA | 2.0 | 1.0 | 750 | $1,550 | $2.07 | 15d | 1 | 1.36mi |
Listing history 19 events
-
2026-06-21days on market $36,500 Active 83 DOM
-
2026-06-19days on market $36,500 Active 81 DOM
-
2026-06-18days on market $36,500 Active 80 DOM
-
2026-06-17days on market $36,500 Active 79 DOM
-
2026-06-16days on market $36,500 Active 78 DOM
-
2026-06-15days on market $36,500 Active 77 DOM
-
2026-06-14days on market $36,500 Active 75 DOM
-
2026-06-13days on market $36,500 Active 74 DOM
-
2026-06-10days on market $36,500 Active 72 DOM
-
2026-06-09days on market $36,500 Active 71 DOM
-
2026-06-08days on market $36,500 Active 70 DOM
-
2026-06-07days on market $36,500 Active 69 DOM
-
2026-06-05days on market $36,500 Active 66 DOM
-
2026-06-03days on market $36,500 Active 65 DOM
-
2026-06-02days on market $36,500 Active 64 DOM
-
2026-06-01days on market $36,500 Active 63 DOM
-
2026-05-31days on market $36,500 Active 62 DOM
-
2026-05-30days on market $36,500 Active 61 DOM
-
2026-03-28$38,000 Active 367-char remark
Show marketing remark (367 chars)
This home is located within the Meadows Mobile Home Park, a 55+ community. It features a nice open floor plan with laminate flooring in the living and dining areas, along with ample storage space throughout.With a little imagination, this home could truly shine again. It is centrally located within the park, providing easy access to the office, clubhouse, and pool.
ⓘ Source: listings_history table (triggers on properties + properties_extension) + one-shot
backfill from property_details.listing_events for pre-trigger history.
Tax reassessment forecast CA · Resets to sale price
- Current annual tax
- $197 · $16/mo
- Projected year-2 tax
- $277 · $23/mo
- Expected delta
- +$80/yr (+$7/mo · 40.5%)
ⓘ Screening estimate from a state-policy table — verify with the county assessor before closing.
Climate risk First Street
- Flood 8/10 Severe FEMA zone X (unshaded) · 99% chance over 30 yrs
- Wildfire 9/10 Extreme
- Heat 8/10 Severe 6 d/yr ≥106°F today · 14 d/yr by 30 yrs out
- Wind 1/10 Low
- Air quality 10/10 Extreme 38 unhealthy d/yr today · 40 by 30 yrs out
Nearby sold comps map
Loading sold comps map…
Walkable amenities ~0.75 mi
Loading nearby amenities…
Taxation est. · year 1
- Rental income
- $20,254
- − Mortgage interest
- −$2,045
- − Property taxes
- −$197
- − Insurance
- −$980
- − Repairs & maintenance
- −$1,620
- − Management
- −$1,620
- − Depreciation
- −$1,062
- Taxable income
- $12,729
- Est. tax owed @ 24.0%
- −$3,055
- After-tax cash flow
- $9,471/yr
For passive investors: Depreciation is non-cash, so a rental often shows a tax loss while cash-flowing — sheltering income. Rental losses are passive: they offset passive income freely, and up to $25,000/yr can offset ordinary (W-2) income if you actively participate and your MAGI is under $100k (phasing out to $0 by $150k); unused losses carry forward. On sale, claimed depreciation is recaptured at up to 25%, and gains may owe capital-gains tax (a 1031 exchange can defer both). Figures are a year-1 estimate at your 24.0% rate — not tax advice; consult a CPA.
Schools (NCES district)
- District
- Madera Unified
- NCES district ID
- 0623340
- Math proficiency
- 22% ▬ 0.00%
- Reading proficiency
- 35% ▲ 2.00%
- Median HH income
- $43,446
- Composite
- 27.2/100
- National rank
- #12454
- State rank
- #1095 of 1400 in CA
Livability — Madera
- Score
- 51/100
- State rank
- #1053
- US rank
- #25190
Category grades
Schools grade is shown separately in the Schools card above.
Census & demographics
- Census place
- Madera, CA
- County
- Madera County · 133,170 people
- City population
- 109,650
- Metro
- Madera, CA
- Population (ZIP)
- 50,571
- Household income
- $62,374
- Rent vs Own
- Severe rent burden
- 1707.0
Population outlook (Madera County) Hauer SSP2
- Today (2025)
- 157,915 people
- By 2030
- 159,604 · +1.1%
- By 2040
- 163,454 · +3.5%
- By 2050
- 167,071 · +5.8%
- By 2075
- 171,182 · +8.4%
- By 2100
- 162,781 · +3.1%
Race, ethnicity, and origin ACS 2023
- Neighborhood character
- Predominantly Hispanic (83%)
- Race & ethnicity
- Hispanic / Latino 83% Two or more races 22% White 11% Asian 2% Black 2% Native American 1%
- Hispanic origin (detail)
- Mexican 80%
- Common ancestry
- Lithuanian 1%
- Foreign-born
- 32% · Canada
- Languages at home
- 29% English-only · Spanish 69% Other Indo-European 2%
Political lean MEDSL · Madera
- 2024 margin
- Strong R (+20.8) · D 38.4% · R 59.2% · Other 2.4%
- 2008→2024 swing
- -7.5pp toward R · 2008: -13.3pp · 2024: -20.8pp
- All cycles
- 2024: R+20.8 2020: R+11.6 2016: R+17.3 2012: R+19.4 2008: R+13.3
Not yet ingested
- Civics
- —
Market trends
- HPI YoY
- ▼ -197.33%
- Current HPI
- 458.5577
- Rent YoY
- —
- Metro
- Madera, CA
- State GDP YoY
- ▲ 3.21%
- F500 in state
- 116
Industry mix (Fortune 500 HQ in CA)
| Industry | F500 HQs | Revenue |
|---|---|---|
| Technology | 27 | $1,492B |
|
||
| Financial Services | 3 | $174B |
|
||
| Retail | 3 | $44B |
|
||
| Insurance | 3 | $26B |
|
||
| Media / Entertainment | 2 | $115B |
|
||
| Pharmaceuticals / Biotech | 2 | $62B |
|
||
Price history
1 event — show timeline
- 2026-03-28 Listed $38,000 FRESNOMLS
Property tax history
+3.3%/yrLatest (2017): $197 · +2.9% YoY. Source: county tax records.
Cash-flow waterfall
monthlySold comps — $/sqft
last 12 mo · ≤1 miLoading sold comps…