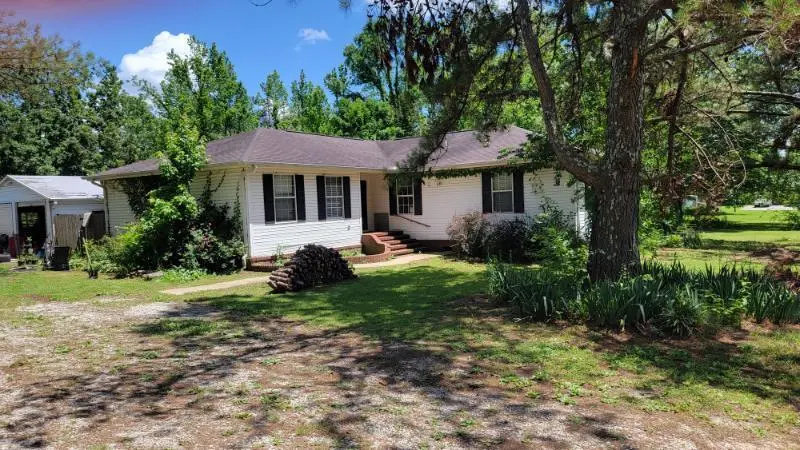
8 CR 8121 · Booneville, MS
Flood risk 1/10 · Minimal
- FEMA flood zone
- X (unshaded)
- Chance of flooding over 30 yrs
- 0.0%
- Est. flood insurance / yr
- $507 – $1,088
Fire risk 7/10 · Major
- Est. fire insurance / yr
- $1,241 – $2,305
Heat risk 6/10 · Moderate
- Hot days now (above 107°F)
- 7 days/yr
- Hot days in 30 yrs
- 20 days/yr
Wind risk 5/10 · Moderate
- Chance of severe wind over 30 yrs
- 26.0%
Air-quality risk 1/10 · Minimal
- Unhealthy air days now
- 0 days/yr
- Unhealthy air days in 30 yrs
- 0 days/yr
Risk factors via First Street. Map © Google.
Why this score? — see what drove the D grade
The composite is a weighted blend of 9 inputs, each scored 0–100. Each bar is that input's sub-score; the figure is the points it added to the 100-point composite (weight × sub-score).
- Cash flow +13.9/30.0
- ARV discount +7.5/15.0
- DSCR +4.2/10.0
- Schools +3.2/10.0
- Livability +3.2/5.0
- 1% rule +3.0/10.0
- Rent growth +2.5/5.0
- Condition / age +2.5/5.0
- Appreciation +0.0/10.0
$159,500
🖨 Deal sheet 📄 Offer letter ✓ Due diligence
Listing remarks MLS
4 bedroom, 2 bath home on one acre with an additional acre available. This property has a fenced in back yard with an above ground pool, two storage buildings and a two car garage. All appliances included.
Key facts
- Outdoor pool
- Large outside deck
- 12 x 30 storage shed
Tags
Property features AI
Finance
- Financial info: Annual property tax reported
Exterior
- Home design: Single-family residence
- Exterior features: Workshop on the property; Shed(s) on the property; Approximately 1 acre lot
Interior
- Bathrooms: 2 full bathrooms
- Interior features: 6 total rooms
Neighborhood map
What this means for you Summary
Snapshot
- This is a 4-bed/1.0-bath single-family listed at $160k.
Deal economics
- At list price, monthly cash flow is $18 ($213/yr) — positive.
- The deal already cash-flows at list — no discount required.
- To meet the 1% rule (rent ≥ 1% of price), the offer needs to be $128k (19.9% below list).
- Recommended offer: $128k (19.9% below list) — sets the bar for 1% rule.
Location & tenants
- Location reads 65/100 on livability (#117 in MS) — a middle-class / working-renter tenant base. Strengths: cost of living A+, housing A+; Watch: employment D+, crime D, amenities F.
- Prentiss County School District (rural): math 38% / reading 39% proficiency, ranked #44 of 130 in MS (top 34%) — families likely to look elsewhere, expect single-tenant / working-renter base with shorter leases.
- Market conditions: 18 active listings in the ZIP; 11 units permitted in Prentiss County in 2024 (0 in 5+ unit buildings).
Forward outlook
- Local home prices are declining (-3.0%/yr); year-one equity from $1k of loan paydown is wiped out by about $5k of value loss. Plan a longer hold.
- Prentiss County population projected to shrink 6% by 2050 — rents likely to lag national; underwrite the cash flow, not the appreciation.
Negotiation context
- Only 14 days on market — expect competitive offers; lowballing is unlikely to land.
- 2 sale attempts since 11y ago with the ask held roughly flat each time — persistent listings suggest the price (not the market) is what's stuck; bring a comps-based counter.
Risks & watch-outs
- Climate carrying-cost: moderate wind risk, 26% chance of damaging wind over 30y; major wildfire risk; extreme-heat days projected 7→20/yr by 2055 (HVAC capex compounding) — expect insurance premiums to compound above CPI over the hold.
Questions for the listing agent
- Is there a deadline driving the sale (1031 exchange, divorce, estate, relocation)? That informs how much negotiation room exists.
- Crime grade is D in this area — have there been break-ins, vandalism, or insurance claims at this property in the last 3 years? What carrier currently insures it and at what premium?
- The area grade is low — what's the realistic commute time and amenity access for the typical tenant pool here? Any planned neighborhood developments (good or bad) we should know about?
- What's the average days-on-market for RENTAL listings here right now (not sales)? A rising rental-DOM trend means longer vacancies and softer asking-rent achievability than the comps imply.
- What's the recent tenant-quality profile in this submarket — average credit score on applications, eviction rate, late-payment / NSF rate, and stable-employment percentage? A property-management company in the area should have these aggregated.
- How much new for-sale + rental construction is in the pipeline within 1–3 miles? Heavy new supply typically softens prices + rents 12–24 months out; constrained supply supports both.
Investment metrics
- 1% rule
- 0.80% ✗
- Cap rate
- 6.43%
- Cash-on-cash
- 0.48%
- DSCR
- 1.02
- GRM
- 10.4
CMA / ARV
No comps found within radius.
Projected returns pro-forma
-3.0% appreciation · 3.0% rent growth · sell at horizon
- IRR
- -15.6%
- Equity multiple
- 0.45×
- Total profit
- $-24,761
- Equity at exit
- $23,782
- IRR
- -7.2%
- Equity multiple
- 0.55×
- Total profit
- $-20,300
- Equity at exit
- $13,791
Cash invested: $44,660 (down + closing). Projections, not guarantees.
Landlord ↔ Tenant lean methodology
- Overall (STATE)
- 90 Strongly Landlord-Friendly
- State Mississippi
- 90 Strongly Landlord-Friendly · R+11
- County
- — inherits STATE
- City
- — inherits STATE
ZIP-level market 38865
- Home prices YoY
- -11.8%
- Active inventory
- 18
- Price-to-rent
- 10.4×
Monthly cashflow live
- Estimated rent
- $1,278 medium interval (Pro) →
- Mortgage (P&I)
- −$836
- Tax from tax record
- −$89 /mo · $1,069/yr
- Insurance
- −$66
- HOA
- −$0
- Vacancy / Maint / Mgmt
- −$268
- Net cashflow
- $18
Break-even live
UW: 25.0% down · 7.5% · 30yr · 1.5% tax · 5.0% vac · 8.0% maint · 8.0% mgmt
Financing live
Cash to close
- Down payment
- $39,875
- Closing costs
- $4,785
- Reserves months
- —
- Total cash needed
- —
Loan-product check · same deal, 3 products live
Conventional
25% down · 7.5% · 30yr
- Down + closing
- —
- Monthly P&I
- —
- Monthly cashflow
- —
- DSCR
- —
- Eligible?
- —
Personal DTI + credit; lowest rate.
DSCR
20% down · 8.5% · 30yr
- Down + closing
- —
- Monthly P&I
- —
- Monthly cashflow
- —
- DSCR
- —
- Eligible?
- —
No personal income docs; deal must DSCR.
Hard money
10% down · 12.0% · 12mo
- Down + closing
- —
- Monthly P&I
- —
- Monthly cashflow
- —
- DSCR
- —
- Eligible?
- —
Short-term bridge; refi at stabilization.
Listing history 11 events
-
2026-06-16status $159,500 Pending 14 DOM
-
2026-06-15days on market $159,500 Active 14 DOM
-
2026-06-13days on market $159,500 Active 12 DOM
-
2026-06-12days on market $159,500 Active 11 DOM
-
2026-06-09days on market $159,500 Active 8 DOM
-
2026-06-08days on market $159,500 Active 7 DOM
-
2026-06-07days on market $159,500 Active 6 DOM
-
2026-06-07days on market $159,500 Active 5 DOM
-
2026-06-04days on market $159,500 Active 2 DOM
-
2026-06-03remarks 284-char remark
-
2026-06-03$159,500 Active 1 DOM
ⓘ Source: listings_history table (triggers on properties + properties_extension) + one-shot
backfill from property_details.listing_events for pre-trigger history.
Tax reassessment forecast MS · Resets to sale price
- Current annual tax
- $1,069 · $89/mo
- Projected year-2 tax
- $1,260 · $105/mo
- Expected delta
- +$191/yr (+$16/mo · 17.9%)
ⓘ Screening estimate from a state-policy table — verify with the county assessor before closing.
Climate risk First Street
- Flood 1/10 Low FEMA zone X (unshaded) · 0% chance over 30 yrs
- Wildfire 7/10 Severe
- Heat 6/10 Major 7 d/yr ≥107°F today · 20 d/yr by 30 yrs out
- Wind 5/10 Major 26% chance of damaging wind over 30 yrs
- Air quality 1/10 Low 0 unhealthy d/yr today · 0 by 30 yrs out
Nearby sold comps map
Loading sold comps map…
Walkable amenities ~0.75 mi
Loading nearby amenities…
Taxation est. · year 1
- Rental income
- $15,338
- − Mortgage interest
- −$8,934
- − Property taxes
- −$1,069
- − Insurance
- −$798
- − Repairs & maintenance
- −$1,227
- − Management
- −$1,227
- − Depreciation
- −$4,640
- Taxable loss
- −$2,557
- Est. tax savings @ 24.0%
- +$614
- After-tax cash flow
- $827/yr
For passive investors: Depreciation is non-cash, so a rental often shows a tax loss while cash-flowing — sheltering income. Rental losses are passive: they offset passive income freely, and up to $25,000/yr can offset ordinary (W-2) income if you actively participate and your MAGI is under $100k (phasing out to $0 by $150k); unused losses carry forward. On sale, claimed depreciation is recaptured at up to 25%, and gains may owe capital-gains tax (a 1031 exchange can defer both). Figures are a year-1 estimate at your 24.0% rate — not tax advice; consult a CPA.
Schools (NCES district)
- District
- Prentiss County School District
- NCES district ID
- 2803750
- Math proficiency
- 38% ▼ -19.00%
- Reading proficiency
- 39% ▼ -14.00%
- Median HH income
- $36,980
- Composite
- 32.01/100
- National rank
- #5829
- State rank
- #44 of 130 in MS
Livability — Booneville
- Score
- 65/100
- State rank
- #117
- US rank
- #13203
Category grades
Schools grade is shown separately in the Schools card above.
Census & demographics
- City population
- 18,036
- Population (ZIP)
- 5,367
Population outlook (Prentiss County) Hauer SSP2
- Today (2025)
- 25,348 people
- By 2030
- 25,247 · -0.4%
- By 2040
- 24,786 · -2.2%
- By 2050
- 23,851 · -5.9%
- By 2075
- 20,434 · -19.4%
- By 2100
- 15,359 · -39.4%
Race, ethnicity, and origin ACS 2023
- Neighborhood character
- Predominantly White (68%)
- Race & ethnicity
- White 68% Two or more races 16% Black 14% Hispanic / Latino 3%
- Common ancestry
- Scotch-Irish 1% Romanian 1% Russian 1%
- Foreign-born
- 0%
- Languages at home
- 99% English-only · Spanish 1%
Political lean MEDSL · Prentiss
- 2024 margin
- Solid R (+66.0) · D 16.6% · R 82.7%
- 2008→2024 swing
- -23.2pp toward R · 2008: -42.8pp · 2024: -66.0pp
- All cycles
- 2024: R+66.0 2020: R+58.3 2016: R+56.5 2012: R+42.4 2008: R+42.8
Not yet ingested
- Civics
- —
Market trends
- HPI YoY
- ▼ -22.90%
- Current HPI
- 170.9891
- Rent YoY
- —
- Metro
- —
- State GDP YoY
- —
- F500 in state
- 0
Price history
+73.4% since first listed3 events — show timeline
- 2026-06-01 Listed $159,500 NEMSBD
- 2015-08-21 Sold (MLS) — NEMSBD
- 2015-05-19 Listed $92,000 NEMSBD
Property tax history
+25.6%/yrLatest (2025): $1,069 · +0.0% YoY. Source: county tax records.
Cash-flow waterfall
monthlySold comps — $/sqft
last 12 mo · ≤1 miLoading sold comps…