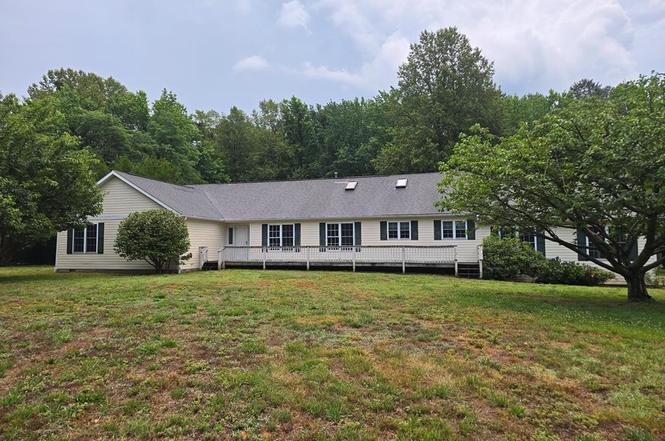
21 Travellers Cir · Montross, VA
Flood risk 1/10 · Minimal
- FEMA flood zone
- X (unshaded)
- Chance of flooding over 30 yrs
- 0.0%
- Est. flood insurance / yr
- $507 – $1,088
Fire risk 5/10 · Moderate
- Est. fire insurance / yr
- $666 – $1,236
Heat risk 8/10 · Major
- Hot days now (above 105°F)
- 7 days/yr
- Hot days in 30 yrs
- 16 days/yr
Wind risk 6/10 · Moderate
- Chance of severe wind over 30 yrs
- 27.0%
Air-quality risk 2/10 · Minimal
- Unhealthy air days now
- 0 days/yr
- Unhealthy air days in 30 yrs
- 1 days/yr
Risk factors via First Street. Map © Google.
Why this score? — see what drove the C+ grade
The composite is a weighted blend of 9 inputs, each scored 0–100. Each bar is that input's sub-score; the figure is the points it added to the 100-point composite (weight × sub-score).
- Cash flow +21.7/30.0
- ARV discount +15.0/15.0
- DSCR +6.9/10.0
- 1% rule +5.0/10.0
- Schools +4.0/10.0
- Livability +3.2/5.0
- Rent growth +2.5/5.0
- Condition / age +2.5/5.0
- Appreciation +0.0/10.0
$359,900
🖨 Deal sheet 📄 Offer letter ✓ Due diligence
Listing remarks MLS
Spacious corner lot home on almost 1acre in great waterfront community with many amenities. Potomac Pier/Boat Ramp, Independence Lake Pier/Boat Ramp, Tennis, Sand Beaches, Club House and Pool. The home has 3 Bedrooms, 2,5 Bathrooms, LV, Family room and Den, Sep. Laundry room and Huge Garage. 2 Sheds (shed on the right conveys as is).
Key facts
- Two combined lots
- Clubhouse
- Pickleball courts
Tags
Property features AI
Finance
- Other: Subdivision: Stratford Harbour; Zoning: R2; Lot size approximately 1.06 acres
- HOA & community: Homeowners association with an annual fee of $550 (about $45.83/month)
Exterior
- Parking: Attached 2-car garage
- Utilities: Septic tank
- Home design: Residential property; Non-waterfront residential; Single-story
- Construction: Vinyl siding
- Exterior features: Deck
Interior
- Bedrooms: Total of 8 rooms (includes bedrooms and living spaces)
- Flooring: Vinyl; Carpet
- Bathrooms: 3 full bathrooms
- Heating & cooling: Electric heating; Heat pump; Cooling with ceiling fans
- Interior features: Vinyl and carpet flooring; Ceiling fans
Neighborhood map
What this means for you Summary
Snapshot
- This is a 4-bed/2.5-bath single-family listed at $360k.
Deal economics
- At list price, monthly cash flow is $552 ($7k/yr) — positive.
- The deal already cash-flows at list — no discount required.
- Meets the 1% rule at list price ($4k rent vs $360k).
- Cap rate 8.1% vs local median 3.2% in Montross — top-decile yield for the area; either an underpriced asset or a hidden risk that comps aren't pricing in. Stress-test before assuming the spread holds.
Location & tenants
- Location reads 64/100 on livability (#353 in VA) — a middle-class / working-renter tenant base. Strengths: schools A-, housing A-, cost of living B+; Watch: employment D+, amenities F, commute F.
- Westmoreland County Public School District (rural): math 34% / reading 59% proficiency, ranked #105 of 131 in VA (top 80%) — families likely to look elsewhere, expect single-tenant / working-renter base with shorter leases; 64% free/reduced lunch — lower-income household profile, screen leases tightly.
- Market conditions: 186 active listings in the ZIP; 1 comparable units currently listed for rent nearby; 220 units permitted in Westmoreland County in 2024 (0 in 5+ unit buildings).
Forward outlook
- Local home prices are declining (-3.0%/yr); year-one equity from $2k of loan paydown is wiped out by about $11k of value loss. Plan a longer hold.
- Westmoreland County population projected to shrink 7% by 2050 — rents likely to lag national; underwrite the cash flow, not the appreciation.
Negotiation context
- Only 3 days on market — expect competitive offers; lowballing is unlikely to land.
- 6 sale attempts since 21y ago with the ask held roughly flat each time — persistent listings suggest the price (not the market) is what's stuck; bring a comps-based counter.
- Current owner paid $210k; list at $360k implies a 71% gain — meaningful room to come down on a strong offer.
Risks & watch-outs
- Climate carrying-cost: major wind risk, 27% chance of damaging wind over 30y; moderate wildfire risk; extreme-heat days projected 7→16/yr by 2055 (HVAC capex compounding) — expect insurance premiums to compound above CPI over the hold.
Questions for the listing agent
- What does the HOA fee cover, when was the last increase, and are there any pending special assessments or reserve-fund shortfalls?
- Is there a deadline driving the sale (1031 exchange, divorce, estate, relocation)? That informs how much negotiation room exists.
- Schools are A-rated — typically a magnet for longer-tenancy family renters. What's the average tenant stay here, and is there a school-zone premium baked into asking?
- What's the average days-on-market for RENTAL listings here right now (not sales)? A rising rental-DOM trend means longer vacancies and softer asking-rent achievability than the comps imply.
- What's the recent tenant-quality profile in this submarket — average credit score on applications, eviction rate, late-payment / NSF rate, and stable-employment percentage? A property-management company in the area should have these aggregated.
- How much new for-sale + rental construction is in the pipeline within 1–3 miles? Heavy new supply typically softens prices + rents 12–24 months out; constrained supply supports both.
Investment metrics
- 1% rule
- 1.00% ✓
- Cap rate
- 8.13%
- Cash-on-cash
- 6.57%
- DSCR
- 1.29
- GRM
- 8.3
CMA / ARV
- ARV (on-the-fly)
- $691,392
- Comps found
- 4
Show comp detail 4 sales within ~0.75 mi
| Address | Dist | Beds/Ba | Sqft | Sold | Price | $/sf | Match |
|---|---|---|---|---|---|---|---|
| 114 Dragoon Dr | 0.13mi | 4/3.0 | 2,840 (+14%) | 5mo | $299,900 | $106 | 64 |
| 1092 S Independence Dr | 0.25mi | 3/3.0 (-1) | 2,280 (-9%) | 4mo | $329,999 | $145 | 64 |
| 88 Colonial Dr | 0.48mi | 3/2.0 (-1) | 2,496 (0%) | 15mo | $735,000 | $294 | 58 |
| 1329 N Independence Dr | 0.69mi | 3/3.5 (-1) | 2,636 (+6%) | 13mo | $729,900 | $277 | 38 |
Match score weights: distance 35% · size 25% · config 20% · recency 20%. Top-matched comps best support the ARV.
Projected returns pro-forma
-3.0% appreciation · 3.0% rent growth · sell at horizon
- IRR
- -6.2%
- Equity multiple
- 0.77×
- Total profit
- $-23,229
- Equity at exit
- $53,662
- IRR
- 3.4%
- Equity multiple
- 1.25×
- Total profit
- $24,775
- Equity at exit
- $31,118
Cash invested: $100,772 (down + closing). Projections, not guarantees.
Landlord ↔ Tenant lean methodology
- Overall (STATE)
- 55 Moderately Landlord-Leaning
- State Virginia
- 55 Moderately Landlord-Leaning · D+2
- County
- — inherits STATE
- City
- — inherits STATE
ZIP-level market 22520
- Home prices YoY
- -27.5%
- Active inventory
- 186
- Price-to-rent
- 8.3×
Monthly cashflow live
- Estimated rent
- $3,600 medium interval (Pro) →
- Mortgage (P&I)
- −$1,887
- Tax from tax record
- −$209 /mo · $2,504/yr
- Insurance
- −$150
- HOA
- −$46
- Vacancy / Maint / Mgmt
- −$756
- Net cashflow
- $552
Break-even live
UW: 25.0% down · 7.5% · 30yr · 1.5% tax · 5.0% vac · 8.0% maint · 8.0% mgmt
Financing live
Cash to close
- Down payment
- $89,975
- Closing costs
- $10,797
- Reserves months
- —
- Total cash needed
- —
Loan-product check · same deal, 3 products live
Conventional
25% down · 7.5% · 30yr
- Down + closing
- —
- Monthly P&I
- —
- Monthly cashflow
- —
- DSCR
- —
- Eligible?
- —
Personal DTI + credit; lowest rate.
DSCR
20% down · 8.5% · 30yr
- Down + closing
- —
- Monthly P&I
- —
- Monthly cashflow
- —
- DSCR
- —
- Eligible?
- —
No personal income docs; deal must DSCR.
Hard money
10% down · 12.0% · 12mo
- Down + closing
- —
- Monthly P&I
- —
- Monthly cashflow
- —
- DSCR
- —
- Eligible?
- —
Short-term bridge; refi at stabilization.
Rent comps 1 comps
| Address | Beds | Baths | Sqft | Rent | $/sqft | DOM | Units | Dist |
|---|---|---|---|---|---|---|---|---|
| 1355 N Independence Dr Montross, VA | 4.0 | 3.5 | 2225 | $3,600 | $1.62 | 43d | 1 | 0.73mi |
HOA detail
- Monthly dues
- $46 · $552/yr
- Likely covers
- waterpool
Listing history 4 events
-
2026-06-18days on market $359,900 Active 3 DOM
-
2026-06-17days on market $359,900 Active 2 DOM
-
2026-06-15remarks 699-char remark
-
2026-06-15$359,900 Active 1 DOM
ⓘ Source: listings_history table (triggers on properties + properties_extension) + one-shot
backfill from property_details.listing_events for pre-trigger history.
Tax reassessment forecast VA · Resets to sale price
- Current annual tax
- $2,504 · $209/mo
- Projected year-2 tax
- $2,951 · $246/mo
- Expected delta
- +$447/yr (+$37/mo · 17.8%)
ⓘ Screening estimate from a state-policy table — verify with the county assessor before closing.
Climate risk First Street
- Flood 1/10 Low FEMA zone X (unshaded) · 0% chance over 30 yrs
- Wildfire 5/10 Major
- Heat 8/10 Severe 7 d/yr ≥105°F today · 16 d/yr by 30 yrs out
- Wind 6/10 Major 27% chance of damaging wind over 30 yrs
- Air quality 2/10 Low 0 unhealthy d/yr today · 1 by 30 yrs out
Nearby sold comps map
Loading sold comps map…
Walkable amenities ~0.75 mi
Loading nearby amenities…
Taxation est. · year 1
- Rental income
- $43,200
- − Mortgage interest
- −$20,160
- − Property taxes
- −$2,504
- − Insurance
- −$1,800
- − Repairs & maintenance
- −$3,456
- − Management
- −$3,456
- − HOA
- −$552
- − Depreciation
- −$10,470
- Taxable income
- $802
- Est. tax owed @ 24.0%
- −$193
- After-tax cash flow
- $6,431/yr
For passive investors: Depreciation is non-cash, so a rental often shows a tax loss while cash-flowing — sheltering income. Rental losses are passive: they offset passive income freely, and up to $25,000/yr can offset ordinary (W-2) income if you actively participate and your MAGI is under $100k (phasing out to $0 by $150k); unused losses carry forward. On sale, claimed depreciation is recaptured at up to 25%, and gains may owe capital-gains tax (a 1031 exchange can defer both). Figures are a year-1 estimate at your 24.0% rate — not tax advice; consult a CPA.
Schools (NCES district)
- District
- Westmoreland County Public School District
- NCES district ID
- 5103980
- Math proficiency
- 34% ▼ -47.00%
- Reading proficiency
- 59% ▼ -11.00%
- Median HH income
- $51,665
- Composite
- 39.94/100
- National rank
- #3845
- State rank
- #105 of 131 in VA
Livability — Montross
- Score
- 64/100
- State rank
- #353
- US rank
- #14197
Category grades
Schools grade is shown separately in the Schools card above.
Census & demographics
- Population (ZIP)
- 5,014
Population outlook (Westmoreland County) Hauer SSP2
- Today (2025)
- 17,643 people
- By 2030
- 17,520 · -0.7%
- By 2040
- 17,041 · -3.4%
- By 2050
- 16,397 · -7.1%
- By 2075
- 15,012 · -14.9%
- By 2100
- 12,917 · -26.8%
Race, ethnicity, and origin ACS 2023
- Neighborhood character
- Diverse neighborhood (Simpson 0.60)
- Race & ethnicity
- White 58% Black 23% Two or more races 9% Hispanic / Latino 7%
- Hispanic origin (detail)
- Mexican 3% Puerto Rican 2%
- Common ancestry
- Romanian 4% Italian 3% Serbian 2%
- Foreign-born
- 6% · Canada, Jamaica, South Korea
- Languages at home
- 92% English-only · Spanish 7% Other Indo-European 1%
Political lean MEDSL · Westmoreland
- 2024 margin
- R (+14.3) · D 42.4% · R 56.7%
- 2008→2024 swing
- -24.5pp toward R · 2008: 10.2pp · 2024: -14.3pp
- All cycles
- 2024: R+14.3 2020: R+8.2 2016: R+7.3 2012: D+0.5 2008: D+10.2
Not yet ingested
- Civics
- —
Market trends
- HPI YoY
- ▼ -59.09%
- Current HPI
- 155.4326
- Rent YoY
- —
- Metro
- —
- State GDP YoY
- ▲ 2.40%
- F500 in state
- 50
Industry mix (Fortune 500 HQ in VA)
| Industry | F500 HQs | Revenue |
|---|---|---|
| Aerospace / Defense | 4 | $236B |
|
||
| Technology / Defense | 3 | $32B |
|
||
| Financial Services | 2 | $176B |
|
||
| Utilities | 2 | $27B |
|
||
| Insurance | 2 | $25B |
|
||
| Technology | 2 | $15B |
|
||
Price history
+28.6% since first listed20 events — show timeline
- 2026-06-15 Listed $359,900 NNAR
- 2012-01-05 Delisted — MRIS
- 2011-12-22 Sold (Public Records) $210,000 Public Records
- 2011-12-21 Sold (MLS) $210,000 BRIGHT MLS
- 2011-12-21 Sold (MLS) $210,000 MRIS
- 2011-09-27 Pending — MRIS
- 2011-09-27 Listing Removed — BRIGHT MLS
- 2011-07-21 Price Changed $201,500 MRIS
- 2011-07-07 Relisted — MRIS
- 2011-07-07 Price Changed $179,000 MRIS
- 2011-06-17 Delisted — MRIS
- 2011-06-15 Relisted — MRIS
- 2011-03-16 Pending — MRIS
- 2011-02-24 Price Changed $189,000 MRIS
- 2011-01-02 Listed $249,900 MRIS
- 2011-01-01 Listed $201,500 BRIGHT MLS
- 2006-04-25 Sold (Public Records) $281,000 Public Records
- 2006-04-24 Sold (MLS) $281,000 MRIS
- 2006-04-10 Delisted — MRIS
- 2005-10-28 Listed $279,900 MRIS
Property tax history
+4.3%/yrLatest (2025): $2,504 · +0.0% YoY. Source: county tax records.
Cash-flow waterfall
monthlySold comps — $/sqft
last 12 mo · ≤1 miLoading sold comps…