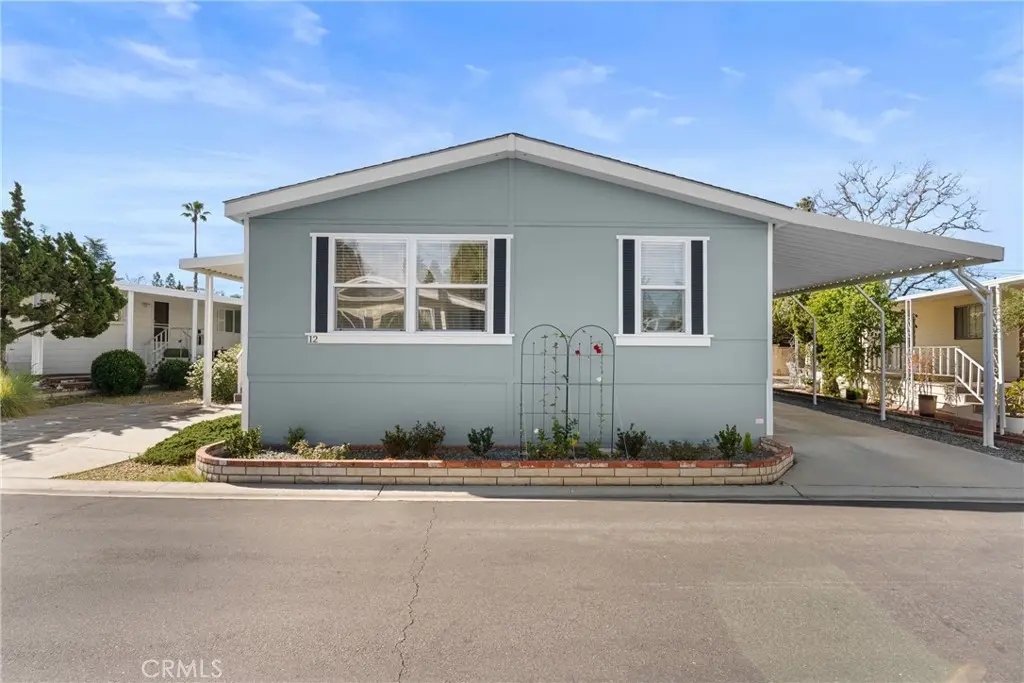
24001 Muirlands #12 · Lake Forest, CA
Flood risk 1/10 · Minimal
- FEMA flood zone
- X (unshaded)
- Chance of flooding over 30 yrs
- 0.0%
- Est. flood insurance / yr
- $507 – $1,088
Fire risk 1/10 · Minimal
- Est. fire insurance / yr
- $659 – $1,223
Heat risk 5/10 · Moderate
- Hot days now (above 91°F)
- 6 days/yr
- Hot days in 30 yrs
- 19 days/yr
Wind risk 1/10 · Minimal
- Chance of severe wind over 30 yrs
- —
Air-quality risk 4/10 · Minor
- Unhealthy air days now
- 4 days/yr
- Unhealthy air days in 30 yrs
- 5 days/yr
Risk factors via First Street. Map © Google.
Why this score? — see what drove the C+ grade
The composite is a weighted blend of 9 inputs, each scored 0–100. Each bar is that input's sub-score; the figure is the points it added to the 100-point composite (weight × sub-score).
- Cash flow +29.2/30.0
- DSCR +10.0/10.0
- 1% rule +8.2/10.0
- Schools +5.6/10.0
- Livability +3.2/5.0
- Rent growth +3.1/5.0
- Condition / age +2.5/5.0
- ARV discount +0.0/15.0
- Appreciation +0.0/10.0
$359,900
🖨 Deal sheet 📄 Offer letter ✓ Due diligence
Listing remarks MLS
Exceptional Forest Gardens Home -a rare find! Discover this remarkable gem nestled on a cul-de-sac in the highly sought-after 55+ Forest Gardens neighborhood. Built in 2006, this cheerful residence offers the perfect blend of modern comfort and timeless appeal. This property features 3 bedrooms, 2 baths, plus versatile bonus space that adapts to your lifestyle. The generous open-concept floorplan creates an inviting atmosphere perfect for both everyday living and entertaining. Gather around the cozy fireplace during cool evenings, creating memories in the warm, welcoming hearth room, suitable for living or dining. A laundry room with sink, single level floorplan and plenty of storage make life simpler. The home was updated this year with luxury vinyl flooring throughout, new lighting fixtures, and other touch ups. Forest Gardens is located approximately 10 minutes from the Irvine Spectrum. The community features a pool, spa, gym, library, billards room and social activities. With easy access to freeways, canyons and the beach, make this home the stage for your next chapter. Credit score of 750+ is required for park approval.
Key facts
- Generous floorplan
- Cul-de-sac
- Fireplace
Tags
Neighborhood map
What this means for you Summary
Snapshot
- This is a 3-bed/2.0-bath manufactured listed at $360k.
Deal economics
- At list price, monthly cash flow is $1k ($15k/yr) — positive.
- The deal already cash-flows at list — no discount required.
- Meets the 1% rule at list price ($5k rent vs $360k).
- Recommended offer: $328k (9.0% below list) — sets the bar for market timing.
- Cap rate 10.5% vs local median 2.1% in Lake Forest — top-decile yield for the area; either an underpriced asset or a hidden risk that comps aren't pricing in. Stress-test before assuming the spread holds.
Location & tenants
- Location reads 65/100 on livability (#387 in CA) — a middle-class / working-renter tenant base. Strengths: crime A+, employment A+, housing B; Watch: commute C-, amenities F, cost of living F.
- Saddleback Valley Unified (suburban): math 51% / reading 73% proficiency, ranked #67 of 517 in CA (top 13%) — acceptable for families but not a draw, mixed tenant base, ~2y average lease.
- Market conditions: Rents rising (+2.5%/yr); 205 active listings in the ZIP; 20 comparable units currently listed for rent nearby; rentals at typical pace (median 19d on market — plan ~3-4 weeks tenant-placement turnaround); high-income renter base; 6,974 units permitted in Orange County in 2024 (3,839 in 5+ unit buildings).
- At $4,733/mo this rent would consume 45% of the median local household income ($126k/yr) (locally 2412% of renters already pay >50% of income on rent) — very limited rent-growth headroom before tenants either downsize or default.
Forward outlook
- Local home prices are declining (-3.0%/yr); year-one equity from $2k of loan paydown is wiped out by about $11k of value loss. Plan a longer hold.
- Orange County population projected at +14% by 2050 — modest demand growth; plan on rents tracking national, not racing it.
- At projected returns (-3.0% appreciation + 2.5% rent growth), your $101k cash investment doubles in ~9 years — after that, you're playing with house money.
Negotiation context
- It's been on market 108 days — a 9% lower offer ($328k) is reasonable based on typical stale-listing flexibility.
- 4 sale attempts since 24y ago with the ask held roughly flat each time — persistent listings suggest the price (not the market) is what's stuck; bring a comps-based counter.
- Current owner paid $76k; list at $360k implies a 374% gain — meaningful room to come down on a strong offer.
Risks & watch-outs
- Climate carrying-cost: extreme-heat days projected 6→19/yr by 2055 (HVAC capex compounding) — expect insurance premiums to compound above CPI over the hold.
Questions for the listing agent
- It's been on market 108 days. Have you received any prior offers? Is the seller open to a 9% concession, seller financing, or rate buy-down credit?
- Why hasn't it sold? Are there any deal-killer items the seller is aware of (foundation, flood, title, zoning, code violations)?
- Is there a deadline driving the sale (1031 exchange, divorce, estate, relocation)? That informs how much negotiation room exists.
- Schools are B-rated — typically a magnet for longer-tenancy family renters. What's the average tenant stay here, and is there a school-zone premium baked into asking?
- What's the average days-on-market for RENTAL listings here right now (not sales)? A rising rental-DOM trend means longer vacancies and softer asking-rent achievability than the comps imply.
- What's the recent tenant-quality profile in this submarket — average credit score on applications, eviction rate, late-payment / NSF rate, and stable-employment percentage? A property-management company in the area should have these aggregated.
- How much new for-sale + rental construction is in the pipeline within 1–3 miles? Heavy new supply typically softens prices + rents 12–24 months out; constrained supply supports both.
Investment metrics
- 1% rule
- 1.32% ✓
- Cap rate
- 10.47%
- Cash-on-cash
- 14.91%
- DSCR
- 1.66
- GRM
- 6.3
CMA / ARV
- ARV (median comp)
- $285,492
- List price
- $359,900
- Delta
- 26.06%
- Verdict
- OVERPRICED
- Comps
- 14 within 1.0 mi
Show comp detail 12 sales within ~0.75 mi
| Address | Dist | Beds/Ba | Sqft | Sold | Price | $/sf | Match |
|---|---|---|---|---|---|---|---|
| 24001 Muirlands #352 | 0.00mi | 3/2.0 | 1,525 (-4%) | 2mo | $352,500 | $231 | 92 |
| 24001 Muirlands Blvd #62 | 0.00mi | 3/2.0 | 1,620 (+2%) | 8mo | $449,000 | $277 | 90 |
| 24001 Muirlands #11 | 0.00mi | 2/2.0 (-1) | 1,440 (-9%) | 2mo | $165,000 | $115 | 78 |
| 24001 Muirlands Blvd #147 | 0.00mi | 2/2.0 (-1) | 1,440 (-9%) | 3mo | $359,000 | $249 | 77 |
| 24001 Muirlands Blvd #268 | 0.00mi | 3/2.0 | 1,420 (-10%) | 8mo | $335,000 | $236 | 76 |
| 24001 Muirlands Blvd #315 | 0.05mi | 2/2.0 (-1) | 1,440 (-9%) | 2mo | $305,000 | $212 | 76 |
| 24001 Muirlands Blvd #221 | 0.00mi | 2/2.0 (-1) | 1,440 (-9%) | 5mo | $280,000 | $194 | 76 |
| 24001 Muirlands Blvd #329 | 0.00mi | 2/2.0 (-1) | 1,440 (-9%) | 5mo | $380,000 | $264 | 76 |
| 24001 Muirlands #47 | 0.00mi | 2/2.0 (-1) | 1,440 (-9%) | 6mo | $195,000 | $135 | 75 |
| 24001 Muirlands Blvd #347 | 0.00mi | 2/2.0 (-1) | 1,440 (-9%) | 6mo | $197,000 | $137 | 75 |
| 24001 Muirlands #185 | 0.00mi | 2/2.0 (-1) | 1,440 (-9%) | 7mo | $295,000 | $205 | 74 |
| 24001 Muirlands Dr #81 | 0.12mi | 2/2.0 (-1) | 1,488 (-6%) | 8mo | $230,000 | $155 | 72 |
Match score weights: distance 35% · size 25% · config 20% · recency 20%. Top-matched comps best support the ARV.
Projected returns pro-forma
-3.0% appreciation · 2.51% rent growth · sell at horizon
- IRR
- 4.9%
- Equity multiple
- 1.19×
- Total profit
- $19,161
- Equity at exit
- $53,662
- IRR
- 13.9%
- Equity multiple
- 2.09×
- Total profit
- $110,207
- Equity at exit
- $31,118
Cash invested: $100,772 (down + closing). Projections, not guarantees.
Landlord ↔ Tenant lean methodology
- Overall (STATE)
- 18 Strongly Tenant-Friendly
- State California
- 18 Strongly Tenant-Friendly · D+13
- County
- — inherits STATE
- City
- — inherits STATE
ZIP-level market 92630
- Rents YoY
- 2.5%
- Active inventory
- 205
- Price-to-rent
- 6.3×
Monthly cashflow live
- Estimated rent
- $4,733 high interval (Pro) →
- Mortgage (P&I)
- −$1,887
- Tax est. 1.5%
- −$450 /mo · $5,398/yr
- Insurance
- −$150
- HOA
- −$0
- Vacancy / Maint / Mgmt
- −$994
- Net cashflow
- $1,252
Break-even live
UW: 25.0% down · 7.5% · 30yr · 1.5% tax · 5.0% vac · 8.0% maint · 8.0% mgmt
Financing live
Cash to close
- Down payment
- $89,975
- Closing costs
- $10,797
- Reserves months
- —
- Total cash needed
- —
Loan-product check · same deal, 3 products live
Conventional
25% down · 7.5% · 30yr
- Down + closing
- —
- Monthly P&I
- —
- Monthly cashflow
- —
- DSCR
- —
- Eligible?
- —
Personal DTI + credit; lowest rate.
DSCR
20% down · 8.5% · 30yr
- Down + closing
- —
- Monthly P&I
- —
- Monthly cashflow
- —
- DSCR
- —
- Eligible?
- —
No personal income docs; deal must DSCR.
Hard money
10% down · 12.0% · 12mo
- Down + closing
- —
- Monthly P&I
- —
- Monthly cashflow
- —
- DSCR
- —
- Eligible?
- —
Short-term bridge; refi at stabilization.
Rent comps 20 comps
| Address | Beds | Baths | Sqft | Rent | $/sqft | DOM | Units | Dist |
|---|---|---|---|---|---|---|---|---|
| 24362 Woodwalk Rd Lake Forest, CA | 3.0 | 2.5 | 2047 | $4,995 | $2.44 | 4d | 1 | 0.33mi |
| 24362 Woodwalk Rd Lake Forest, CA | 3.0 | 2.0 | 2047 | $4,795 | $2.34 | 12d | 1 | 0.33mi |
| 22700 Lake Forest Dr Lake Forest, CA | 1.0–3.0 | 1.0–2.0 | 1008 | $3,970 | $3.94 | 4d | 1 | 0.39mi |
| 22645 Spring Lake Ln Lake Forest, CA | 4.0 | 2.5 | 2213 | $6,995 | $3.16 | 20d | 1 | 0.41mi |
| 22645 Spring Lake Ln Lake Forest, CA | 4.0 | 3.0 | 2213 | $6,995 | $3.16 | 12d | 1 | 0.41mi |
| 22602 Cottonwood Cir Lake Forest, CA | 3.0 | 2.0 | 1301 | $4,250 | $3.27 | 43d | 1 | 0.47mi |
| 22835 Islamare Ln Lake Forest, CA | 3.0 | 2.5 | 1860 | $6,600 | $3.55 | 12d | 1 | 0.56mi |
| 22892 Plainview Cir Lake Forest, CA | 3.0 | 2.0 | 1836 | $5,400 | $2.94 | 43d | 1 | 0.60mi |
| 24621 Overlake Dr Lake Forest, CA | 3.0 | 2.0 | 1677 | $4,350 | $2.59 | 24d | 1 | 0.75mi |
| 21708 Lake Vista Dr Lake Forest, CA | 4.0 | 2.5 | 1622 | $4,700 | $2.90 | 24d | 1 | 0.81mi |
| 21708 Lake Vista Dr Lake Forest, CA | 4.0 | 2.5 | 1622 | $4,700 | $2.90 | 17d | 1 | 0.81mi |
| 23981 Crescent Rd Lake Forest, CA | 4.0 | 2.0 | 1540 | $4,700 | $3.05 | 3d | 1 | 0.84mi |
| 21492 Camino Trebol Lake Forest, CA | 4.0 | 2.0 | 1828 | $1,500 | $0.82 | 43d | 1 | 0.94mi |
| 24961 El Caballo St Lake Forest, CA | 4.0 | 2.0 | 1909 | $5,400 | $2.83 | 7d | 1 | 1.11mi |
| 25092 Farthing St Lake Forest, CA | 1.0–2.0 | 1.0–2.0 | 881 | $3,303 | $3.75 | 3d | 5 | 1.27mi |
| 2369 Via Mariposa E Unit 1B Laguna Woods, CA | 2.0 | 2.0 | 1340 | $2,950 | $2.20 | 43d | 1 | 1.38mi |
| 2369 Via Mariposa E Unit 3H Laguna Woods, CA | 3.0 | 3.0 | 1663 | $3,750 | $2.25 | 43d | 1 | 1.38mi |
| 2370 Via Mariposa W Unit 3D Laguna Woods, CA | 3.0 | 3.0 | 1663 | $3,300 | $1.98 | 18d | 1 | 1.43mi |
| 2293 Via Puerta Unit O Laguna Woods, CA | 2.0 | 2.0 | 1057 | $3,100 | $2.93 | 18d | 1 | 1.48mi |
| 2269 Via Puerta Unit N Laguna Woods, CA | 2.0 | 2.0 | 1057 | $2,700 | $2.55 | 18d | 1 | 1.48mi |
Listing history 23 events
-
2026-06-18days on market $359,900 Active 108 DOM
-
2026-06-18price $359,900 Active 107 DOM
-
2026-06-17days on market $365,000 Active 107 DOM
-
2026-06-16days on market $365,000 Active 106 DOM
-
2026-06-15days on market $365,000 Active 105 DOM
-
2026-06-13days on market $365,000 Active 103 DOM
-
2026-06-13days on market $365,000 Active 102 DOM
-
2026-06-09days on market $365,000 Active 99 DOM
-
2026-06-08days on market $365,000 Active 98 DOM
-
2026-06-07days on market $365,000 Active 97 DOM
-
2026-06-04days on market $365,000 Active 94 DOM
-
2026-06-03days on market $365,000 Active 93 DOM
-
2026-06-02days on market $365,000 Active 92 DOM
-
2026-06-01days on market $365,000 Active 91 DOM
-
2026-05-31days on market $365,000 Active 90 DOM
-
2026-05-05price $365,000 1142-char remark
Show marketing remark (1142 chars)
Exceptional Forest Gardens Home -a rare find! Discover this remarkable gem nestled on a cul-de-sac in the highly sought-after 55+ Forest Gardens neighborhood. Built in 2006, this cheerful residence offers the perfect blend of modern comfort and timeless appeal. This property features 3 bedrooms, 2 baths, plus versatile bonus space that adapts to your lifestyle. The generous open-concept floorplan creates an inviting atmosphere perfect for both everyday living and entertaining. Gather around the cozy fireplace during cool evenings, creating memories in the warm, welcoming hearth room, suitable for living or dining. A laundry room with sink, single level floorplan and plenty of storage make life simpler. The home was updated this year with luxury vinyl flooring throughout, new lighting fixtures, and other touch ups. Forest Gardens is located approximately 10 minutes from the Irvine Spectrum. The community features a pool, spa, gym, library, billards room and social activities. With easy access to freeways, canyons and the beach, make this home the stage for your next chapter. Credit score of 750+ is required for park approval.
-
2026-03-02$370,000 Active 1142-char remark
Show marketing remark (1142 chars)
Exceptional Forest Gardens Home -a rare find! Discover this remarkable gem nestled on a cul-de-sac in the highly sought-after 55+ Forest Gardens neighborhood. Built in 2006, this cheerful residence offers the perfect blend of modern comfort and timeless appeal. This property features 3 bedrooms, 2 baths, plus versatile bonus space that adapts to your lifestyle. The generous open-concept floorplan creates an inviting atmosphere perfect for both everyday living and entertaining. Gather around the cozy fireplace during cool evenings, creating memories in the warm, welcoming hearth room, suitable for living or dining. A laundry room with sink, single level floorplan and plenty of storage make life simpler. The home was updated this year with luxury vinyl flooring throughout, new lighting fixtures, and other touch ups. Forest Gardens is located approximately 10 minutes from the Irvine Spectrum. The community features a pool, spa, gym, library, billards room and social activities. With easy access to freeways, canyons and the beach, make this home the stage for your next chapter. Credit score of 750+ is required for park approval.
-
2006-08-01soldstatus $76,000 545-char remark
Show marketing remark (545 chars)
NEWLY REMODELED & BEAUTIFULLY MODERNIZED WITH NEW FIXTURES, TOILETS & FLOOR, COUNTERS, APPLIANCES, CROWN MOLDING, DECK CARPETING, FRESH PAINT, CEILING FANS, ETC. LARGE MASTER SUITE. SPACIOUS KITCHEN & DINING ROOM. LOTS OF LG. WINDOWS, LOWEST SPACE RENT IN THE PARK! EXTRA LG. LOT, LARGE COVERED DECKS, SECURITY GATED AGE 55+ QUIET COMMUNITY, 5 LAKES, ON-GOING FUN ACTIVITIES & FRIENDLY NEIGHBORS, WALK TO TENNIS, POOL, SPA, LOVELY LODGE AND CENTER. CLOSE TO SHOPPING, FWYS, ETC. -Disability Access:Partial Handicap Access
-
2006-03-04$79,999 545-char remark
Show marketing remark (545 chars)
NEWLY REMODELED & BEAUTIFULLY MODERNIZED WITH NEW FIXTURES, TOILETS & FLOOR, COUNTERS, APPLIANCES, CROWN MOLDING, DECK CARPETING, FRESH PAINT, CEILING FANS, ETC. LARGE MASTER SUITE. SPACIOUS KITCHEN & DINING ROOM. LOTS OF LG. WINDOWS, LOWEST SPACE RENT IN THE PARK! EXTRA LG. LOT, LARGE COVERED DECKS, SECURITY GATED AGE 55+ QUIET COMMUNITY, 5 LAKES, ON-GOING FUN ACTIVITIES & FRIENDLY NEIGHBORS, WALK TO TENNIS, POOL, SPA, LOVELY LODGE AND CENTER. CLOSE TO SHOPPING, FWYS, ETC. -Disability Access:Partial Handicap Access
-
2005-11-09soldstatus $52,000
-
2005-05-10$52,000
-
2002-10-01soldstatus $47,500
-
2002-07-23$47,500
ⓘ Source: listings_history table (triggers on properties + properties_extension) + one-shot
backfill from property_details.listing_events for pre-trigger history.
Climate risk First Street
- Flood 1/10 Low FEMA zone X (unshaded) · 0% chance over 30 yrs
- Wildfire 1/10 Low
- Heat 5/10 Major 6 d/yr ≥91°F today · 19 d/yr by 30 yrs out
- Wind 1/10 Low
- Air quality 4/10 Moderate 4 unhealthy d/yr today · 5 by 30 yrs out
Nearby sold comps map
Loading sold comps map…
Walkable amenities ~0.75 mi
Loading nearby amenities…
Taxation est. · year 1
- Rental income
- $56,796
- − Mortgage interest
- −$20,160
- − Property taxes
- −$5,398
- − Insurance
- −$1,800
- − Repairs & maintenance
- −$4,544
- − Management
- −$4,544
- − Depreciation
- −$10,470
- Taxable income
- $9,881
- Est. tax owed @ 24.0%
- −$2,371
- After-tax cash flow
- $12,651/yr
For passive investors: Depreciation is non-cash, so a rental often shows a tax loss while cash-flowing — sheltering income. Rental losses are passive: they offset passive income freely, and up to $25,000/yr can offset ordinary (W-2) income if you actively participate and your MAGI is under $100k (phasing out to $0 by $150k); unused losses carry forward. On sale, claimed depreciation is recaptured at up to 25%, and gains may owe capital-gains tax (a 1031 exchange can defer both). Figures are a year-1 estimate at your 24.0% rate — not tax advice; consult a CPA.
Schools (NCES district)
- District
- Saddleback Valley Unified
- NCES district ID
- 0633860
- Math proficiency
- 51% ▼ -2.00%
- Reading proficiency
- 73% ▲ 9.00%
- Median HH income
- $85,577
- Composite
- 56.05/100
- National rank
- #1185
- State rank
- #67 of 517 in CA
Livability — Lake Forest
- Score
- 65/100
- State rank
- #387
- US rank
- #13130
Category grades
Schools grade is shown separately in the Schools card above.
Census & demographics
- Census place
- Lake Forest, CA
- County
- Orange County · 3,096,323 people
- City population
- 80,019
- Metro
- Los Angeles-Long Beach-Anaheim, CA
- Population (ZIP)
- 67,152
- Household income
- $125,853
- Rent vs Own
- Severe rent burden
- 2412.0
Population outlook (Orange County) Hauer SSP2
- Today (2025)
- 3,477,456 people
- By 2030
- 3,613,117 · +3.9%
- By 2040
- 3,835,945 · +10.3%
- By 2050
- 3,968,736 · +14.1%
- By 2075
- 4,097,053 · +17.8%
- By 2100
- 3,903,633 · +12.3%
Race, ethnicity, and origin ACS 2023
- Neighborhood character
- Diverse neighborhood (Simpson 0.67)
- Race & ethnicity
- White 47% Hispanic / Latino 27% Asian 19% Two or more races 16% Black 2% Native American 1%
- Hispanic origin (detail)
- Mexican 21%
- Common ancestry
- Slovak 2% Lithuanian 2% Romanian 2%
- Foreign-born
- 28% · Canada, China, Vietnam
- Languages at home
- 62% English-only · Spanish 18% Chinese 4% Other Indo-European 4%
Political lean MEDSL · Orange
- 2024 margin
- Toss-up / Even · D 49.7% · R 47.1% · Other 3.2%
- 2008→2024 swing
- +5.2pp toward D · 2008: -2.6pp · 2024: 2.6pp
- All cycles
- 2024: D+2.6 2020: D+9.0 2016: D+7.7 2012: R+8.3 2008: R+2.6
Not yet ingested
- Civics
- —
Market trends
- HPI YoY
- ▼ -866.99%
- Current HPI
- 436.6189
- Rent YoY
- ▲ 2.51%
- Metro
- Los Angeles-Long Beach-Anaheim, CA
- State GDP YoY
- ▲ 3.21%
- F500 in state
- 116
Industry mix (Fortune 500 HQ in CA)
| Industry | F500 HQs | Revenue |
|---|---|---|
| Technology | 27 | $1,492B |
|
||
| Financial Services | 3 | $174B |
|
||
| Retail | 3 | $44B |
|
||
| Insurance | 3 | $26B |
|
||
| Media / Entertainment | 2 | $115B |
|
||
| Pharmaceuticals / Biotech | 2 | $62B |
|
||
Price history
+668.4% since first listed8 events — show timeline
- 2026-05-05 Price Changed $365,000 CRMLS
- 2026-03-02 Listed $370,000 CRMLS
- 2006-08-01 Sold (MLS) $76,000 CRMLS
- 2006-03-04 Listed $79,999 CRMLS
- 2005-11-09 Sold (MLS) $52,000 CRMLS
- 2005-05-10 Listed $52,000 CRMLS
- 2002-10-01 Sold (MLS) $47,500 CRMLS
- 2002-07-23 Listed $47,500 CRMLS
Property tax history
-4.1%/yrLatest (2025): $562 · -0.2% YoY. Source: county tax records.
Cash-flow waterfall
monthlySold comps — $/sqft
last 12 mo · ≤1 miLoading sold comps…