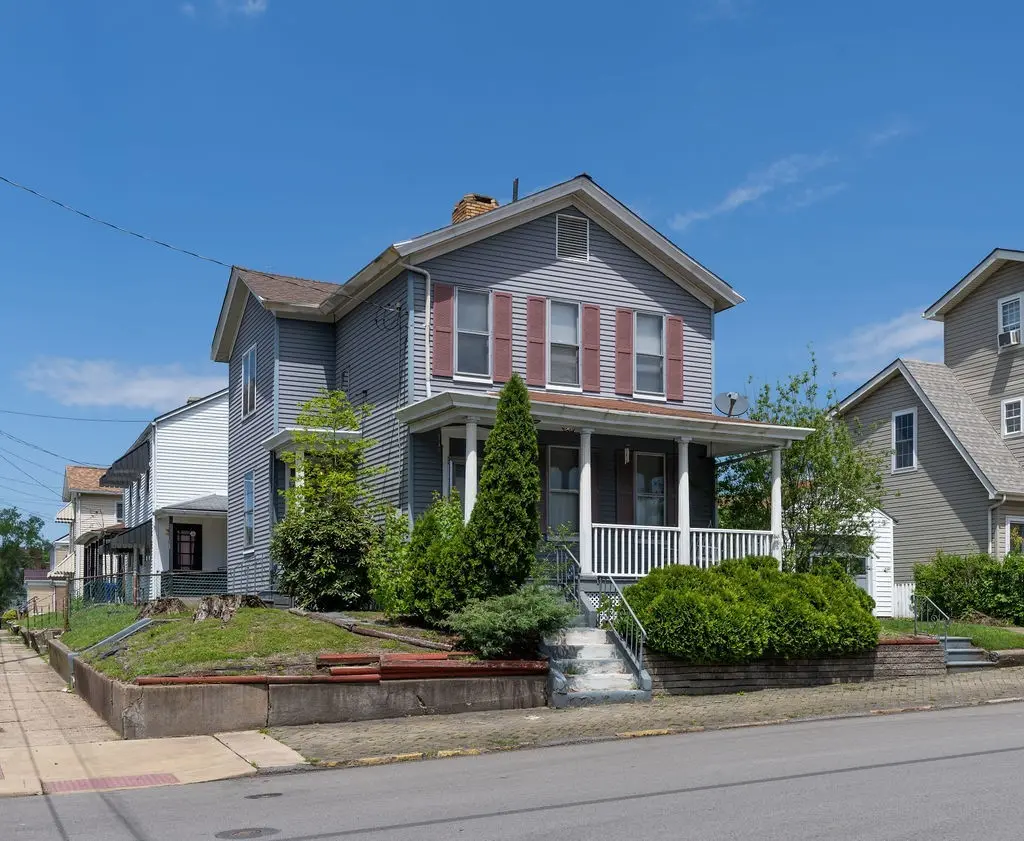
801 10th St · New Brighton, PA
Flood risk 1/10 · Minimal
- FEMA flood zone
- X (unshaded)
- Chance of flooding over 30 yrs
- 0.0%
- Est. flood insurance / yr
- $473 – $860
Fire risk 1/10 · Minimal
- Est. fire insurance / yr
- $511 – $949
Heat risk 4/10 · Minor
- Hot days now (above 97°F)
- 7 days/yr
- Hot days in 30 yrs
- 19 days/yr
Wind risk 2/10 · Minimal
- Chance of severe wind over 30 yrs
- 0.0%
Air-quality risk 3/10 · Minor
- Unhealthy air days now
- 2 days/yr
- Unhealthy air days in 30 yrs
- 4 days/yr
Risk factors via First Street. Map © Google.
Why this score? — see what drove the C+ grade
The composite is a weighted blend of 9 inputs, each scored 0–100. Each bar is that input's sub-score; the figure is the points it added to the 100-point composite (weight × sub-score).
- Cash flow +22.6/30.0
- ARV discount +12.5/15.0
- DSCR +7.2/10.0
- 1% rule +6.4/10.0
- Livability +4.1/5.0
- Rent growth +2.5/5.0
- Condition / age +2.5/5.0
- Schools +2.3/10.0
- Appreciation +0.0/10.0
$105,000
🖨 Deal sheet 📄 Offer letter ✓ Due diligence
Listing remarks
Step into the charm of a bygone era with this 1920 two-story home, rich with character and waiting for the right vision to bring it back to life. Situated on a desirable corner lot, this 3 bed home offers the kind of space and craftsmanship that's hard to find today. A welcoming covered front porch sets the tone, inviting you to slow down and appreciate the homes timeless appeal. Inside, you'll find generously sized rooms throughout, including a spacious living room anchored by a fireplace, a formal dining room with its own decorative fireplace - perfect for entertaining - and a large eat in kitchen with plenty of room to reimagine and make it your own. Upstairs, the oversized primary bedro
Key facts
- Covered front porch
- Large eat in kitchen
- Corner lot
Tags
Property features AI
Exterior
- Parking: Detached garage (1 parking space)
- Home design: 2 stories; Asphalt roof
- Construction: Construction materials not specified
- Exterior features: Resale condition
Interior
- Kitchen: Dishwasher; Stove; Refrigerator
- Flooring: Hardwood; Laminate; Carpet
- Bathrooms: 1 full bathroom
- Heating & cooling: Forced air gas heating; Central air conditioning
- Interior features: Unfinished basement; Three fireplaces
- Laundry & utility: Washer; Dryer; Some electric appliances
Neighborhood map
What this means for you Summary
Snapshot
- This is a 3-bed/1.5-bath single-family listed at $105k.
Deal economics
- At list price, monthly cash flow is $178 ($2k/yr) — positive.
- The deal already cash-flows at list — no discount required.
- Meets the 1% rule at list price ($1k rent vs $105k).
Location & tenants
- Location reads 82/100 on livability (#153 in PA, #1,275 nationally) — a professional / high-income tenant draw. Strengths: commute A+, cost of living A+, housing A+; Watch: amenities F, employment D-.
- New Brighton Area SD (suburban): math 17% / reading 37% proficiency, ranked #458 of 539 in PA (top 85%) — low school quality limits family demand, transient renter base, plan for 1-2y turnover.
- Market conditions: 42 active listings in the ZIP; 6 comparable units currently listed for rent nearby; rentals at typical pace (median 15d on market — plan ~3-4 weeks tenant-placement turnaround); 272 units permitted in Beaver County in 2024 (80 in 5+ unit buildings).
Forward outlook
- Local home prices are declining (-3.0%/yr); year-one equity from $726 of loan paydown is wiped out by about $3k of value loss. Plan a longer hold.
- Beaver County population projected at -14% by 2050 — secular population decline; favor cash flow + early exit over multi-decade hold.
Negotiation context
- Only 8 days on market — expect competitive offers; lowballing is unlikely to land.
- Current owner paid $28k; list at $105k implies a 275% gain — meaningful room to come down on a strong offer.
Risks & watch-outs
- Watch-outs: built in 1920 — expect roof / HVAC / electrical / plumbing capex.
Questions for the listing agent
- Built in 1920 — when were the roof, HVAC, electrical panel, plumbing, and water heater last replaced?
- Is there a deadline driving the sale (1031 exchange, divorce, estate, relocation)? That informs how much negotiation room exists.
- What's the average days-on-market for RENTAL listings here right now (not sales)? A rising rental-DOM trend means longer vacancies and softer asking-rent achievability than the comps imply.
- What's the recent tenant-quality profile in this submarket — average credit score on applications, eviction rate, late-payment / NSF rate, and stable-employment percentage? A property-management company in the area should have these aggregated.
- How much new for-sale + rental construction is in the pipeline within 1–3 miles? Heavy new supply typically softens prices + rents 12–24 months out; constrained supply supports both.
Investment metrics
- 1% rule
- 1.14% ✓
- Cap rate
- 8.33%
- Cash-on-cash
- 7.26%
- DSCR
- 1.32
- GRM
- 7.3
CMA / ARV
- ARV (median comp)
- $118,069
- List price
- $105,000
- Delta
- -11.07%
- Verdict
- UNDERPRICED
- Comps
- 20 within 1.0 mi
Show comp detail 12 sales within ~0.75 mi
| Address | Dist | Beds/Ba | Sqft | Sold | Price | $/sf | Match |
|---|---|---|---|---|---|---|---|
| 912 Penn Ave | 0.13mi | 3/1.5 | 1,320 (-5%) | 3mo | $63,000 | $48 | 83 |
| 722 6th Ave | 0.22mi | 3/1.0 | 1,446 (+4%) | 1mo | $105,000 | $73 | 80 |
| 1618 3rd St | 0.59mi | 3/1.0 | 1,344 (-3%) | 2mo | $169,900 | $126 | 63 |
| 715 5th St | 0.42mi | 2/2.0 (-1) | 1,292 (-7%) | 1mo | $175,111 | $136 | 61 |
| 508 6th Ave | 0.39mi | 3/1.0 | 1,232 (-11%) | 2mo | $143,000 | $116 | 59 |
| 626 10th Ave | 0.27mi | 4/1.5 (+1) | 1,588 (+14%) | 1mo | $195,597 | $123 | 57 |
| 1416 5th Ave | 0.42mi | 4/1.0 (+1) | 1,506 (+8%) | 4mo | $139,900 | $93 | 56 |
| 725 11th Ave | 0.22mi | 2/1.0 (-1) | 1,184 (-15%) | 3mo | $55,000 | $46 | 56 |
| 1011 5th St | 0.51mi | 3/2.0 | 1,533 (+10%) | 2mo | $132,000 | $86 | 55 |
| 498 Blockhouse Run Rd | 0.51mi | 3/1.0 | 1,536 (+11%) | 2mo | $119,000 | $77 | 54 |
| 317 19th Ave | 0.61mi | 3/1.5 | 1,542 (+11%) | 3mo | $125,000 | $81 | 51 |
| 1556 2nd St | 0.62mi | 2/1.0 (-1) | 1,192 (-14%) | 4mo | $125,000 | $105 | 37 |
Match score weights: distance 35% · size 25% · config 20% · recency 20%. Top-matched comps best support the ARV.
Projected returns pro-forma
-3.0% appreciation · 3.0% rent growth · sell at horizon
- IRR
- -5.1%
- Equity multiple
- 0.81×
- Total profit
- $-5,642
- Equity at exit
- $15,656
- IRR
- 4.6%
- Equity multiple
- 1.33×
- Total profit
- $9,848
- Equity at exit
- $9,078
Cash invested: $29,400 (down + closing). Projections, not guarantees.
Landlord ↔ Tenant lean methodology
- Overall (STATE)
- 62 Landlord-Friendly
- State Pennsylvania
- 62 Landlord-Friendly · EVEN
- County
- — inherits STATE
- City
- — inherits STATE
ZIP-level market 15066
- Home prices YoY
- -26.8%
- Active inventory
- 42
- Price-to-rent
- 7.3×
Monthly cashflow live
- Estimated rent
- $1,193 high interval (Pro) →
- Mortgage (P&I)
- −$551
- Tax from tax record
- −$170 /mo · $2,044/yr
- Insurance
- −$44
- HOA
- −$0
- Vacancy / Maint / Mgmt
- −$251
- Net cashflow
- $178
Break-even live
UW: 25.0% down · 7.5% · 30yr · 1.5% tax · 5.0% vac · 8.0% maint · 8.0% mgmt
Financing live
Cash to close
- Down payment
- $26,250
- Closing costs
- $3,150
- Reserves months
- —
- Total cash needed
- —
Loan-product check · same deal, 3 products live
Conventional
25% down · 7.5% · 30yr
- Down + closing
- —
- Monthly P&I
- —
- Monthly cashflow
- —
- DSCR
- —
- Eligible?
- —
Personal DTI + credit; lowest rate.
DSCR
20% down · 8.5% · 30yr
- Down + closing
- —
- Monthly P&I
- —
- Monthly cashflow
- —
- DSCR
- —
- Eligible?
- —
No personal income docs; deal must DSCR.
Hard money
10% down · 12.0% · 12mo
- Down + closing
- —
- Monthly P&I
- —
- Monthly cashflow
- —
- DSCR
- —
- Eligible?
- —
Short-term bridge; refi at stabilization.
Rent comps 6 comps
| Address | Beds | Baths | Sqft | Rent | $/sqft | DOM | Units | Dist |
|---|---|---|---|---|---|---|---|---|
| 904 Penn Ave Unit 1 New Brighton, PA | 2.0 | 1.0 | 1300 | $995 | $0.77 | 17d | 1 | 0.13mi |
| 1459 4th St New Brighton, PA | 3.0 | 2.0 | 1312 | $1,625 | $1.24 | 14d | 1 | 0.59mi |
| 1620 6th Ave New Brighton, PA | 2.0 | 1.0 | 1260 | $975 | $0.77 | 43d | 1 | 0.64mi |
| 1909 5th Ave New Brighton, PA | 2.0–3.0 | 1.0–2.0 | 807 | $1,523 | $1.89 | 1d | 3 | 0.86mi |
| 1503 3rd Ave Beaver Falls, PA | 3.0 | 1.0 | 1200 | $1,350 | $1.12 | 1d | 1 | 1.48mi |
| 418 Darlington Rd Beaver Falls, PA | 2.0 | 1.5 | 975 | $1,350 | $1.38 | 12d | 1 | 1.48mi |
Listing history 5 events
-
2026-05-14status Pending 1214-char remark
-
2026-05-06$105,000 Active 1214-char remark
-
1994-07-19soldstatus $28,000
-
1987-05-26soldstatus $22,000
-
1979-09-01soldstatus $30,000
ⓘ Source: listings_history table (triggers on properties + properties_extension) + one-shot
backfill from property_details.listing_events for pre-trigger history.
Tax reassessment forecast PA · Partial reset (capped growth)
- Current annual tax
- $2,044 · $170/mo
- Projected year-2 tax
- $2,044 · $170/mo
- Expected delta
- $0/yr ($0/mo · 0.0%)
ⓘ Screening estimate from a state-policy table — verify with the county assessor before closing.
Climate risk First Street
- Flood 1/10 Low FEMA zone X (unshaded) · 0% chance over 30 yrs
- Wildfire 1/10 Low
- Heat 4/10 Moderate 7 d/yr ≥97°F today · 19 d/yr by 30 yrs out
- Wind 2/10 Low 0% chance of damaging wind over 30 yrs
- Air quality 3/10 Moderate 2 unhealthy d/yr today · 4 by 30 yrs out
Nearby sold comps map
Loading sold comps map…
Walkable amenities ~0.75 mi
Loading nearby amenities…
Taxation est. · year 1
- Rental income
- $14,318
- − Mortgage interest
- −$5,882
- − Property taxes
- −$2,044
- − Insurance
- −$525
- − Repairs & maintenance
- −$1,145
- − Management
- −$1,145
- − Depreciation
- −$3,055
- Taxable income
- $522
- Est. tax owed @ 24.0%
- −$125
- After-tax cash flow
- $2,010/yr
For passive investors: Depreciation is non-cash, so a rental often shows a tax loss while cash-flowing — sheltering income. Rental losses are passive: they offset passive income freely, and up to $25,000/yr can offset ordinary (W-2) income if you actively participate and your MAGI is under $100k (phasing out to $0 by $150k); unused losses carry forward. On sale, claimed depreciation is recaptured at up to 25%, and gains may owe capital-gains tax (a 1031 exchange can defer both). Figures are a year-1 estimate at your 24.0% rate — not tax advice; consult a CPA.
Schools (NCES district)
- District
- New Brighton Area SD
- NCES district ID
- 4216530
- Math proficiency
- 17% ▼ -17.00%
- Reading proficiency
- 37% ▼ -22.00%
- Median HH income
- $41,579
- Composite
- 22.83/100
- National rank
- #8014
- State rank
- #458 of 539 in PA
Livability — New Brighton
- Score
- 82/100
- State rank
- #153
- US rank
- #1275
Category grades
Schools grade is shown separately in the Schools card above.
Census & demographics
- Census place
- New Brighton, PA
- County
- Beaver County · 116,001 people
- City population
- 12,048
- Metro
- Pittsburgh, PA
- Population (ZIP)
- 12,048
- Household income
- $63,836
- Rent vs Own
- Severe rent burden
- 187.0
Population outlook (Beaver County) Hauer SSP2
- Today (2025)
- 164,976 people
- By 2030
- 161,449 · -2.1%
- By 2040
- 151,752 · -8.0%
- By 2050
- 141,155 · -14.4%
- By 2075
- 118,142 · -28.4%
- By 2100
- 91,740 · -44.4%
Race, ethnicity, and origin ACS 2023
- Neighborhood character
- Predominantly White (87%)
- Race & ethnicity
- White 87% Black 5% Two or more races 4% Hispanic / Latino 3%
- Common ancestry
- Romanian 6% Serbian 2% Lithuanian 2%
- Foreign-born
- 0%
- Languages at home
- 98% English-only · Spanish 2%
Political lean MEDSL · Beaver
- 2024 margin
- Strong R (+20.7) · D 39.2% · R 59.9%
- 2008→2024 swing
- -17.9pp toward R · 2008: -2.8pp · 2024: -20.7pp
- All cycles
- 2024: R+20.7 2020: R+17.7 2016: R+20.1 2012: R+6.6 2008: R+2.8
Not yet ingested
- Civics
- —
Market trends
- HPI YoY
- ▼ -67.49%
- Current HPI
- 184.7104
- Rent YoY
- —
- Metro
- Pittsburgh, PA
- State GDP YoY
- ▲ 1.68%
- F500 in state
- 34
Industry mix (Fortune 500 HQ in PA)
| Industry | F500 HQs | Revenue |
|---|---|---|
| Healthcare | 2 | $309B |
|
||
| Insurance | 2 | $27B |
|
||
| Telecommunications / Media | 1 | $124B |
|
||
| Industrial Distribution | 1 | $22B |
|
||
| Financial Services | 1 | $20B |
|
||
| Chemicals / Materials | 1 | $18B |
|
||
Price history
+250.0% since first listed5 events — show timeline
- 2026-05-14 Pending — West Penn MLS
- 2026-05-06 Listed $105,000 West Penn MLS
- 1994-07-19 Sold (Public Records) $28,000 Public Records
- 1987-05-26 Sold (Public Records) $22,000 Public Records
- 1979-09-01 Sold (Public Records) $30,000 Public Records
Property tax history
+3.1%/yrLatest (2026): $2,044 · +4.7% YoY. Source: county tax records.
Cash-flow waterfall
monthlySold comps — $/sqft
last 12 mo · ≤1 miLoading sold comps…