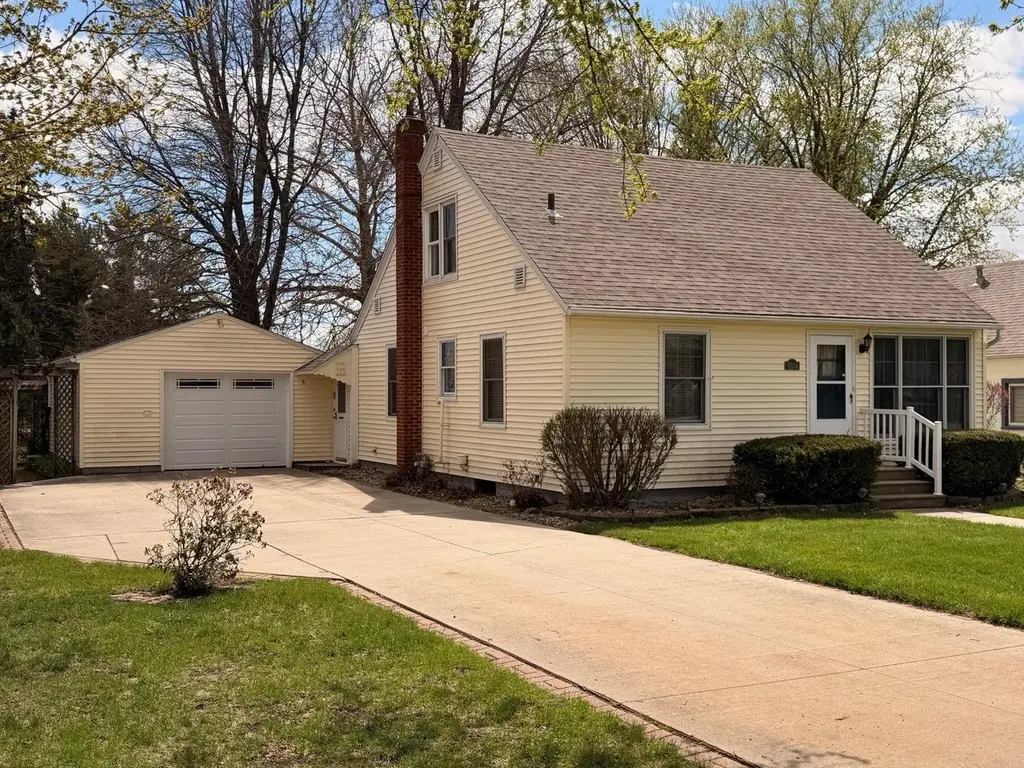
1034 Hawley St · Jesup, IA
Flood risk 1/10 · Minimal
- FEMA flood zone
- X (unshaded)
- Chance of flooding over 30 yrs
- 0.0%
- Est. flood insurance / yr
- $473 – $860
Fire risk 1/10 · Minimal
- Est. fire insurance / yr
- $902 – $1,676
Heat risk 3/10 · Minor
- Hot days now (above 102°F)
- 7 days/yr
- Hot days in 30 yrs
- 15 days/yr
Wind risk 2/10 · Minimal
- Chance of severe wind over 30 yrs
- —
Air-quality risk 1/10 · Minimal
- Unhealthy air days now
- 0 days/yr
- Unhealthy air days in 30 yrs
- 0 days/yr
Risk factors via First Street. Map © Google.
Why this score? — see what drove the D- grade
The composite is a weighted blend of 9 inputs, each scored 0–100. Each bar is that input's sub-score; the figure is the points it added to the 100-point composite (weight × sub-score).
- ARV discount +8.6/15.0
- Cash flow +8.2/30.0
- Schools +6.2/10.0
- Livability +3.7/5.0
- 1% rule +2.6/10.0
- Rent growth +2.5/5.0
- Condition / age +2.5/5.0
- DSCR +2.2/10.0
- Appreciation +0.0/10.0
$160,000
🖨 Deal sheet 📄 Offer letter ✓ Due diligence
Listing remarks
Come see this charming 1½-story, 4-bedroom, 2-bath home nestled in a beautiful neighborhood in Jesup. This lovely property features a small workshop in the basement, an attached one-stall garage, and a park-like backyard setting. Plus, it’s just a short walk to the City Park!
Key facts
- Park-like backyard
- Small workshop
- 0.23 acre lot
Tags
Neighborhood map
What this means for you Summary
Snapshot
- This is a 3-bed/1.0-bath single-family listed at $160k.
Deal economics
- At list price, monthly cash flow is $-149 ($-2k/yr) — negative.
- To cash-flow at today's rent, offer at most $134k (16.4% below list).
- To meet the 1% rule (rent ≥ 1% of price), the offer needs to be $121k (24.5% below list).
- Recommended offer: $121k (24.5% below list) — sets the bar for 1% rule.
- Cap rate 5.2% vs local median 2.2% in Jesup — top-decile yield for the area; either an underpriced asset or a hidden risk that comps aren't pricing in. Stress-test before assuming the spread holds.
Location & tenants
- Location reads 73/100 on livability (#263 in IA) — a middle-class / working-renter tenant base. Strengths: crime A+, employment A+, cost of living A+; Watch: amenities F, commute F.
- Jesup Community School District (rural): math 72% / reading 71% proficiency, ranked #102 of 289 in IA (top 35%) — strong family-tenant draw, lease renewals of 3-5y typical; only 20% free/reduced lunch — higher-income household profile.
- Zoned schools: Jesup Elementary School (math 82% / reading 72%, grade A, #103 of 616 statewide, top 20%, 438 students, 27% FRL); Jesup Middle School (math 68% / reading 71%, grade A, #113 of 246 statewide, top 49%, 252 students, 21% FRL); Jesup High School (math 76% / reading 75%, grade A-, #79 of 336 statewide, top 25%, 278 students, 23% FRL) — zoned schools at 24% FRL track the district average.
- Market conditions: 41 active listings in the ZIP; 19 units permitted in Buchanan County in 2024 (0 in 5+ unit buildings).
Forward outlook
- Local home prices are declining (-3.0%/yr); year-one equity from $1k of loan paydown is wiped out by about $5k of value loss. Plan a longer hold.
- Buchanan County population projected to shrink 9% by 2050 — rents likely to lag national; underwrite the cash flow, not the appreciation.
Negotiation context
- Only 2 days on market — expect competitive offers; lowballing is unlikely to land.
Risks & watch-outs
- Watch-outs: built in 1949 — expect roof / HVAC / electrical / plumbing capex.
Questions for the listing agent
- What do current leases actually rent for vs. the listed asking? Can we see a recent rent roll and the last 12 months of T-12 income?
- Built in 1949 — when were the roof, HVAC, electrical panel, plumbing, and water heater last replaced?
- Is there a deadline driving the sale (1031 exchange, divorce, estate, relocation)? That informs how much negotiation room exists.
- Schools are A-rated — typically a magnet for longer-tenancy family renters. What's the average tenant stay here, and is there a school-zone premium baked into asking?
- The area grade is low — what's the realistic commute time and amenity access for the typical tenant pool here? Any planned neighborhood developments (good or bad) we should know about?
- What's the average days-on-market for RENTAL listings here right now (not sales)? A rising rental-DOM trend means longer vacancies and softer asking-rent achievability than the comps imply.
- What's the recent tenant-quality profile in this submarket — average credit score on applications, eviction rate, late-payment / NSF rate, and stable-employment percentage? A property-management company in the area should have these aggregated.
- How much new for-sale + rental construction is in the pipeline within 1–3 miles? Heavy new supply typically softens prices + rents 12–24 months out; constrained supply supports both.
Investment metrics
- 1% rule
- 0.76% ✗
- Cap rate
- 5.18%
- Cash-on-cash
- -3.98%
- DSCR
- 0.82
- GRM
- 11.0
CMA / ARV
- ARV (on-the-fly)
- $163,932
- Comps found
- 12
Show comp detail 12 sales within ~0.75 mi
| Address | Dist | Beds/Ba | Sqft | Sold | Price | $/sf | Match |
|---|---|---|---|---|---|---|---|
| 1175 Hawley St | 0.15mi | 4/1.5 (+1) | 1,392 (-3%) | 6mo | $167,000 | $120 | 76 |
| 1275 Hawley St | 0.26mi | 2/2.0 (-1) | 1,488 (+4%) | 5mo | $210,000 | $141 | 69 |
| 634 4th St | 0.51mi | 3/2.0 | 1,476 (+3%) | 4mo | $160,000 | $108 | 64 |
| 1235 9th St | 0.42mi | 3/2.0 | 1,354 (-6%) | 11mo | $235,000 | $174 | 57 |
| 1255 4th St | 0.64mi | 3/1.0 | 1,342 (-7%) | 5mo | $147,500 | $110 | 55 |
| 824 Prospect St St | 0.28mi | 4/2.0 (+1) | 1,572 (+9%) | 12mo | $225,000 | $143 | 52 |
| 435 5th ST St | 0.45mi | 3/1.5 | 1,232 (-14%) | 2mo | $162,000 | $131 | 52 |
| 555 6th St | 0.33mi | 2/1.0 (-1) | 1,231 (-14%) | 10mo | $140,000 | $114 | 47 |
| 255 Young St | 0.57mi | 3/1.5 | 1,568 (+9%) | 15mo | $150,000 | $96 | 44 |
| 425 Church St | 0.50mi | 3/2.0 | 1,269 (-12%) | 15mo | $130,000 | $102 | 41 |
| 154 Hawley St | 0.65mi | 4/1.0 (+1) | 1,274 (-11%) | 6mo | $99,000 | $78 | 40 |
| 154 Prospect St | 0.69mi | 4/2.0 (+1) | 1,520 (+6%) | 11mo | $167,500 | $110 | 40 |
Match score weights: distance 35% · size 25% · config 20% · recency 20%. Top-matched comps best support the ARV.
Projected returns pro-forma
-3.0% appreciation · 3.0% rent growth · sell at horizon
- IRR
- -23.0%
- Equity multiple
- 0.21×
- Total profit
- $-35,385
- Equity at exit
- $23,857
- IRR
- -17.5%
- Equity multiple
- 0.04×
- Total profit
- $-42,946
- Equity at exit
- $13,834
Cash invested: $44,800 (down + closing). Projections, not guarantees.
Landlord ↔ Tenant lean methodology
- Overall (STATE)
- 83 Strongly Landlord-Friendly
- State Iowa
- 83 Strongly Landlord-Friendly · R+6
- County
- — inherits STATE
- City
- — inherits STATE
ZIP-level market 50648
- Active inventory
- 41
- Price-to-rent
- 11.0×
Monthly cashflow live
- Estimated rent
- $1,208 medium interval (Pro) →
- Mortgage (P&I)
- −$839
- Tax from tax record
- −$198 /mo · $2,372/yr
- Insurance
- −$67
- HOA
- −$0
- Vacancy / Maint / Mgmt
- −$254
- Net cashflow
- $-149
Break-even live
UW: 25.0% down · 7.5% · 30yr · 1.5% tax · 5.0% vac · 8.0% maint · 8.0% mgmt
Financing live
Cash to close
- Down payment
- $40,000
- Closing costs
- $4,800
- Reserves months
- —
- Total cash needed
- —
Loan-product check · same deal, 3 products live
Conventional
25% down · 7.5% · 30yr
- Down + closing
- —
- Monthly P&I
- —
- Monthly cashflow
- —
- DSCR
- —
- Eligible?
- —
Personal DTI + credit; lowest rate.
DSCR
20% down · 8.5% · 30yr
- Down + closing
- —
- Monthly P&I
- —
- Monthly cashflow
- —
- DSCR
- —
- Eligible?
- —
No personal income docs; deal must DSCR.
Hard money
10% down · 12.0% · 12mo
- Down + closing
- —
- Monthly P&I
- —
- Monthly cashflow
- —
- DSCR
- —
- Eligible?
- —
Short-term bridge; refi at stabilization.
Listing history 2 events
-
2026-04-20status Pending
-
2026-04-18$160,000 Active
ⓘ Source: listings_history table (triggers on properties + properties_extension) + one-shot
backfill from property_details.listing_events for pre-trigger history.
Tax reassessment forecast IA · Partial reset (capped growth)
- Current annual tax
- $2,372 · $198/mo
- Projected year-2 tax
- $2,442 · $204/mo
- Expected delta
- +$70/yr (+$6/mo · 3.0%)
ⓘ Screening estimate from a state-policy table — verify with the county assessor before closing.
Climate risk First Street
- Flood 1/10 Low FEMA zone X (unshaded) · 0% chance over 30 yrs
- Wildfire 1/10 Low
- Heat 3/10 Moderate 7 d/yr ≥102°F today · 15 d/yr by 30 yrs out
- Wind 2/10 Low
- Air quality 1/10 Low 0 unhealthy d/yr today · 0 by 30 yrs out
Nearby sold comps map
Loading sold comps map…
Walkable amenities ~0.75 mi
Loading nearby amenities…
Taxation est. · year 1
- Rental income
- $14,501
- − Mortgage interest
- −$8,962
- − Property taxes
- −$2,372
- − Insurance
- −$800
- − Repairs & maintenance
- −$1,160
- − Management
- −$1,160
- − Depreciation
- −$4,655
- Taxable loss
- −$4,609
- Est. tax savings @ 24.0%
- +$1,106
- After-tax cash flow
- $-679/yr
For passive investors: Depreciation is non-cash, so a rental often shows a tax loss while cash-flowing — sheltering income. Rental losses are passive: they offset passive income freely, and up to $25,000/yr can offset ordinary (W-2) income if you actively participate and your MAGI is under $100k (phasing out to $0 by $150k); unused losses carry forward. On sale, claimed depreciation is recaptured at up to 25%, and gains may owe capital-gains tax (a 1031 exchange can defer both). Figures are a year-1 estimate at your 24.0% rate — not tax advice; consult a CPA.
Schools (NCES district)
- District
- Jesup Community School District
- NCES district ID
- 1915330
- Math proficiency
- 72% ▲ 2.00%
- Reading proficiency
- 71% ▲ 4.00%
- Median HH income
- $61,965
- Composite
- 61.77/100
- National rank
- #736
- State rank
- #102 of 289 in IA
Livability — Jesup
- Score
- 73/100
- State rank
- #263
- US rank
- #5081
Category grades
Schools grade is shown separately in the Schools card above.
Census & demographics
- Census place
- Jesup, IA
- Population (ZIP)
- 4,120
Population outlook (Buchanan County) Hauer SSP2
- Today (2025)
- 20,892 people
- By 2030
- 20,578 · -1.5%
- By 2040
- 19,906 · -4.7%
- By 2050
- 19,024 · -8.9%
- By 2075
- 16,289 · -22.0%
- By 2100
- 12,561 · -39.9%
Race, ethnicity, and origin ACS 2023
- Neighborhood character
- Predominantly White (97%)
- Race & ethnicity
- White 97% Hispanic / Latino 2% Two or more races 1%
- Common ancestry
- Portuguese 3% Iranian 3% Lithuanian 2%
- Foreign-born
- 1%
Political lean MEDSL · Buchanan
- 2024 margin
- Strong R (+28.2) · D 35.1% · R 63.4% · Other 1.5%
- 2008→2024 swing
- -46.7pp toward R · 2008: 18.5pp · 2024: -28.2pp
- All cycles
- 2024: R+28.2 2020: R+20.9 2016: R+15.2 2012: D+13.9 2008: D+18.5
Not yet ingested
- Civics
- —
Market trends
- HPI YoY
- ▼ -109.67%
- Current HPI
- 190.7617
- Rent YoY
- —
- Metro
- —
- State GDP YoY
- ▲ 2.48%
- F500 in state
- 4
Industry mix (Fortune 500 HQ in IA)
| Industry | F500 HQs | Revenue |
|---|---|---|
| Financial Services | 1 | $16B |
|
||
| Retail / Convenience | 1 | $15B |
|
||
Price history
2 events — show timeline
- 2026-04-20 Pending — NEIRBR as distributed by MLS GRID
- 2026-04-18 Listed $160,000 NEIRBR as distributed by MLS GRID
Property tax history
+2.3%/yrLatest (2025): $2,372 · -1.8% YoY. Source: county tax records.
Cash-flow waterfall
monthlySold comps — $/sqft
last 12 mo · ≤1 miLoading sold comps…