24945 Windward Blvd · Bonita Springs, FL
Flood risk 8/10 · Major
- FEMA flood zone
- X (shaded)
- Chance of flooding over 30 yrs
- 0.96%
- Est. flood insurance / yr
- $507 – $1,088
Fire risk 1/10 · Minimal
- Est. fire insurance / yr
- $947 – $1,759
Heat risk 10/10 · Severe
- Hot days now (above 107°F)
- 7 days/yr
- Hot days in 30 yrs
- 30 days/yr
Wind risk 10/10 · Severe
- Chance of severe wind over 30 yrs
- 99.0%
Air-quality risk 3/10 · Minor
- Unhealthy air days now
- 2 days/yr
- Unhealthy air days in 30 yrs
- 2 days/yr
Risk factors via First Street. Map © Google.
Why this score? — see what drove the D grade
The composite is a weighted blend of 9 inputs, each scored 0–100. Each bar is that input's sub-score; the figure is the points it added to the 100-point composite (weight × sub-score).
- Cash flow +13.3/30.0
- ARV discount +7.5/15.0
- Schools +4.1/10.0
- DSCR +4.0/10.0
- Livability +3.5/5.0
- 1% rule +3.4/10.0
- Rent growth +3.2/5.0
- Condition / age +2.5/5.0
- Appreciation +0.0/10.0
$369,500
🖨 Deal sheet (PDF) 📄 Offer letter ✓ Due diligence
Listing remarks
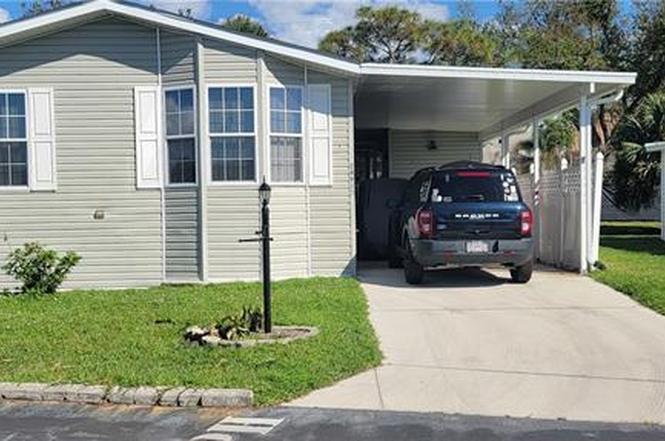
BRAND NEW ROOF on this 2008 Jacobson manufactured home which is located on one of the highest elevated lots in the Village with a private backyard! The home is beautifully furnished & sits on the outside edge of the community giving the home a secluded backyard retreat feeling. The open living room /dining room and kitchen has vaulted ceilings with upgraded 5-inch crown molding. The kitchen features an attached walk out screened lanai area that is elevated to the same height as the living level extending the kitchen to the outdoors enjoying every minute of the "Florida outdoor living lifestyle!" Upgraded Jacobson kitchen cabinets & stainless-steel appliances, good cou
Key facts
- Private backyard
- Solar tube lighting
- 4,094 sq ft lot
Tags
Property features AI
Finance
- Other: Community type: boating, mobile/manufactured, non-gated
- HOA & community: Mandatory HOA; Quarterly master HOA fee ($290); Total annual recurring fees $1,160; One-time fees $375; Professional management; HOA maintenance includes legal/accounting and manager; Community amenities: clubhouse, community pool and spa/hot tub, community park, dog park, library, boat storage, community boat dock and ramp, community gulf boat access, fishing pier, fish cleaning station, shuffleboard, bocce court, pickleball, tennis and basketball courts, BBQ/picnic area, billiards, underground utilities
Exterior
- Parking: Covered parking; Paved driveway; Paved parking area; Attached carport (1 space); 2+ parking spaces
- Utilities: Central water (assessment paid); Central sewer (assessment paid); Cable available; Electric service
- Home design: Manufactured residential home; 1-story ranch; Rear exposure faces east
- Construction: Built in 2008; Manufactured construction; Shingle roof; Thermal and sliding windows; single-hung windows
- Exterior features: Deck; Decorative shutters; Shutters for storm protection; Vinyl siding; Skylight
Interior
- Kitchen: Pantry; Dishwasher; Disposal; Microwave; Range; Self-cleaning oven; Refrigerator/freezer; Reverse osmosis
- Bedrooms: 2 bedrooms plus den; Primary bedroom on ground floor; Additional bedroom on first floor
- Flooring: Carpet; Vinyl
- Bathrooms: 2 full bathrooms; Primary bathroom with shower only
- Heating & cooling: Central electric heat; Central electric cooling; Ceiling fans; Exhaust fan
- Interior features: Built-in cabinets; Cable prewire; Closet cabinets; High-speed internet available; Pantry; Smoke detectors; Vaulted ceiling; Walk-in closet; Window coverings; Guest bath; Guest room; Home office; Screened lanai/porch; Furnished
- Laundry & utility: Washer; Dryer; Laundry in residence
Neighborhood map
What this means for you Summary
Snapshot
- This is a 2-bed/2.0-bath manufactured listed at $370k.
Deal economics
- At list price, monthly cash flow is $-67 ($-806/yr) — negative.
- To cash-flow at today's rent, offer at most $358k (3.2% below list).
- To meet the 1% rule (rent ≥ 1% of price), the offer needs to be $311k (15.9% below list).
- Recommended offer: $311k (15.9% below list) — sets the bar for 1% rule.
- Cap rate 6.3% vs local median 1.7% in Bonita Springs — top-decile yield for the area; either an underpriced asset or a hidden risk that comps aren't pricing in. Stress-test before assuming the spread holds.
Location & tenants
- Location reads 70/100 on livability (#428 in FL) — a middle-class / working-renter tenant base. Strengths: crime A+, housing A+, employment A; Watch: schools C-, cost of living C-, health & safety D.
- Lee (suburban): math 47% / reading 50% proficiency, ranked #42 of 73 in FL (top 58%) — families likely to look elsewhere, expect single-tenant / working-renter base with shorter leases.
- Market conditions: Rents rising (+2.9%/yr); 699 active listings in the ZIP; 26 comparable units currently listed for rent nearby; rentals at typical pace (median 25d on market — plan ~3-4 weeks tenant-placement turnaround); high-income renter base; 15,411 units permitted in Lee County in 2024 (4,686 in 5+ unit buildings).
Forward outlook
- Local home prices are declining (-3.0%/yr); year-one equity from $3k of loan paydown is wiped out by about $11k of value loss. Plan a longer hold.
- Lee County population projected at +44% by 2050 — long-run rental-demand tailwind backs the buy-and-hold thesis.
Negotiation context
- It's been on market 216 days — a 12% lower offer ($325k) is reasonable based on typical stale-listing flexibility.
- 3 sale attempts since 2y ago with the ask held roughly flat each time — persistent listings suggest the price (not the market) is what's stuck; bring a comps-based counter.
Risks & watch-outs
- Watch-outs: flood insurance adds $66/mo.
- Climate carrying-cost: severe flood risk; severe wind risk, 99% chance of damaging wind over 30y; extreme-heat days projected 7→30/yr by 2055 (HVAC capex compounding) — expect insurance premiums to compound above CPI over the hold.
Questions for the listing agent
- What do current leases actually rent for vs. the listed asking? Can we see a recent rent roll and the last 12 months of T-12 income?
- It's been on market 216 days. Have you received any prior offers? Is the seller open to a 16% concession, seller financing, or rate buy-down credit?
- What's the actual annual flood-insurance premium (NFIP or private), and is the property in a SFHA with mandatory coverage?
- What does the HOA fee cover, when was the last increase, and are there any pending special assessments or reserve-fund shortfalls?
- Why hasn't it sold? Are there any deal-killer items the seller is aware of (foundation, flood, title, zoning, code violations)?
- Is there a deadline driving the sale (1031 exchange, divorce, estate, relocation)? That informs how much negotiation room exists.
- The area grade is low — what's the realistic commute time and amenity access for the typical tenant pool here? Any planned neighborhood developments (good or bad) we should know about?
- What's the average days-on-market for RENTAL listings here right now (not sales)? A rising rental-DOM trend means longer vacancies and softer asking-rent achievability than the comps imply.
- What's the recent tenant-quality profile in this submarket — average credit score on applications, eviction rate, late-payment / NSF rate, and stable-employment percentage? A property-management company in the area should have these aggregated.
- How much new for-sale + rental construction is in the pipeline within 1–3 miles? Heavy new supply typically softens prices + rents 12–24 months out; constrained supply supports both.
Investment metrics
- 1% rule
- 0.84% ✗
- Cap rate
- 6.29%
- Cash-on-cash
- -0.01%
- DSCR
- 1.00
- GRM
- 9.9
CMA / ARV
No comps found within radius.
Projected returns pro-forma
-3.0% appreciation · 2.85% rent growth · sell at horizon
- IRR
- -17.7%
- Equity multiple
- 0.38×
- Total profit
- $-64,594
- Equity at exit
- $55,094
- IRR
- -10.1%
- Equity multiple
- 0.39×
- Total profit
- $-63,558
- Equity at exit
- $31,948
Cash invested: $103,460 (down + closing). Projections, not guarantees.
Landlord ↔ Tenant lean methodology
- Overall (STATE)
- 87 Strongly Landlord-Friendly
- State Florida
- 87 Strongly Landlord-Friendly · R+3
- County
- — inherits STATE
- City
- — inherits STATE
ZIP-level market 34134
- Rents YoY
- 2.9%
- Active inventory
- 699
- Price-to-rent
- 9.9×
Monthly cashflow live
- Estimated rent
- $3,109 medium interval (Pro) →
- Mortgage (P&I)
- −$1,938
- Tax from tax record
- −$268 /mo · $3,215/yr
- Insurance
- −$154
- Flood insurance flood zone
- −$66 /mo · $798/yr
- HOA
- −$97
- Vacancy / Maint / Mgmt
- −$653
- Net cashflow
- $-67
Break-even live
Sensitivity live
| Price | -10% $142 | -5% $37 | +0% $-67 | +5% $-172 | +10% $-276 |
|---|---|---|---|---|---|
| Rent | -10% $-313 | -5% $-190 | +0% $-67 | +5% $56 | +10% $178 |
| Rate | -1.0pp $119 | -0.5pp $27 | base $-67 | +0.5pp $-163 | +1.0pp $-260 |
UW: 25.0% down · 7.5% · 30yr · 1.5% tax · 5.0% vac · 8.0% maint · 8.0% mgmt
Financing live
Cash to close
- Down payment
- $92,375
- Closing costs
- $11,085
- Reserves months
- —
- Total cash needed
- —
Loan-product check · same deal, 3 products live
Conventional
25% down · 7.5% · 30yr
- Down + closing
- —
- Monthly P&I
- —
- Monthly cashflow
- —
- DSCR
- —
- Eligible?
- —
Personal DTI + credit; lowest rate.
DSCR
20% down · 8.5% · 30yr
- Down + closing
- —
- Monthly P&I
- —
- Monthly cashflow
- —
- DSCR
- —
- Eligible?
- —
No personal income docs; deal must DSCR.
Hard money
10% down · 12.0% · 12mo
- Down + closing
- —
- Monthly P&I
- —
- Monthly cashflow
- —
- DSCR
- —
- Eligible?
- —
Short-term bridge; refi at stabilization.
Rent comps 26 comps
| Address | Beds | Baths | Sqft | Rent | $/sqft | DOM | Units | Dist |
|---|---|---|---|---|---|---|---|---|
| 25151 Bay Cedar Dr Bonita Springs, FL | 2.0 | 2.0 | 1738 | $11,000 | $6.33 | 3d | 1 | 0.21mi |
| 4709 Kon Tiki Ln Bonita Springs, FL | 2.0 | 2.0 | 1475 | $1,500 | $1.02 | 25d | 1 | 0.26mi |
| 4161 Sawgrass Point Dr #101 Bonita Springs, FL | 2.0 | 2.0 | 1445 | $5,500 | $3.81 | 25d | 1 | 0.37mi |
| 4161 Sawgrass Point Dr #101 Bonita Springs, FL | 2.0 | 2.0 | 1445 | $5,500 | $3.81 | 22d | 1 | 0.37mi |
| 25130 Sandpiper Greens Ct #104 Bonita Springs, FL | 2.0 | 2.0 | 1392 | $6,500 | $4.67 | 25d | 1 | 0.40mi |
| 4700 Leilani Ln Bonita Springs, FL | 2.0 | 2.0 | 1380 | $5,000 | $3.62 | 25d | 1 | 0.41mi |
| 4200 Sawgrass Point Dr #101 Bonita Springs, FL | 2.0 | 2.0 | 1445 | $5,250 | $3.63 | 25d | 1 | 0.45mi |
| 4201 Sawgrass Point Dr #102 Bonita Springs, FL | 2.0 | 2.0 | 1319 | $5,000 | $3.79 | 25d | 1 | 0.48mi |
| 24360 Sandpiper Isle Way #101 Bonita Springs, FL | 2.0 | 2.0 | 1666 | $6,500 | $3.90 | 25d | 1 | 0.87mi |
| 24361 Sandpiper Isle Way #401 Bonita Springs, FL | 2.0 | 2.0 | 1807 | $8,000 | $4.43 | 25d | 1 | 0.88mi |
| 24827 Lakemont Cove Ln #101 Bonita Springs, FL | 2.0 | 2.0 | 1552 | $6,750 | $4.35 | 25d | 1 | 0.89mi |
| 24821 Lakemont Cove Ln #201 Bonita Springs, FL | 3.0 | 2.0 | 1633 | $7,000 | $4.29 | 25d | 1 | 0.91mi |
| 24821 Lakemont Cove Ln #101 Bonita Springs, FL | 2.0 | 2.0 | 1203 | $6,500 | $5.40 | 25d | 1 | 0.91mi |
| 24821 Lakemont Cove Ln #202 Bonita Springs, FL | 3.0 | 2.0 | 1658 | $5,000 | $3.02 | 22d | 1 | 0.91mi |
| 25232 Pelican Creek Cir #202 Bonita Springs, FL | 3.0 | 2.0 | 1646 | $6,500 | $3.95 | 25d | 1 | 1.03mi |
| 25248 Pelican Creek Cir #102 Bonita Springs, FL | 3.0 | 2.0 | 1458 | $7,000 | $4.80 | 25d | 1 | 1.05mi |
| 3451 Ballybridge Cir #103 Bonita Springs, FL | 3.0 | 2.0 | 1703 | $6,500 | $3.82 | 25d | 1 | 1.05mi |
| 25240 Pelican Creek Cir #202 Bonita Springs, FL | 2.0 | 2.0 | 1846 | $6,500 | $3.52 | 25d | 1 | 1.06mi |
| 25240 Pelican Creek Cir #202 Bonita Springs, FL | 2.0 | 2.0 | 1846 | $6,500 | $3.52 | 17d | 1 | 1.06mi |
| 23650 Via Veneto Blvd #1602 Estero, FL | 2.0 | 2.5 | 1818 | $8,000 | $4.40 | 25d | 1 | 1.20mi |
| 3460 Pointe Creek Ct #102 Bonita Springs, FL | 3.0 | 2.0 | 1622 | $6,800 | $4.19 | 25d | 1 | 1.29mi |
| 3461 Pointe Creek Ct #306 Bonita Springs, FL | 3.0 | 2.0 | 1650 | $3,150 | $1.91 | 25d | 1 | 1.29mi |
| 3442 Pointe Creek Ct #201 Bonita Springs, FL | 3.0 | 2.0 | 1673 | $7,000 | $4.18 | 4d | 1 | 1.35mi |
| 3431 Pointe Creek Ct Bonita Springs, FL | 2.0–3.0 | 2.0 | 1414 | $2,365 | $1.67 | 21d | 2 | 1.37mi |
| 3412 Pointe Creek Ct #102 Bonita Springs, FL | 3.0 | 2.0 | 1622 | $6,250 | $3.85 | 25d | 1 | 1.38mi |
| 8861 Colonnades Ct W #216 Bonita Springs, FL | 3.0 | 2.0 | 1207 | $2,200 | $1.82 | 25d | 1 | 1.47mi |
HOA detail
- Monthly dues
- $97 · $1,164/yr
Listing history 17 events
-
2026-06-22days on market $369,500 Active 216 DOM
-
2026-06-17days on market $369,500 Active 212 DOM
-
2026-06-16days on market $369,500 Active 211 DOM
-
2026-06-16days on market $369,500 Active 210 DOM
-
2026-06-13days on market $369,500 Active 208 DOM
-
2026-06-09days on market $369,500 Active 204 DOM
-
2026-06-07days on market $369,500 Active 202 DOM
-
2026-06-02days on market $369,500 Active 197 DOM
-
2026-06-01days on market $369,500 Active 196 DOM
-
2026-06-01days on market $369,500 Active 195 DOM
-
2025-11-17$369,500 Active
-
2025-11-01historical $3,000
-
2024-12-06$3,000
-
2024-11-12$389,000 Active
-
2022-04-15soldstatus $360,000
-
2021-05-26soldstatus $193,500
-
1997-10-10soldstatus $65,500
ⓘ Source: listings_history table (triggers on properties + properties_extension) + one-shot
backfill from property_details.listing_events for pre-trigger history.
Tax reassessment forecast FL · Resets to sale price
- Current annual tax
- $3,215 · $268/mo
- Projected year-2 tax
- $3,215 · $268/mo
- Expected delta
- $0/yr ($0/mo · 0.0%)
ⓘ Screening estimate from a state-policy table — verify with the county assessor before closing.
Climate risk First Street
- Flood 8/10 Severe FEMA zone X (shaded) · 96% chance over 30 yrs
- Wildfire 1/10 Low
- Heat 10/10 Extreme 7 d/yr ≥107°F today · 30 d/yr by 30 yrs out
- Wind 10/10 Extreme 99% chance of damaging wind over 30 yrs
- Air quality 3/10 Moderate 2 unhealthy d/yr today · 2 by 30 yrs out
Nearby sold comps map
Loading sold comps map…
Walkable amenities ~0.75 mi
Loading nearby amenities…
Taxation est. · year 1
- Rental income
- $37,305
- − Mortgage interest
- −$20,698
- − Property taxes
- −$3,215
- − Insurance
- −$2,645
- − Repairs & maintenance
- −$2,984
- − Management
- −$2,984
- − HOA
- −$1,164
- − Depreciation
- −$10,749
- Taxable loss
- −$7,135
- Est. tax savings @ 24.0%
- +$1,712
- After-tax cash flow
- $906/yr
For passive investors: Depreciation is non-cash, so a rental often shows a tax loss while cash-flowing — sheltering income. Rental losses are passive: they offset passive income freely, and up to $25,000/yr can offset ordinary (W-2) income if you actively participate and your MAGI is under $100k (phasing out to $0 by $150k); unused losses carry forward. On sale, claimed depreciation is recaptured at up to 25%, and gains may owe capital-gains tax (a 1031 exchange can defer both). Figures are a year-1 estimate at your 24.0% rate — not tax advice; consult a CPA.
Schools (NCES district)
- District
- Lee
- NCES district ID
- 1201080
- Math proficiency
- 47% ▼ -11.00%
- Reading proficiency
- 50% ▼ -4.00%
- Median HH income
- $49,518
- Composite
- 41.49/100
- National rank
- #3458
- State rank
- #42 of 73 in FL
Livability — Bonita Springs
- Score
- 70/100
- State rank
- #428
- US rank
- #7576
Category grades
Schools grade is shown separately in the Schools card above.
Census & demographics
- Census place
- Bonita Springs, FL
- County
- Lee County · 788,662 people
- City population
- 64,727
- Metro
- Cape Coral-Fort Myers, FL
- Population (ZIP)
- 16,475
- Household income
- $130,719
- Rent vs Own
- Severe rent burden
- 554.0
Population outlook (Lee County) Hauer SSP2
- Today (2025)
- 871,946 people
- By 2030
- 955,468 · +9.6%
- By 2040
- 1,113,587 · +27.7%
- By 2050
- 1,256,891 · +44.1%
- By 2075
- 1,560,270 · +78.9%
- By 2100
- 1,726,848 · +98.0%
Race, ethnicity, and origin ACS 2023
- Neighborhood character
- Predominantly White (91%)
- Race & ethnicity
- White 91% Hispanic / Latino 5% Two or more races 3% Asian 1%
- Common ancestry
- Slovak 5% Romanian 4% Serbian 2%
- Foreign-born
- 10% · Canada, Jamaica
- Languages at home
- 91% English-only · Spanish 4% German/W. Germanic 1% Other Indo-European 1%
Political lean MEDSL · Lee
- 2024 margin
- Strong R (+28.4) · D 35.5% · R 63.9%
- 2008→2024 swing
- -18.0pp toward R · 2008: -10.4pp · 2024: -28.4pp
- All cycles
- 2024: R+28.4 2020: R+19.2 2016: R+20.4 2012: R+16.6 2008: R+10.4
Not yet ingested
- Civics
- —
Market trends
- HPI YoY
- ▼ -236.48%
- Current HPI
- 237.4416
- Rent YoY
- ▲ 2.85%
- Metro
- Cape Coral-Fort Myers, FL
- State GDP YoY
- ▲ 3.28%
- F500 in state
- 36
Industry mix (Fortune 500 HQ in FL)
| Industry | F500 HQs | Revenue |
|---|---|---|
| Industrial Technology | 2 | $29B |
|
||
| Insurance | 2 | $17B |
|
||
| Retail | 1 | $60B |
|
||
| Technology Distribution | 1 | $58B |
|
||
| Homebuilding | 1 | $35B |
|
||
| Technology Manufacturing | 1 | $35B |
|
||
Price history
+464.1% since first listed7 events — show timeline
- 2025-11-17 Listed $369,500 BEARMLS
- 2025-11-01 Rental Removed $3,000 NAPLESMLS
- 2024-12-06 Listed for Rent $3,000 NAPLESMLS
- 2024-11-12 Listed $389,000 BEARMLS
- 2022-04-15 Sold (Public Records) $360,000 Public Records
- 2021-05-26 Sold (Public Records) $193,500 Public Records
- 1997-10-10 Sold (Public Records) $65,500 Public Records
Property tax history
+12.3%/yrLatest (2025): $3,215 · +10.5% YoY. Source: county tax records.
Cash-flow waterfall
monthlySold comps — $/sqft
last 12 mo · ≤1 miLoading sold comps…