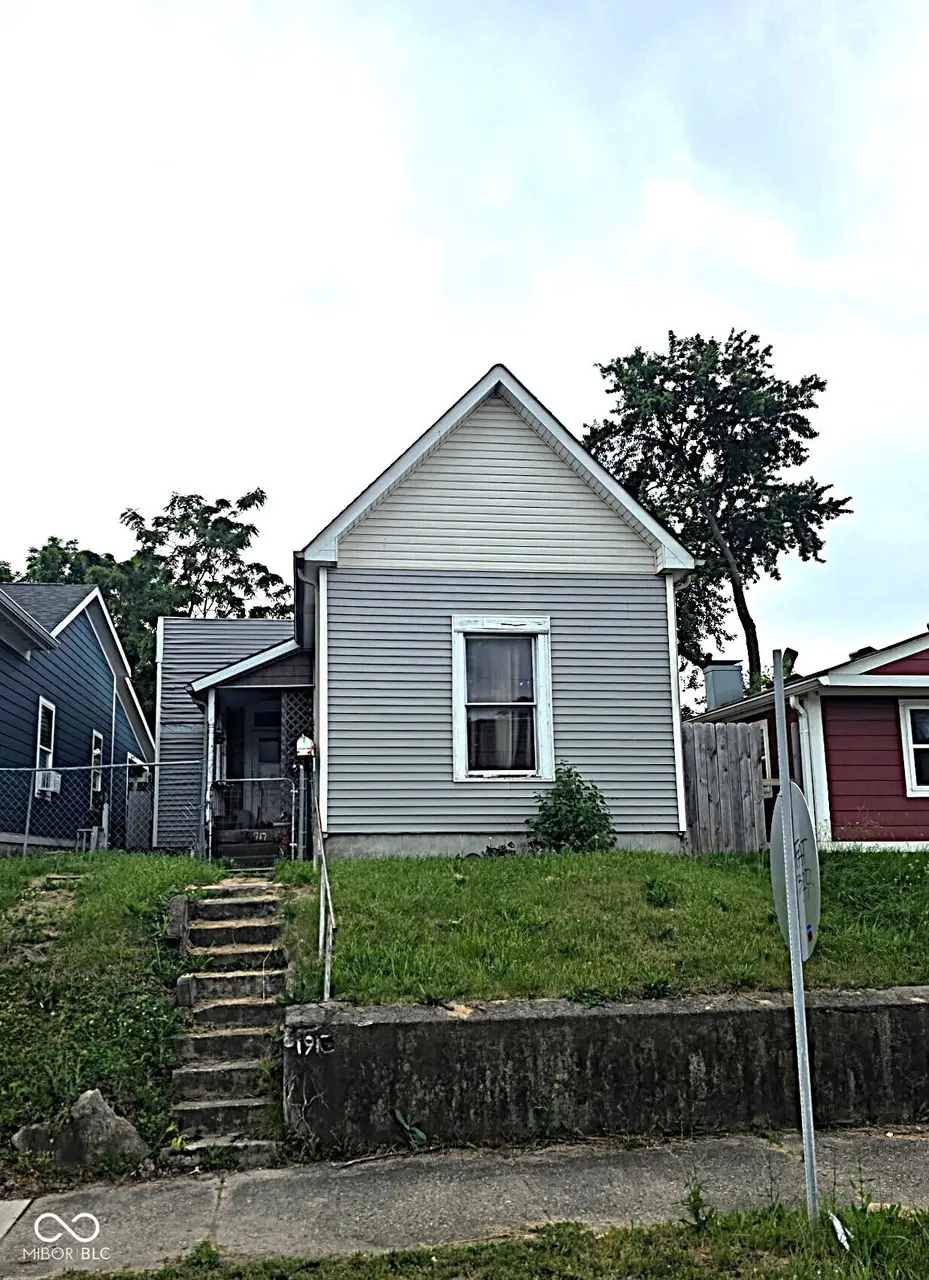
1917 W Michigan St · Indianapolis city (balance), IN
Flood risk 1/10 · Minimal
- FEMA flood zone
- X (unshaded)
- Chance of flooding over 30 yrs
- 0.0%
- Est. flood insurance / yr
- $473 – $860
Fire risk 1/10 · Minimal
- Est. fire insurance / yr
- $717 – $1,331
Heat risk 4/10 · Minor
- Hot days now (above 102°F)
- 7 days/yr
- Hot days in 30 yrs
- 19 days/yr
Wind risk 2/10 · Minimal
- Chance of severe wind over 30 yrs
- 0.0%
Air-quality risk 4/10 · Minor
- Unhealthy air days now
- 5 days/yr
- Unhealthy air days in 30 yrs
- 7 days/yr
Risk factors via First Street. Map © Google.
Why this score? — see what drove the B grade
The composite is a weighted blend of 9 inputs, each scored 0–100. Each bar is that input's sub-score; the figure is the points it added to the 100-point composite (weight × sub-score).
- Cash flow +30.0/30.0
- ARV discount +15.0/15.0
- 1% rule +10.0/10.0
- DSCR +10.0/10.0
- Rent growth +3.1/5.0
- Livability +2.5/5.0
- Condition / age +2.5/5.0
- Schools +1.4/10.0
- Appreciation +0.0/10.0
$60,000
🖨 Deal sheet (PDF) 📄 Offer letter ✓ Due diligence
Listing remarks
Sweat Equity Galore!! Come home to this 3 bedroom, 1 bath in the heart of Indy and enjoy all of the downtown amenities. With TLC, this property could be transformed into a fantastic home!!
Key facts
- 3,833 sq ft lot
- Built 1955
Property features AI
Exterior
- Utilities: Public water; Municipal sewer connected; No solid waste service listed
- Home design: Single-family residence; One level; Property listed as a fixer
- Construction: Vinyl siding; Block foundation
- Exterior features: Covered patio; Patio; Full yard fence; City lot with curbs and sidewalks; Storm sewer; Has a view
Interior
- Kitchen: No appliances included
- Bedrooms: Three bedrooms on the main level
- Bathrooms: One full bathroom (main level)
- Heating & cooling: Natural gas heating; Central air conditioning
- Interior features: Attic access; Finished basement area (partial)
- Laundry & utility: No specific laundry appliances listed
Neighborhood map
What this means for you Summary
Snapshot
- This is a 3-bed/1.0-bath single-family listed at $60k.
Deal economics
- At list price, monthly cash flow is $682 ($8k/yr) — positive.
- The deal already cash-flows at list — no discount required.
- Meets the 1% rule at list price ($1k rent vs $60k).
- Cap rate 19.9% vs local median 4.4% in Indianapolis city (balance) — top-decile yield for the area; either an underpriced asset or a hidden risk that comps aren't pricing in. Stress-test before assuming the spread holds.
Location & tenants
- Location reads: area grade B — affects rentability + tenant quality, not the cash-flow math above.
- Indianapolis Public Schools (urban): math 14% / reading 20% proficiency, ranked #286 of 301 in IN (top 95%) — low school quality limits family demand, transient renter base, plan for 1-2y turnover; 77% free/reduced lunch — lower-income household profile, screen leases tightly.
- Zoned schools: William Penn School 49 (math 9% / reading 9%, grade F, #935 of 994 statewide, top 94%, 509 students, 78% FRL); H L Harshman Middle School (math 3% / reading 16%, grade F, #316 of 330 statewide, top 96%, 549 students, 84% FRL); George Washington High School (math 2% / reading 17%, grade F, #366 of 369 statewide, top 99%, 753 students, 68% FRL) — zoned schools at 77% FRL track the district average.
- Market conditions: Rents rising (+2.5%/yr); 174 active listings in the ZIP; 25 comparable units currently listed for rent nearby; rentals at typical pace (median 16d on market — plan ~3-4 weeks tenant-placement turnaround); 1,906 units permitted in Marion County in 2024 (621 in 5+ unit buildings).
- This rent runs 33% of the median local income ($51k/yr) — at the standard rent-burdened threshold; future hikes will face affordability resistance.
Forward outlook
- Local home prices are declining (-3.0%/yr); year-one equity from $415 of loan paydown is wiped out by about $2k of value loss. Plan a longer hold.
- Marion County population projected at +18% by 2050 — long-run rental-demand tailwind backs the buy-and-hold thesis.
- At projected returns (-3.0% appreciation + 2.5% rent growth), your $17k cash investment doubles in ~3 years — after that, you're playing with house money.
Negotiation context
- Only 1 days on market — expect competitive offers; lowballing is unlikely to land.
Risks & watch-outs
- Watch-outs: built in 1955 — expect roof / HVAC / electrical / plumbing capex.
Questions for the listing agent
- Built in 1955 — when were the roof, HVAC, electrical panel, plumbing, and water heater last replaced?
- Is there a deadline driving the sale (1031 exchange, divorce, estate, relocation)? That informs how much negotiation room exists.
- What's the average days-on-market for RENTAL listings here right now (not sales)? A rising rental-DOM trend means longer vacancies and softer asking-rent achievability than the comps imply.
- What's the recent tenant-quality profile in this submarket — average credit score on applications, eviction rate, late-payment / NSF rate, and stable-employment percentage? A property-management company in the area should have these aggregated.
- How much new for-sale + rental construction is in the pipeline within 1–3 miles? Heavy new supply typically softens prices + rents 12–24 months out; constrained supply supports both.
Investment metrics
- 1% rule
- 2.31% ✓
- Cap rate
- 19.94%
- Cash-on-cash
- 48.74%
- DSCR
- 3.17
- GRM
- 3.6
CMA / ARV
- ARV (on-the-fly)
- $107,448
- Comps found
- 12
Show comp detail 12 sales within ~0.75 mi
| Address | Dist | Beds/Ba | Sqft | Sold | Price | $/sf | Match |
|---|---|---|---|---|---|---|---|
| 561 Lynn St | 0.13mi | 3/1.5 | 920 (-5%) | 5mo | $135,000 | $147 | 79 |
| 1918 Wilcox St | 0.03mi | 2/1.0 (-1) | 893 (-8%) | 2mo | $85,000 | $95 | 79 |
| 549 N Traub Ave | 0.12mi | 3/1.0 | 900 (-7%) | 13mo | $100,000 | $111 | 72 |
| 553 N Traub Ave | 0.13mi | 3/1.5 | 1,073 (+11%) | 13mo | $130,000 | $121 | 63 |
| 1014 N Sheffield Ave | 0.51mi | 3/2.0 | 952 (-2%) | 8mo | $173,000 | $182 | 63 |
| 1059 N Elder Ave | 0.54mi | 2/1.0 (-1) | 1,008 (+4%) | 2mo | $102,000 | $101 | 62 |
| 1133 N Tremont St | 0.70mi | 3/1.0 | 1,032 (+7%) | 10mo | $80,000 | $78 | 48 |
| 1143 N Elder Ave | 0.61mi | 4/1.0 (+1) | 864 (-11%) | 3mo | $77,000 | $89 | 46 |
| 1118 N Traub Ave | 0.60mi | 2/2.0 (-1) | 1,080 (+12%) | 0mo | $52,000 | $48 | 44 |
| 1049 N Tremont St N | 0.61mi | 2/1.0 (-1) | 1,084 (+12%) | 9mo | $125,000 | $115 | 39 |
| 1106 N Sheffield Ave | 0.61mi | 2/1.0 (-1) | 852 (-12%) | 10mo | $118,000 | $138 | 38 |
| 1148 N Pershing Ave | 0.70mi | 2/1.0 (-1) | 1,086 (+12%) | 8mo | $112,500 | $104 | 36 |
Match score weights: distance 35% · size 25% · config 20% · recency 20%. Top-matched comps best support the ARV.
Projected returns pro-forma
-3.0% appreciation · 2.46% rent growth · sell at horizon
- IRR
- 45.7%
- Equity multiple
- 2.96×
- Total profit
- $33,004
- Equity at exit
- $8,946
- IRR
- 51.3%
- Equity multiple
- 5.87×
- Total profit
- $81,735
- Equity at exit
- $5,188
Cash invested: $16,800 (down + closing). Projections, not guarantees.
Landlord ↔ Tenant lean methodology
- Overall (STATE)
- 90 Strongly Landlord-Friendly
- State Indiana
- 90 Strongly Landlord-Friendly · R+11
- County
- — inherits STATE
- City
- — inherits STATE
ZIP-level market 46222
- Home prices YoY
- -16.7%
- Rents YoY
- 2.5%
- Active inventory
- 174
- Price-to-rent
- 3.6×
Monthly cashflow live
- Estimated rent
- $1,389 high interval (Pro) →
- Mortgage (P&I)
- −$315
- Tax est. 1.5%
- −$75 /mo · $900/yr
- Insurance
- −$25
- HOA
- −$0
- Vacancy / Maint / Mgmt
- −$292
- Net cashflow
- $682
Break-even live
Sensitivity live
| Price | -10% $724 | -5% $703 | +0% $682 | +5% $662 | +10% $641 |
|---|---|---|---|---|---|
| Rent | -10% $573 | -5% $627 | +0% $682 | +5% $737 | +10% $792 |
| Rate | -1.0pp $713 | -0.5pp $698 | base $682 | +0.5pp $667 | +1.0pp $651 |
UW: 25.0% down · 7.5% · 30yr · 1.5% tax · 5.0% vac · 8.0% maint · 8.0% mgmt
Financing live
Cash to close
- Down payment
- $15,000
- Closing costs
- $1,800
- Reserves months
- —
- Total cash needed
- —
Loan-product check · same deal, 3 products live
Conventional
25% down · 7.5% · 30yr
- Down + closing
- —
- Monthly P&I
- —
- Monthly cashflow
- —
- DSCR
- —
- Eligible?
- —
Personal DTI + credit; lowest rate.
DSCR
20% down · 8.5% · 30yr
- Down + closing
- —
- Monthly P&I
- —
- Monthly cashflow
- —
- DSCR
- —
- Eligible?
- —
No personal income docs; deal must DSCR.
Hard money
10% down · 12.0% · 12mo
- Down + closing
- —
- Monthly P&I
- —
- Monthly cashflow
- —
- DSCR
- —
- Eligible?
- —
Short-term bridge; refi at stabilization.
Rent comps 25 comps
| Address | Beds | Baths | Sqft | Rent | $/sqft | DOM | Units | Dist |
|---|---|---|---|---|---|---|---|---|
| 1911 Wilcox St Indianapolis, IN | 2.0 | 1.0 | 896 | $1,150 | $1.28 | 45d | 1 | 0.04mi |
| 525 N Belmont Ave Indianapolis, IN | 3.0 | 1.0 | 912 | $1,225 | $1.34 | 25d | 1 | 0.13mi |
| 460 N White River Parkway Dr W Indianapolis, IN | 2.0 | 1.0 | 681 | $1,725 | $2.53 | 0d | 15 | 0.27mi |
| 210 N Richland St Indianapolis, IN | 4.0 | 2.0 | 1062 | $1,625 | $1.53 | 15d | 1 | 0.37mi |
| 264 N Holmes Ave Indianapolis, IN | 2.0 | 1.0 | 1092 | $1,200 | $1.10 | 12d | 1 | 0.63mi |
| 1150 N White River Pkwy West Dr Indianapolis, IN | 1.0–2.0 | 1.0 | 722 | $1,224 | $1.69 | 3d | 9 | 0.65mi |
| 86 N Holmes Ave Indianapolis, IN | 2.0 | 1.0 | 978 | $1,050 | $1.07 | 17d | 1 | 0.71mi |
| 101 S Harding St Apt 307 Indianapolis, IN | 2.0 | 2.0 | 970 | $1,685 | $1.74 | 4d | 1 | 0.72mi |
| 771 Haugh St Indianapolis, IN | 2.0 | 1.0 | 714 | $1,250 | $1.75 | 21d | 1 | 0.72mi |
| 240 N Warman Ave Indianapolis, IN | 2.0–3.0 | 1.0–2.0 | 1052 | $1,400 | $1.33 | 21d | 5 | 0.73mi |
| 1155 N Holmes Ave Indianapolis, IN | 3.0 | 1.0 | 952 | $2,800 | $2.94 | 4d | 1 | 0.87mi |
| 3014 W 10th St Unit 1 Indianapolis, IN | 2.0 | 1.0 | 850 | $749 | $0.88 | 25d | 1 | 0.88mi |
| 3014 W 10th St Indianapolis, IN | 2.0 | 1.0 | 850 | $749 | $0.88 | 45d | 1 | 0.88mi |
| 1510 Stadium Way Unit Stadium Flats-2203 Indianapolis, IN | 2.0 | 1.0 | 770 | $1,462 | $1.90 | 0d | 1 | 0.97mi |
| 411 N Centennial St Indianapolis, IN | 2.0 | 1.0 | 750 | $995 | $1.33 | 9d | 1 | 0.97mi |
| 1410 Breedlove Ln Indianapolis, IN | 2.0 | 1.0–2.0 | 947 | $2,557 | $2.70 | 0d | 61 | 0.99mi |
| 1409 N Warman Ave Indianapolis, IN | 2.0 | 1.0 | 816 | $1,300 | $1.59 | 21d | 1 | 1.03mi |
| 1201 Indiana Ave Indianapolis, IN | 1.0–3.0 | 1.0–3.5 | 967 | $2,404 | $2.49 | 0d | 34 | 1.10mi |
| 2701 W 17th St Indianapolis, IN | 2.0 | 1.0 | 810 | $899 | $1.11 | 9d | 1 | 1.16mi |
| 930 W 10th St Indianapolis, IN | 1.0–4.0 | 1.0–4.0 | 874 | $3,144 | $3.59 | 5d | 1 | 1.22mi |
| 735 W 11th St Indianapolis, IN | 2.0 | 1.0 | 712 | $1,398 | $1.96 | 45d | 1 | 1.29mi |
| 1228 W 18th St Indianapolis, IN | 2.0 | 1.0 | 1050 | $1,200 | $1.14 | 45d | 1 | 1.33mi |
| 841 S Addison St Indianapolis, IN | 2.0 | 1.0 | 750 | $1,295 | $1.73 | 45d | 1 | 1.40mi |
| 925 N Somerset Ave Indianapolis, IN | 3.0 | 1.0 | 1061 | $1,300 | $1.23 | 9d | 1 | 1.46mi |
| 1105 Blaine Ave Indianapolis, IN | 1.0–2.0 | 1.0–2.5 | 1157 | $1,795 | $1.55 | 25d | 1 | 1.50mi |
Listing history 3 events
-
2026-06-09status $60,000 Pending 1 DOM
-
2026-06-08remarks 189-char remark
-
2026-06-08$60,000 Active 1 DOM
ⓘ Source: listings_history table (triggers on properties + properties_extension) + one-shot
backfill from property_details.listing_events for pre-trigger history.
Climate risk First Street
- Flood 1/10 Low FEMA zone X (unshaded) · 0% chance over 30 yrs
- Wildfire 1/10 Low
- Heat 4/10 Moderate 7 d/yr ≥102°F today · 19 d/yr by 30 yrs out
- Wind 2/10 Low 0% chance of damaging wind over 30 yrs
- Air quality 4/10 Moderate 5 unhealthy d/yr today · 7 by 30 yrs out
Nearby sold comps map
Loading sold comps map…
Walkable amenities ~0.75 mi
Loading nearby amenities…
Taxation est. · year 1
- Rental income
- $16,662
- − Mortgage interest
- −$3,361
- − Property taxes
- −$900
- − Insurance
- −$300
- − Repairs & maintenance
- −$1,333
- − Management
- −$1,333
- − Depreciation
- −$1,745
- Taxable income
- $7,690
- Est. tax owed @ 24.0%
- −$1,846
- After-tax cash flow
- $6,342/yr
For passive investors: Depreciation is non-cash, so a rental often shows a tax loss while cash-flowing — sheltering income. Rental losses are passive: they offset passive income freely, and up to $25,000/yr can offset ordinary (W-2) income if you actively participate and your MAGI is under $100k (phasing out to $0 by $150k); unused losses carry forward. On sale, claimed depreciation is recaptured at up to 25%, and gains may owe capital-gains tax (a 1031 exchange can defer both). Figures are a year-1 estimate at your 24.0% rate — not tax advice; consult a CPA.
Schools (NCES district)
- District
- Indianapolis Public Schools
- NCES district ID
- 1804770
- Math proficiency
- 14% ▼ -7.00%
- Reading proficiency
- 20% ▼ -3.00%
- Median HH income
- $32,034
- Composite
- 13.69/100
- National rank
- #9499
- State rank
- #286 of 301 in IN
Livability — Indianapolis city (balance)
No livability data for this city. (Only ~50 U.S. cities are tracked.)
Census & demographics
- Census place
- Indianapolis city (balance), IN
- County
- Marion County · 998,460 people
- City population
- 881,119
- Metro
- Indianapolis-Carmel-Anderson, IN
- Population (ZIP)
- 38,887
- Household income
- $50,783
- Rent vs Own
- Severe rent burden
- 1750.0
Population outlook (Marion County) Hauer SSP2
- Today (2025)
- 1,025,572 people
- By 2030
- 1,065,727 · +3.9%
- By 2040
- 1,141,577 · +11.3%
- By 2050
- 1,208,920 · +17.9%
- By 2075
- 1,367,288 · +33.3%
- By 2100
- 1,438,201 · +40.2%
Race, ethnicity, and origin ACS 2023
- Neighborhood character
- Highly diverse neighborhood (Simpson 0.72)
- Race & ethnicity
- White 32% Black 30% Hispanic / Latino 30% Two or more races 12% Asian 2%
- Hispanic origin (detail)
- Mexican 24% Puerto Rican 1%
- Common ancestry
- Lithuanian 1% Iranian 1% Slovak 1%
- Foreign-born
- 21% · Canada, Jamaica
- Languages at home
- 67% English-only · Spanish 25% Other Indo-European 3% Arabic 2%
Political lean MEDSL · Marion
- 2024 margin
- Strong D (+27.7) · D 63.0% · R 35.3% · Other 1.7%
- 2008→2024 swing
- -0.7pp no change · 2008: 28.4pp · 2024: 27.7pp
- All cycles
- 2024: D+27.7 2020: D+29.1 2016: D+22.8 2012: D+22.2 2008: D+28.4
Not yet ingested
- Civics
- —
Market trends
- HPI YoY
- ▼ -75.47%
- Current HPI
- 375.8479
- Rent YoY
- ▲ 2.46%
- Metro
- Indianapolis-Carmel-Anderson, IN
- State GDP YoY
- ▲ 2.90%
- F500 in state
- 18
Industry mix (Fortune 500 HQ in IN)
| Industry | F500 HQs | Revenue |
|---|---|---|
| Industrial Machinery | 2 | $37B |
|
||
| Healthcare | 1 | $177B |
|
||
| Pharmaceuticals | 1 | $45B |
|
||
| Metals / Steel | 1 | $18B |
|
||
| Agriculture | 1 | $17B |
|
||
| Packaging | 1 | $12B |
|
||
Price history
1 event — show timeline
- 2026-06-08 Listed $60,000 MIBOR as Distributed by MLS Grid
Property tax history
-0.1%/yrLatest (2025): $91 · +2.0% YoY. Source: county tax records.
Cash-flow waterfall
monthlySold comps — $/sqft
last 12 mo · ≤1 miLoading sold comps…