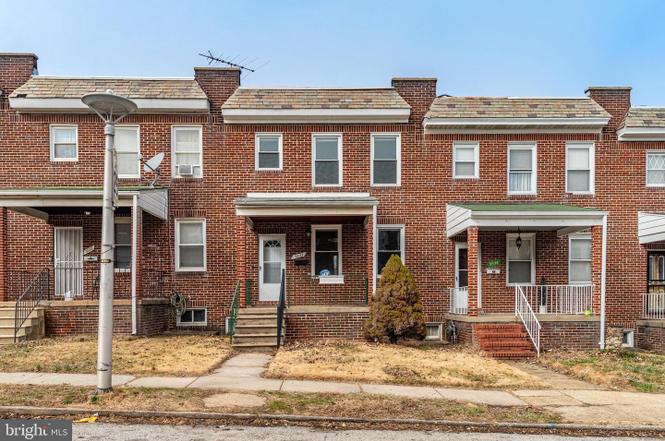
3532 Cliftmont Ave · Baltimore, MD
Flood risk 1/10 · Minimal
- FEMA flood zone
- X (unshaded)
- Chance of flooding over 30 yrs
- 0.0%
- Est. flood insurance / yr
- $473 – $860
Fire risk 1/10 · Minimal
- Est. fire insurance / yr
- $755 – $1,403
Heat risk 8/10 · Major
- Hot days now (above 103°F)
- 7 days/yr
- Hot days in 30 yrs
- 15 days/yr
Wind risk 6/10 · Moderate
- Chance of severe wind over 30 yrs
- 27.0%
Air-quality risk 4/10 · Minor
- Unhealthy air days now
- 6 days/yr
- Unhealthy air days in 30 yrs
- 7 days/yr
Risk factors via First Street. Map © Google.
Why this score? — see what drove the D+ grade
The composite is a weighted blend of 9 inputs, each scored 0–100. Each bar is that input's sub-score; the figure is the points it added to the 100-point composite (weight × sub-score).
- Cash flow +19.5/30.0
- DSCR +6.2/10.0
- 1% rule +5.1/10.0
- Appreciation +4.7/10.0
- Rent growth +3.8/5.0
- Livability +3.8/5.0
- Condition / age +2.5/5.0
- Schools +1.0/10.0
- ARV discount +0.0/15.0
$180,000
🖨 Deal sheet 📄 Offer letter ✓ Due diligence
Listing remarks
Welcome to 3532 Cliftmont Ave in Baltimore, a charming two-level brick home offering 1,200 square feet of comfortable living space. This well-maintained property features beautiful hardwood floors, a bright and spacious living area, and a separate dining space that creates a warm and inviting atmosphere for everyday living and entertaining. The home includes 3 bedrooms and 2 bathrooms, providing a functional layout with plenty of room for family, guests, or a home office. Built with durable brick construction and connected to a public water source, this property combines classic character with practical features. Conveniently designed across two levels, this home offers both comfort and pot
Key facts
- Built 1943
- Listed 44 days
Neighborhood map
What this means for you Summary
Snapshot
- This is a 3-bed/2.0-bath townhouse listed at $180k.
Deal economics
- At list price, monthly cash flow is $205 ($2k/yr) — positive.
- The deal already cash-flows at list — no discount required.
- Meets the 1% rule at list price ($2k rent vs $180k).
- Recommended offer: $175k (3.0% below list) — sets the bar for market timing.
- Cap rate 7.7% vs local median 6.0% in Baltimore — meaningfully above typical; check what's discounted (condition, days-on-market, listing class) to confirm the premium yield is real.
Location & tenants
- Location reads 76/100 on livability (#90 in MD, #3,396 nationally) — a middle-class / working-renter tenant base. Strengths: amenities A+, commute A+, housing A+; Watch: schools D, crime F.
- Baltimore City Public Schools (urban): math 7% / reading 16% proficiency, ranked #24 of 24 in MD (top 100%) — low school quality limits family demand, transient renter base, plan for 1-2y turnover; 79% free/reduced lunch — lower-income household profile, screen leases tightly.
- Market conditions: Rents rising fast (+5.2%/yr); 319 active listings in the ZIP; 40 comparable units currently listed for rent nearby; rentals at typical pace (median 24d on market — plan ~3-4 weeks tenant-placement turnaround); 40% of comp listings sitting > 30 days — soft ceiling on asking rent; 1,273 units permitted in Baltimore city in 2024 (1,104 in 5+ unit buildings).
- This rent runs 43% of the median local income ($51k/yr) — at the standard rent-burdened threshold; future hikes will face affordability resistance.
Forward outlook
- In year one you build about $222 of equity ($1k loan paydown + $-1k appreciation (-0.6% local appreciation)).
- Baltimore County population projected to shrink 4% by 2050 — rents likely to lag national; underwrite the cash flow, not the appreciation.
- At projected returns (-0.6% appreciation + 5.2% rent growth), your $50k cash investment doubles in ~8 years — after that, you're playing with house money.
Negotiation context
- It's been on market 44 days — a 3% lower offer ($175k) is reasonable based on typical stale-listing flexibility.
- 2 sale attempts with the ask held roughly flat each time — persistent listings suggest the price (not the market) is what's stuck; bring a comps-based counter.
- Current owner paid $124k; 45% above their basis — modest negotiation headroom, anchor on the comps not their cost.
Risks & watch-outs
- Watch-outs: built in 1943 — expect roof / HVAC / electrical / plumbing capex.
- Climate carrying-cost: major wind risk, 27% chance of damaging wind over 30y; extreme-heat days projected 7→15/yr by 2055 (HVAC capex compounding) — expect insurance premiums to compound above CPI over the hold.
Questions for the listing agent
- It's been on market 44 days. Have you received any prior offers? Is the seller open to a 3% concession, seller financing, or rate buy-down credit?
- Built in 1943 — when were the roof, HVAC, electrical panel, plumbing, and water heater last replaced?
- Is there a deadline driving the sale (1031 exchange, divorce, estate, relocation)? That informs how much negotiation room exists.
- Schools are D-rated, which usually means shorter tenancies and higher turnover. Who's the typical renter profile here, and what's been the actual vacancy rate?
- Crime grade is F in this area — have there been break-ins, vandalism, or insurance claims at this property in the last 3 years? What carrier currently insures it and at what premium?
- The area grade is low — what's the realistic commute time and amenity access for the typical tenant pool here? Any planned neighborhood developments (good or bad) we should know about?
- What's the average days-on-market for RENTAL listings here right now (not sales)? A rising rental-DOM trend means longer vacancies and softer asking-rent achievability than the comps imply.
- What's the recent tenant-quality profile in this submarket — average credit score on applications, eviction rate, late-payment / NSF rate, and stable-employment percentage? A property-management company in the area should have these aggregated.
- How much new for-sale + rental construction is in the pipeline within 1–3 miles? Heavy new supply typically softens prices + rents 12–24 months out; constrained supply supports both.
Investment metrics
- 1% rule
- 1.01% ✓
- Cap rate
- 7.66%
- Cash-on-cash
- 4.88%
- DSCR
- 1.22
- GRM
- 8.2
CMA / ARV
- ARV (on-the-fly)
- $120,000
- Comps found
- 12
Show comp detail 12 sales within ~0.75 mi
| Address | Dist | Beds/Ba | Sqft | Sold | Price | $/sf | Match |
|---|---|---|---|---|---|---|---|
| 4117 Eastmont Ave | 0.38mi | 3/2.0 | 1,176 (-2%) | 1mo | $224,900 | $191 | 78 |
| 3805 Elmora Ave | 0.24mi | 3/2.0 | 1,096 (-9%) | 1mo | $11,700 | $11 | 73 |
| 3555 Elmora Ave | 0.42mi | 4/2.0 (+1) | 1,178 (-2%) | 1mo | $254,000 | $216 | 72 |
| 4000 Balfern Ave | 0.32mi | 3/1.5 | 1,120 (-7%) | 1mo | $157,000 | $140 | 71 |
| 4603 Chatford Ave | 0.48mi | 3/1.5 | 1,170 (-2%) | 1mo | $205,000 | $175 | 71 |
| 3733 Ravenwood Ave | 0.30mi | 3/2.0 | 1,350 (+12%) | 1mo | $135,000 | $100 | 65 |
| 3802 Lyndale Ave | 0.17mi | 2/1.5 (-1) | 1,050 (-12%) | 1mo | $160,000 | $152 | 64 |
| 3533 Elmley Ave | 0.40mi | 3/1.5 | 1,344 (+12%) | 1mo | $70,000 | $52 | 58 |
| 3131 Chesterfield Ave | 0.30mi | 2/1.0 (-1) | 1,068 (-11%) | 1mo | $75,000 | $70 | 58 |
| 3238 Ravenwood Ave | 0.74mi | 3/1.5 | 1,158 (-4%) | 0mo | $70,000 | $60 | 57 |
| 2821 Erdman Ave | 0.66mi | 2/2.0 (-1) | 1,260 (+5%) | 0mo | $75,000 | $60 | 56 |
| 2902 Clifton Park Ter | 0.64mi | 3/1.5 | 1,344 (+12%) | 1mo | $66,000 | $49 | 48 |
Match score weights: distance 35% · size 25% · config 20% · recency 20%. Top-matched comps best support the ARV.
Projected returns pro-forma
-0.57% appreciation · 5.25% rent growth · sell at horizon
- IRR
- 3.1%
- Equity multiple
- 1.14×
- Total profit
- $7,269
- Equity at exit
- $47,212
- IRR
- 10.8%
- Equity multiple
- 2.18×
- Total profit
- $59,721
- Equity at exit
- $52,860
Cash invested: $50,400 (down + closing). Projections, not guarantees.
Landlord ↔ Tenant lean methodology
- Overall (CITY)
- 12 Strongly Tenant-Friendly
- State Maryland
- 27 Tenant-Leaning · D+14
- County
- — inherits STATE
- City Baltimore
- 12 Strongly Tenant-Friendly · D+58
ZIP-level market 21213
- Home prices YoY
- -0.1%
- Rents YoY
- 5.2%
- Active inventory
- 319
- Price-to-rent
- 8.2×
Monthly cashflow live
- Estimated rent
- $1,822 high interval (Pro) →
- Mortgage (P&I)
- −$944
- Tax from tax record
- −$216 /mo · $2,587/yr
- Insurance
- −$75
- HOA
- −$0
- Vacancy / Maint / Mgmt
- −$383
- Net cashflow
- $205
Break-even live
UW: 25.0% down · 7.5% · 30yr · 1.5% tax · 5.0% vac · 8.0% maint · 8.0% mgmt
Financing live
Cash to close
- Down payment
- $45,000
- Closing costs
- $5,400
- Reserves months
- —
- Total cash needed
- —
Loan-product check · same deal, 3 products live
Conventional
25% down · 7.5% · 30yr
- Down + closing
- —
- Monthly P&I
- —
- Monthly cashflow
- —
- DSCR
- —
- Eligible?
- —
Personal DTI + credit; lowest rate.
DSCR
20% down · 8.5% · 30yr
- Down + closing
- —
- Monthly P&I
- —
- Monthly cashflow
- —
- DSCR
- —
- Eligible?
- —
No personal income docs; deal must DSCR.
Hard money
10% down · 12.0% · 12mo
- Down + closing
- —
- Monthly P&I
- —
- Monthly cashflow
- —
- DSCR
- —
- Eligible?
- —
Short-term bridge; refi at stabilization.
Rent comps 40 comps
| Address | Beds | Baths | Sqft | Rent | $/sqft | DOM | Units | Dist |
|---|---|---|---|---|---|---|---|---|
| 3544 Chesterfield Ave Baltimore, MD | 3.0 | 1.5 | 1200 | $1,635 | $1.36 | 43d | 1 | 0.07mi |
| 3566 Dudley Ave Baltimore, MD | 2.0 | 1.0 | 896 | $1,800 | $2.01 | 23d | 1 | 0.19mi |
| 3305 Dudley Ave Baltimore, MD | 3.0 | 2.0 | 1413 | $1,950 | $1.38 | 43d | 1 | 0.22mi |
| 3573 Shannon Dr Baltimore, MD | 4.0 | 2.0 | 1493 | $2,300 | $1.54 | 17d | 1 | 0.22mi |
| 3551 Shannon Dr Baltimore, MD | 3.0 | 2.0 | 1485 | $2,358 | $1.59 | 23d | 1 | 0.22mi |
| 3646 Lyndale Ave Baltimore, MD | 2.0 | 1.5 | 840 | $1,475 | $1.76 | 43d | 1 | 0.25mi |
| 3610 Elmley Ave Baltimore, MD | 2.0 | 1.5 | 1200 | $1,550 | $1.29 | 20d | 1 | 0.27mi |
| 3028 Kenyon Ave Baltimore, MD | 2.0 | 2.0 | 1075 | $1,395 | $1.30 | 43d | 1 | 0.36mi |
| 3902 Erdman Ave Unit 1 Baltimore, MD | 2.0 | 1.0 | 1000 | $1,275 | $1.27 | 23d | 1 | 0.39mi |
| 3914 Erdman Ave #1 Baltimore, MD | 3.0 | 1.0 | 1200 | $1,319 | $1.10 | 17d | 1 | 0.40mi |
| 4022 Ardley Ave Baltimore, MD | 2.0 | 1.0 | 896 | $1,750 | $1.95 | 43d | 1 | 0.44mi |
| 4116 Raymonn Ave Baltimore, MD | 3.0 | 1.5 | 1244 | $1,950 | $1.57 | 43d | 1 | 0.46mi |
| 3512 Elmora Ave Baltimore, MD | 3.0 | 1.5 | 1472 | $1,900 | $1.29 | 20d | 1 | 0.46mi |
| 2848 Pelham Ave Baltimore, MD | 3.0 | 2.0 | 1164 | $1,700 | $1.46 | 43d | 1 | 0.48mi |
| 2837 Pelham Ave Baltimore, MD | 4.0 | 2.0 | 1164 | $1,675 | $1.44 | 43d | 1 | 0.49mi |
| 4320 Sheldon Ave Baltimore, MD | 3.0 | 1.5 | 1280 | $1,800 | $1.41 | 23d | 1 | 0.51mi |
| 2828 Lake Ave Baltimore, MD | 3.0 | 2.0 | 1164 | $1,850 | $1.59 | 4d | 1 | 0.51mi |
| 2817 Pelham Ave Baltimore, MD | 3.0 | 2.0 | 1464 | $1,950 | $1.33 | 23d | 1 | 0.52mi |
| 3436 Cardenas Ave Baltimore, MD | 2.0 | 1.0 | 1146 | $1,395 | $1.22 | 43d | 1 | 0.57mi |
| 4300 Orchard Ridge Blvd Baltimore, MD | 1.0–3.0 | 1.0–2.0 | 1021 | $1,809 | $1.77 | 43d | 1 | 0.59mi |
| 3515 Parklawn Ave Baltimore, MD | 3.0 | 2.0 | 1240 | $1,700 | $1.37 | 2d | 1 | 0.61mi |
| 4400 Asbury Ave Baltimore, MD | 3.0 | 2.0 | 1270 | $1,995 | $1.57 | 4d | 1 | 0.62mi |
| 3335 Lyndale Ave Baltimore, MD | 2.0 | 2.0 | 1344 | $1,600 | $1.19 | 23d | 1 | 0.65mi |
| 3339 Elmora Ave Baltimore, MD | 3.0 | 2.0 | 896 | $1,600 | $1.79 | 43d | 1 | 0.66mi |
| 3326 Elmora Ave Baltimore, MD | 3.0 | 1.0 | 1200 | $1,450 | $1.21 | 23d | 1 | 0.67mi |
| 3317 Lyndale Ave Baltimore, MD | 3.0 | 1.0 | 900 | $1,300 | $1.44 | 43d | 1 | 0.67mi |
| 3343 Ravenwood Ave Unit 3343 Baltimore, MD | 2.0 | 2.0 | 948 | $1,855 | $1.96 | 17d | 1 | 0.67mi |
| 3315 Lyndale Ave Baltimore, MD | 2.0 | 1.5 | 896 | $1,650 | $1.84 | 17d | 1 | 0.67mi |
| 4409 Moravia Rd Baltimore, MD | 2.0 | 1.0 | 861 | $1,385 | $1.61 | 43d | 3 | 0.68mi |
| 3322 Ravenwood Ave Baltimore, MD | 3.0 | 2.0 | 932 | $1,800 | $1.93 | 23d | 1 | 0.69mi |
| 4024 Eierman Ave Baltimore, MD | 3.0 | 2.0 | 1136 | $1,825 | $1.61 | 43d | 1 | 0.70mi |
| 3222 Lyndale Ave Unit 1 Baltimore, MD | 3.0 | 1.5 | 1500 | $2,200 | $1.47 | 12d | 1 | 0.72mi |
| 3218 Lyndale Ave Baltimore, MD | 3.0 | 1.5 | 1020 | $1,500 | $1.47 | 23d | 1 | 0.73mi |
| 3221 Lyndale Ave Baltimore, MD | 2.0 | 2.0 | 1020 | $1,700 | $1.67 | 23d | 1 | 0.73mi |
| 3213 Elmley Ave Baltimore, MD | 2.0 | 1.0 | 1188 | $1,395 | $1.17 | 43d | 1 | 0.73mi |
| 2113 Belair Rd Baltimore, MD | 3.0 | 1.0 | 1344 | $1,795 | $1.34 | 43d | 1 | 0.82mi |
| 5305 Moravia Rd Baltimore, MD | 3.0 | 1.0 | 679 | $1,993 | $2.93 | 2d | 1 | 0.88mi |
| 4901 Gunther Ave Baltimore, MD | 1.0–3.0 | 1.0–2.0 | 742 | $1,463 | $1.97 | 2d | 1 | 0.88mi |
| 5731 Denwood Ave Baltimore, MD | 3.0 | 1.5 | 1152 | $1,700 | $1.48 | 21d | 1 | 0.93mi |
| 5731 Denwood Ave Baltimore, MD | 3.0 | 1.5 | 1440 | $1,700 | $1.18 | 23d | 1 | 0.93mi |
Listing history 8 events
-
2026-04-21status Pending
-
2026-03-07$180,000 Active
-
2026-02-28historical $180,000
-
2025-12-01historical
-
2025-08-18$185,000 Active
-
2023-11-29soldstatus $124,000
-
1986-06-12soldstatus $46,000
-
1981-01-19soldstatus $35,000
ⓘ Source: listings_history table (triggers on properties + properties_extension) + one-shot
backfill from property_details.listing_events for pre-trigger history.
Tax reassessment forecast MD · Partial reset (capped growth)
- Current annual tax
- $2,587 · $216/mo
- Projected year-2 tax
- $2,587 · $216/mo
- Expected delta
- $0/yr ($0/mo · 0.0%)
ⓘ Screening estimate from a state-policy table — verify with the county assessor before closing.
Climate risk First Street
- Flood 1/10 Low FEMA zone X (unshaded) · 0% chance over 30 yrs
- Wildfire 1/10 Low
- Heat 8/10 Severe 7 d/yr ≥103°F today · 15 d/yr by 30 yrs out
- Wind 6/10 Major 27% chance of damaging wind over 30 yrs
- Air quality 4/10 Moderate 6 unhealthy d/yr today · 7 by 30 yrs out
Nearby sold comps map
Loading sold comps map…
Walkable amenities ~0.75 mi
Loading nearby amenities…
Taxation est. · year 1
- Rental income
- $21,864
- − Mortgage interest
- −$10,083
- − Property taxes
- −$2,587
- − Insurance
- −$900
- − Repairs & maintenance
- −$1,749
- − Management
- −$1,749
- − Depreciation
- −$5,236
- Taxable loss
- −$441
- Est. tax savings @ 24.0%
- +$106
- After-tax cash flow
- $2,564/yr
For passive investors: Depreciation is non-cash, so a rental often shows a tax loss while cash-flowing — sheltering income. Rental losses are passive: they offset passive income freely, and up to $25,000/yr can offset ordinary (W-2) income if you actively participate and your MAGI is under $100k (phasing out to $0 by $150k); unused losses carry forward. On sale, claimed depreciation is recaptured at up to 25%, and gains may owe capital-gains tax (a 1031 exchange can defer both). Figures are a year-1 estimate at your 24.0% rate — not tax advice; consult a CPA.
Schools (NCES district)
- District
- Baltimore City Public Schools
- NCES district ID
- 2400090
- Math proficiency
- 7% ▼ -9.00%
- Reading proficiency
- 16% ▼ -5.00%
- Median HH income
- $42,108
- Composite
- 10.08/100
- National rank
- #9805
- State rank
- #24 of 24 in MD
Livability — Baltimore
- Score
- 76/100
- State rank
- #90
- US rank
- #3396
Category grades
Schools grade is shown separately in the Schools card above.
Census & demographics
- Census place
- Baltimore, MD
- County
- Baltimore City · 558,601 people
- City population
- 588,727
- Metro
- Baltimore-Columbia-Towson, MD
- Population (ZIP)
- 28,058
- Household income
- $51,344
- Rent vs Own
- Severe rent burden
- 1868.0
Population outlook (Baltimore County) Hauer SSP2
- Today (2025)
- 624,249 people
- By 2030
- 621,541 · -0.4%
- By 2040
- 609,756 · -2.3%
- By 2050
- 597,249 · -4.3%
- By 2075
- 552,236 · -11.5%
- By 2100
- 513,934 · -17.7%
Race, ethnicity, and origin ACS 2023
- Neighborhood character
- Predominantly Black (86%)
- Race & ethnicity
- Black 86% White 6% Hispanic / Latino 4% Two or more races 3%
- Foreign-born
- 3% · Canada
- Languages at home
- 96% English-only · Spanish 3%
Political lean MEDSL · Baltimore
- 2024 margin
- Solid D (+73.0) · D 85.2% · R 12.2% · Other 2.6%
- 2008→2024 swing
- -2.5pp toward R · 2008: 75.5pp · 2024: 73.0pp
- All cycles
- 2024: D+73.0 2020: D+76.6 2016: D+74.6 2012: D+76.4 2008: D+75.5
Not yet ingested
- Civics
- —
Market trends
- HPI YoY
- ▼ -0.57%
- Current HPI
- 427.4453
- Rent YoY
- ▲ 5.25%
- Metro
- Baltimore-Columbia-Towson, MD
- State GDP YoY
- ▲ 2.97%
- F500 in state
- 12
Industry mix (Fortune 500 HQ in MD)
| Industry | F500 HQs | Revenue |
|---|---|---|
| Aerospace / Defense | 1 | $71B |
|
||
| Utilities | 1 | $25B |
|
||
| Hotels | 1 | $24B |
|
||
| Consumer Goods | 1 | $7B |
|
||
| Real Estate | 1 | $6B |
|
||
| Chemicals | 1 | $2B |
|
||
Price history
+414.3% since first listed8 events — show timeline
- 2026-04-21 Pending — BRIGHT MLS
- 2026-03-07 Listed $180,000 BRIGHT MLS
- 2026-02-28 Coming Soon $180,000 BRIGHT MLS
- 2025-12-01 Listing Removed — BRIGHT MLS
- 2025-08-18 Listed $185,000 BRIGHT MLS
- 2023-11-29 Sold (Public Records) $124,000 Public Records
- 1986-06-12 Sold (Public Records) $46,000 Public Records
- 1981-01-19 Sold (Public Records) $35,000 Public Records
Property tax history
+0.1%/yrLatest (2025): $2,587 · +8.9% YoY. Source: county tax records.
Cash-flow waterfall
monthlySold comps — $/sqft
last 12 mo · ≤1 miLoading sold comps…