4235 Live Oak Ln · Houston, TX
Flood risk 1/10 · Minimal
- FEMA flood zone
- X (unshaded)
- Chance of flooding over 30 yrs
- 0.0%
- Est. flood insurance / yr
- $507 – $1,088
Fire risk 4/10 · Minor
- Est. fire insurance / yr
- $1,222 – $2,270
Heat risk 8/10 · Major
- Hot days now (above 110°F)
- 7 days/yr
- Hot days in 30 yrs
- 21 days/yr
Wind risk 8/10 · Major
- Chance of severe wind over 30 yrs
- 99.0%
Air-quality risk 3/10 · Minor
- Unhealthy air days now
- 3 days/yr
- Unhealthy air days in 30 yrs
- 3 days/yr
Risk factors via First Street. Map © Google.
Why this score? — see what drove the D+ grade
The composite is a weighted blend of 9 inputs, each scored 0–100. Each bar is that input's sub-score; the figure is the points it added to the 100-point composite (weight × sub-score).
- Cash flow +15.0/30.0
- ARV discount +7.5/15.0
- 1% rule +5.0/10.0
- DSCR +5.0/10.0
- Schools +4.1/10.0
- Livability +3.7/5.0
- Rent growth +3.0/5.0
- Condition / age +2.8/5.0
- Appreciation +0.0/10.0
$35,000
🖨 Deal sheet 📄 Offer letter ✓ Due diligence
Listing remarks
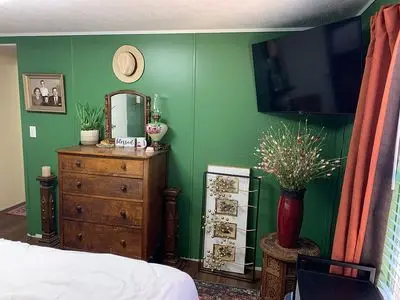
Two bedroom, one bath mobile home. It has new paint, laminate flooring, all new light fixtures, ceiling fans, new vanity and a an A/C unit that has a transferrable warranty. Great outdoor space that has a little fence on each end so is great for a small dog to be able to sit outside. A porch and small deck as well as a two car carport. It is in a mobile home community so there is a $720 a month lot rent but that does include trash and water so just pay your electricity. It is a very economical mobile home and is in a great location within the park.
Key facts
- Laminate flooring
- New vanity
- A/c unit
Tags
Neighborhood map
What this means for you Summary
Snapshot
- This is a 2-bed/1.0-bath other listed at $35k. Condition is rated average.
Deal economics
- At list price, monthly cash flow is $992 ($12k/yr) — positive.
- The deal already cash-flows at list — no discount required.
- Meets the 1% rule at list price ($2k rent vs $35k).
- Recommended offer: $34k (3.0% below list) — sets the bar for market timing.
- Cap rate 40.3% vs local median 3.2% in Houston — top-decile yield for the area; either an underpriced asset or a hidden risk that comps aren't pricing in. Stress-test before assuming the spread holds.
Location & tenants
- Location reads 74/100 on livability (#184 in TX, #4,771 nationally) — a middle-class / working-renter tenant base. Strengths: amenities A+, cost of living A+, housing A+; Watch: schools D, crime F.
- Klein ISD (suburban): math 41% / reading 48% proficiency, ranked #213 of 826 in TX (top 26%) — families likely to look elsewhere, expect single-tenant / working-renter base with shorter leases.
- Market conditions: Rents rising (+1.9%/yr); 383 active listings in the ZIP; 16 comparable units currently listed for rent nearby; rentals leasing fast (median 13d on market — plan ~1-2 weeks tenant-placement turnaround); high-income renter base; 29,883 units permitted in Harris County in 2024 (8,621 in 5+ unit buildings).
- This rent is only 13% of the median local income ($141k/yr) — well below the 30% rent-burden line; pricing power to push rent on renewal without tenant pushback.
Forward outlook
- Local home prices are declining (-3.0%/yr); year-one equity from $242 of loan paydown is wiped out by about $1k of value loss. Plan a longer hold.
- Harris County population projected at +47% by 2050 — long-run rental-demand tailwind backs the buy-and-hold thesis.
- At projected returns (-3.0% appreciation + 1.9% rent growth), your $10k cash investment doubles in ~1 year — after that, you're playing with house money.
Negotiation context
- It's been on market 37 days — a 3% lower offer ($34k) is reasonable based on typical stale-listing flexibility.
Risks & watch-outs
- Climate carrying-cost: severe wind risk, 99% chance of damaging wind over 30y; extreme-heat days projected 7→21/yr by 2055 (HVAC capex compounding) — expect insurance premiums to compound above CPI over the hold.
Questions for the listing agent
- It's been on market 37 days. Have you received any prior offers? Is the seller open to a 3% concession, seller financing, or rate buy-down credit?
- Is there a deadline driving the sale (1031 exchange, divorce, estate, relocation)? That informs how much negotiation room exists.
- Schools are D-rated, which usually means shorter tenancies and higher turnover. Who's the typical renter profile here, and what's been the actual vacancy rate?
- Crime grade is F in this area — have there been break-ins, vandalism, or insurance claims at this property in the last 3 years? What carrier currently insures it and at what premium?
- The area grade is low — what's the realistic commute time and amenity access for the typical tenant pool here? Any planned neighborhood developments (good or bad) we should know about?
- What's the average days-on-market for RENTAL listings here right now (not sales)? A rising rental-DOM trend means longer vacancies and softer asking-rent achievability than the comps imply.
- What's the recent tenant-quality profile in this submarket — average credit score on applications, eviction rate, late-payment / NSF rate, and stable-employment percentage? A property-management company in the area should have these aggregated.
- How much new for-sale + rental construction is in the pipeline within 1–3 miles? Heavy new supply typically softens prices + rents 12–24 months out; constrained supply supports both.
Investment metrics
- 1% rule
- 4.46% ✓
- Cap rate
- 40.30%
- Cash-on-cash
- 121.45%
- DSCR
- 6.40
- GRM
- 1.9
CMA / ARV
No comps found within radius.
Projected returns pro-forma
-3.0% appreciation · 1.94% rent growth · sell at horizon
- IRR
- —
- Equity multiple
- 6.70×
- Total profit
- $55,875
- Equity at exit
- $5,219
- IRR
- —
- Equity multiple
- 13.60×
- Total profit
- $123,473
- Equity at exit
- $3,026
Cash invested: $9,800 (down + closing). Projections, not guarantees.
Landlord ↔ Tenant lean methodology
- Overall (STATE)
- 87 Strongly Landlord-Friendly
- State Texas
- 87 Strongly Landlord-Friendly · R+5
- County
- — inherits STATE
- City
- — inherits STATE
ZIP-level market 77389
- Rents YoY
- 1.9%
- Active inventory
- 383
- Price-to-rent
- 1.9×
Monthly cashflow live
- Estimated rent
- $1,562 high interval (Pro) →
- Mortgage (P&I)
- −$184
- Tax est. 1.5%
- −$44 /mo · $525/yr
- Insurance
- −$15
- HOA
- −$0
- Vacancy / Maint / Mgmt
- −$328
- Net cashflow
- $992
Break-even live
UW: 25.0% down · 7.5% · 30yr · 1.5% tax · 5.0% vac · 8.0% maint · 8.0% mgmt
Financing live
Cash to close
- Down payment
- $8,750
- Closing costs
- $1,050
- Reserves months
- —
- Total cash needed
- —
Loan-product check · same deal, 3 products live
Conventional
25% down · 7.5% · 30yr
- Down + closing
- —
- Monthly P&I
- —
- Monthly cashflow
- —
- DSCR
- —
- Eligible?
- —
Personal DTI + credit; lowest rate.
DSCR
20% down · 8.5% · 30yr
- Down + closing
- —
- Monthly P&I
- —
- Monthly cashflow
- —
- DSCR
- —
- Eligible?
- —
No personal income docs; deal must DSCR.
Hard money
10% down · 12.0% · 12mo
- Down + closing
- —
- Monthly P&I
- —
- Monthly cashflow
- —
- DSCR
- —
- Eligible?
- —
Short-term bridge; refi at stabilization.
Rent comps 16 comps
| Address | Beds | Baths | Sqft | Rent | $/sqft | DOM | Units | Dist |
|---|---|---|---|---|---|---|---|---|
| 4206 Pine Ln Spring, TX | 2.0 | 2.0 | 700 | $1,430 | $2.04 | 4d | 1 | 0.06mi |
| 4209 Spring Stuebner Rd Unit 324 Spring, TX | 1.0 | 1.0 | 695 | $1,473 | $2.12 | 8d | 1 | 0.34mi |
| 4209 Spring Stuebner Rd Unit 4224 Spring, TX | 1.0 | 1.0 | 813 | $1,372 | $1.69 | 15d | 1 | 0.34mi |
| 4209 Spring Stuebner Rd Unit 1228 Spring, TX | 1.0 | 1.0 | 695 | $1,470 | $2.12 | 3d | 1 | 0.34mi |
| 4209 Spring Stuebner Rd Unit 4224 Spring, TX | 1.0 | 1.0 | 695 | $1,512 | $2.18 | 11d | 1 | 0.34mi |
| 4184 Falvel Shadow Creek Dr Spring, TX | 1.0 | 1.0 | 813 | $1,360 | $1.67 | 44d | 1 | 0.50mi |
| 3609 Spring Stuebner Rd Spring, TX | 1.0 | 1.0 | 661 | $1,210 | $1.83 | 24d | 1 | 0.73mi |
| 4114 Farm to Market 2920 Spring, TX | 1.0–2.0 | 1.0–2.0 | 964 | $2,146 | $2.22 | 2d | 24 | 1.03mi |
| 3880 Farm to Market 2920 Spring, TX | 1.0–3.0 | 1.0–2.0 | 1037 | $1,996 | $1.93 | 2d | 29 | 1.06mi |
| 3869 Farm to Market 2920 Unit 2920 Spring, TX | 1.0 | 2.0 | 679 | $1,340 | $1.97 | 44d | 1 | 1.16mi |
| 3869 Farm to Market 2920 Unit 2920 Spring, TX | 2.0 | 2.0 | 1056 | $1,774 | $1.68 | 24d | 1 | 1.16mi |
| 5251 Farm to Market 2920 Spring, TX | 1.0 | 1.0 | 664 | $1,030 | $1.55 | 13d | 1 | 1.37mi |
| 21901 Gosling Rd Spring, TX | 1.0–2.0 | 1.0–2.0 | 976 | $2,985 | $3.06 | 2d | 39 | 1.39mi |
| 22103 Gosling Rd Spring, TX | 1.0–2.0 | 1.0–2.0 | 954 | $1,800 | $1.89 | 3d | 29 | 1.40mi |
| 21901 Gosling Rd Unit 21938 Spring, TX | 2.0 | 2.0 | 1026 | $2,368 | $2.31 | 21d | 1 | 1.41mi |
| 5498 Farm to Market 2920 Unit 2920 Spring, TX | 2.0 | 2.0 | 975 | $1,419 | $1.46 | 24d | 1 | 1.45mi |
Listing history 14 events
-
2026-06-18days on market $35,000 Active 37 DOM
-
2026-06-17days on market $35,000 Active 36 DOM
-
2026-06-16days on market $35,000 Active 35 DOM
-
2026-06-15days on market $35,000 Active 34 DOM
-
2026-06-13days on market $35,000 Active 32 DOM
-
2026-06-09days on market $35,000 Active 28 DOM
-
2026-06-08days on market $35,000 Active 27 DOM
-
2026-06-07days on market $35,000 Active 26 DOM
-
2026-06-04days on market $35,000 Active 23 DOM
-
2026-06-03days on market $35,000 Active 22 DOM
-
2026-06-02days on market $35,000 Active 21 DOM
-
2026-06-01days on market $35,000 Active 20 DOM
-
2026-05-31days on market $35,000 Active 19 DOM
-
2026-05-12$35,000 Active 554-char remark
ⓘ Source: listings_history table (triggers on properties + properties_extension) + one-shot
backfill from property_details.listing_events for pre-trigger history.
Climate risk First Street
- Flood 1/10 Low FEMA zone X (unshaded) · 0% chance over 30 yrs
- Wildfire 4/10 Moderate
- Heat 8/10 Severe 7 d/yr ≥110°F today · 21 d/yr by 30 yrs out
- Wind 8/10 Severe 99% chance of damaging wind over 30 yrs
- Air quality 3/10 Moderate 3 unhealthy d/yr today · 3 by 30 yrs out
Nearby sold comps map
Loading sold comps map…
Walkable amenities ~0.75 mi
Loading nearby amenities…
Taxation est. · year 1
- Rental income
- $18,740
- − Mortgage interest
- −$1,961
- − Property taxes
- −$525
- − Insurance
- −$175
- − Repairs & maintenance
- −$1,499
- − Management
- −$1,499
- − Depreciation
- −$1,018
- Taxable income
- $12,063
- Est. tax owed @ 24.0%
- −$2,895
- After-tax cash flow
- $9,007/yr
For passive investors: Depreciation is non-cash, so a rental often shows a tax loss while cash-flowing — sheltering income. Rental losses are passive: they offset passive income freely, and up to $25,000/yr can offset ordinary (W-2) income if you actively participate and your MAGI is under $100k (phasing out to $0 by $150k); unused losses carry forward. On sale, claimed depreciation is recaptured at up to 25%, and gains may owe capital-gains tax (a 1031 exchange can defer both). Figures are a year-1 estimate at your 24.0% rate — not tax advice; consult a CPA.
Condition & rehab AI · 1 photo
This mobile home has average interior walls and laminate flooring, with minor repairs needed. It has a new A/C unit and is in a mobile home community with a great location.
Repairs flagged
- Minor wallpaper — Peeling wallpaper on the walls
- Minor light fixtures — Older style light fixtures
Value-add opportunities
- Both new paint — Fresh paint can improve both resale and rental value
- Both new light fixtures — Modern light fixtures can enhance curb appeal and functionality
- Both new flooring — New laminate flooring can significantly boost both resale and rental value
Renovation cost estimate screening
| Repair item | Severity | Est. cost |
|---|---|---|
| wallpaper · Peeling wallpaper on the walls | Minor | $500–3,000 |
| light fixtures · Older style light fixtures | Minor | $500–3,000 |
| Total estimated repair cost · 2 items | $1,000–6,000 |
Value-add ROI direction
- Both new paint — Fresh paint can improve both resale and rental value ↑
- Both new light fixtures — Modern light fixtures can enhance curb appeal and functionality ↑
- Both new flooring — New laminate flooring can significantly boost both resale and rental value ↑
ⓘ Cost ranges are severity-bucket heuristics (US national rule-of-thumb). Get contractor quotes + a written scope before underwriting a rehab budget.
Schools (NCES district)
- District
- Klein ISD
- NCES district ID
- 4825740
- Math proficiency
- 41% ▼ -12.00%
- Reading proficiency
- 48% ▼ -3.00%
- Median HH income
- $78,288
- Composite
- 40.91/100
- National rank
- #3615
- State rank
- #213 of 826 in TX
Livability — Houston
- Score
- 74/100
- State rank
- #184
- US rank
- #4771
Category grades
Schools grade is shown separately in the Schools card above.
Census & demographics
- County
- Harris County · 4,702,590 people
- City population
- 3,226,434
- Metro
- Houston-The Woodlands-Sugar Land, TX
- Population (ZIP)
- 45,701
- Household income
- $140,683
- Rent vs Own
- Severe rent burden
- 1191.0
Population outlook (Harris County) Hauer SSP2
- Today (2025)
- 5,571,493 people
- By 2030
- 6,089,821 · +9.3%
- By 2040
- 7,142,806 · +28.2%
- By 2050
- 8,185,864 · +46.9%
- By 2075
- 10,574,329 · +89.8%
- By 2100
- 12,109,958 · +117.4%
Race, ethnicity, and origin ACS 2023
- Neighborhood character
- Diverse neighborhood (Simpson 0.62)
- Race & ethnicity
- White 53% Hispanic / Latino 30% Two or more races 15% Black 7% Asian 6%
- Hispanic origin (detail)
- Mexican 19%
- Common ancestry
- Lithuanian 3% Romanian 2% Italian 2%
- Foreign-born
- 22% · Canada, Jamaica, China
- Languages at home
- 69% English-only · Spanish 21% Other Indo-European 4% Russian/Polish/Slavic 1%
Political lean MEDSL · Harris
- 2024 margin
- Lean D (+5.5) · D 52.0% · R 46.4% · Other 1.6%
- 2008→2024 swing
- +3.9pp toward D · 2008: 1.6pp · 2024: 5.5pp
- All cycles
- 2024: D+5.5 2020: D+13.3 2016: D+12.4 2012: D+0.1 2008: D+1.6
Not yet ingested
- Civics
- —
Market trends
- HPI YoY
- ▼ -159.54%
- Current HPI
- 236.5688
- Rent YoY
- ▲ 1.94%
- Metro
- Houston-The Woodlands-Sugar Land, TX
- State GDP YoY
- ▲ 3.95%
- F500 in state
- 110
Industry mix (Fortune 500 HQ in TX)
| Industry | F500 HQs | Revenue |
|---|---|---|
| Energy | 16 | $1,198B |
|
||
| Technology | 5 | $198B |
|
||
| Engineering / Construction | 4 | $72B |
|
||
| Energy Services | 3 | $60B |
|
||
| Utilities | 3 | $41B |
|
||
| Healthcare | 2 | $330B |
|
||
Price history
1 event — show timeline
- 2026-05-12 Listed $35,000 FSBO.com
Cash-flow waterfall
monthlySold comps — $/sqft
last 12 mo · ≤1 miLoading sold comps…