 Fourplex
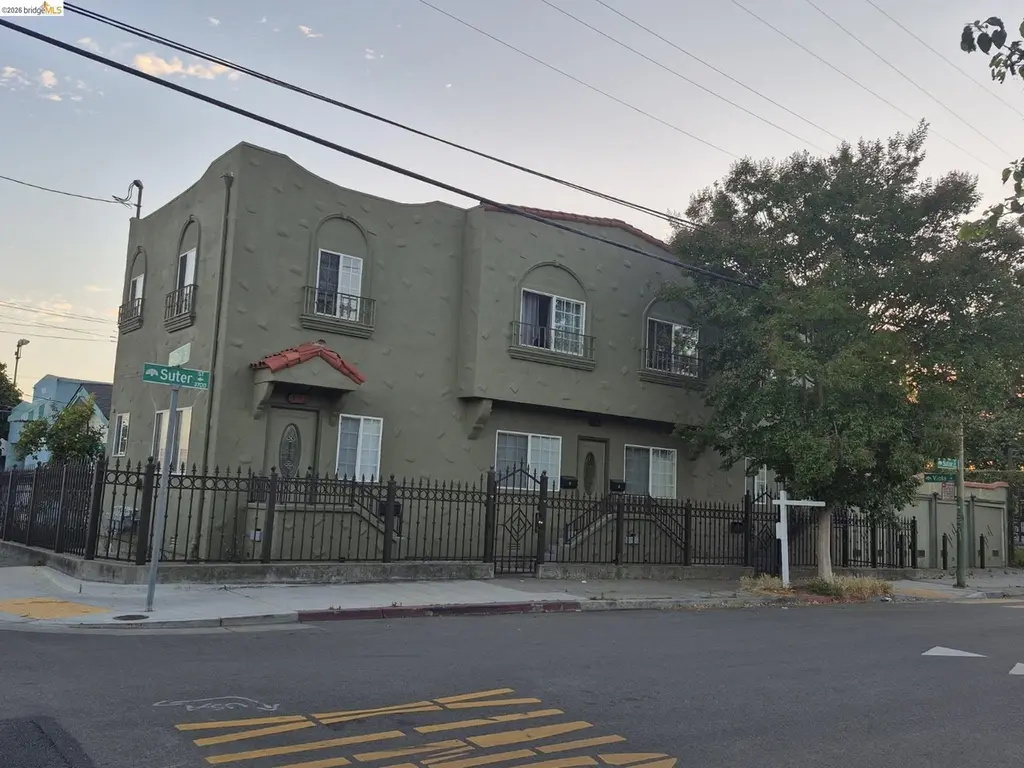
3743 Suter St · Oakland, CA
Flood risk 1/10 · Minimal
- FEMA flood zone
- X (unshaded)
- Chance of flooding over 30 yrs
- 0.0%
- Est. flood insurance / yr
- $507 – $1,088
Fire risk 1/10 · Minimal
- Est. fire insurance / yr
- $659 – $1,223
Heat risk 3/10 · Minor
- Hot days now (above 84°F)
- 7 days/yr
- Hot days in 30 yrs
- 15 days/yr
Wind risk 1/10 · Minimal
- Chance of severe wind over 30 yrs
- —
Air-quality risk 8/10 · Major
- Unhealthy air days now
- 14 days/yr
- Unhealthy air days in 30 yrs
- 14 days/yr
Risk factors via First Street. Map © Google.
Why this score? — see what drove the C grade
The composite is a weighted blend of 9 inputs, each scored 0–100. Each bar is that input's sub-score; the figure is the points it added to the 100-point composite (weight × sub-score).
- Cash flow +25.5/30.0
- DSCR +8.5/10.0
- 1% rule +7.3/10.0
- Livability +3.6/5.0
- ARV discount +3.1/15.0
- Schools +3.0/10.0
- Rent growth +2.5/5.0
- Condition / age +2.5/5.0
- Appreciation +0.0/10.0
$995,000
🖨 Deal sheet 📄 Offer letter ✓ Due diligence
Multi-family units
County records classify this as Multi-Family (2-4 Unit). Listing-text estimate: 4 units. confirmed
Listing remarks MLS
Great opportunity for a fabulous fourplex in the Allendale/Laurel neighborhood! Upgrades include newer dual pane windows, newer foundation, newer plumbing and electrical. Sewer lateral compliant. Each unit has it's own garage. 2 units have laundry hook-ups. Units have either hardwood flooring or laminate wood flooring in living rooms. Great location within a few blocks of the Laurel shopping district and Jo's Modern Thai, Phnom Penh, Communite' Table, Ghost Town Brewing, Degrees Plato Tap Room.
Key facts
- Dual-pane windows
- Newer appliances
- Remodeled units
Tags
Property features AI
Exterior
- Parking: Detached parking; 4 parking spaces total (1 space per unit)
- Utilities: Public water; Public sewer; Individual electric meters; Individual gas meters
- Home design: Residential income property; Quadruplex
- Construction: Stucco construction; Built in 1925
- Exterior features: No yard; Corner lot; Rectangular lot
Interior
- Flooring: Hardwood; Laminate; Tile
- Bathrooms: Each unit has 1 bathroom (4 bathrooms total)
- Heating & cooling: Wall furnaces; No air conditioning
- Interior features: Washer included; Gas water heater; Hardwood, laminate and tile floors; Four total units
- Laundry & utility: Washer in unit(s)
Neighborhood map
What this means for you Summary
Snapshot
- This is a 4 × 4-bed/4.0-bath units multifamily listed at $995k.
Deal economics
- At list price, monthly cash flow is $2k ($28k/yr) — positive. Per door: $581/mo.
- The deal already cash-flows at list — no discount required.
- Meets the 1% rule at list price ($12k rent vs $995k).
- Cap rate 9.1% vs local median 2.4% in Oakland — top-decile yield for the area; either an underpriced asset or a hidden risk that comps aren't pricing in. Stress-test before assuming the spread holds.
Location & tenants
- Location reads 71/100 on livability (#224 in CA) — a middle-class / working-renter tenant base. Strengths: amenities A+, commute A+, employment A+; Watch: schools C-, crime F, cost of living F.
- Oakland Unified (urban): math 27% / reading 33% proficiency, ranked #1,007 of 1,400 in CA (top 72%) — families likely to look elsewhere, expect single-tenant / working-renter base with shorter leases; 68% free/reduced lunch — lower-income household profile, screen leases tightly.
- Market conditions: 90 active listings in the ZIP; 6 comparable units currently listed for rent nearby; rentals lingering (median 44d on market — plan ~5-8 weeks vacancy on turnover, expect pricing pressure); 50% of comp listings sitting > 30 days — soft ceiling on asking rent; high-income renter base; 1,742 units permitted in Alameda County in 2024 (856 in 5+ unit buildings).
- At $12,253/mo this rent would consume 113% of the median local household income ($130k/yr) (locally 1071% of renters already pay >50% of income on rent) — very limited rent-growth headroom before tenants either downsize or default.
Forward outlook
- Local home prices are declining (-3.0%/yr); year-one equity from $7k of loan paydown is wiped out by about $30k of value loss. Plan a longer hold.
- Alameda County population projected at +34% by 2050 — long-run rental-demand tailwind backs the buy-and-hold thesis.
Negotiation context
- Only 13 days on market — expect competitive offers; lowballing is unlikely to land.
- 5 sale attempts since 26y ago with the ask held roughly flat each time — persistent listings suggest the price (not the market) is what's stuck; bring a comps-based counter.
Risks & watch-outs
- Watch-outs: built in 1925 — expect roof / HVAC / electrical / plumbing capex.
Questions for the listing agent
- Can we see the unit-by-unit rent roll, current vacancy, and any below-market leases? What's the average tenancy length?
- What capital expenditures (roof, boiler, parking lot, exteriors) have been made in the last 5 years, and what's planned in the next 2?
- Built in 1925 — when were the roof, HVAC, electrical panel, plumbing, and water heater last replaced?
- Is there a deadline driving the sale (1031 exchange, divorce, estate, relocation)? That informs how much negotiation room exists.
- Crime grade is F in this area — have there been break-ins, vandalism, or insurance claims at this property in the last 3 years? What carrier currently insures it and at what premium?
- What's the average days-on-market for RENTAL listings here right now (not sales)? A rising rental-DOM trend means longer vacancies and softer asking-rent achievability than the comps imply.
- What's the recent tenant-quality profile in this submarket — average credit score on applications, eviction rate, late-payment / NSF rate, and stable-employment percentage? A property-management company in the area should have these aggregated.
- How much new apartment / multifamily construction is in the pipeline within 1–3 miles? Heavy new supply (>2% of stock underway) typically softens rents 12–24 months out; light construction supports rent growth.
Investment metrics
- 1% rule
- 1.23% ✓
- Cap rate
- 9.09%
- Cash-on-cash
- 10.00%
- DSCR
- 1.45
- GRM
- 6.8
CMA / ARV
- ARV (on-the-fly)
- $906,308
- Comps found
- 4
Show comp detail 4 sales within ~0.75 mi
| Address | Dist | Beds/Ba | Sqft | Sold | Price | $/sf | Match |
|---|---|---|---|---|---|---|---|
| 4160 Masterson St | 0.41mi | 4/3.0 | 2,347 (-2%) | 4mo | $565,000 | $241 | 70 |
| 3803 Midvale Ave | 0.51mi | 4/2.0 | 2,287 (-5%) | 15mo | $895,000 | $391 | 48 |
| 3228 Dakota St | 0.37mi | 5/3.0 (+1) | 2,682 (+12%) | 14mo | $1,010,000 | $377 | 43 |
| 3110 Coolidge Ave | 0.65mi | 3/4.0 (-1) | 2,548 (+6%) | 17mo | $835,000 | $328 | 40 |
Match score weights: distance 35% · size 25% · config 20% · recency 20%. Top-matched comps best support the ARV.
Projected returns pro-forma
-3.0% appreciation · 3.0% rent growth · sell at horizon
- IRR
- -1.2%
- Equity multiple
- 0.95×
- Total profit
- $-12,851
- Equity at exit
- $148,358
- IRR
- 8.5%
- Equity multiple
- 1.65×
- Total profit
- $181,208
- Equity at exit
- $86,029
Cash invested: $278,600 (down + closing). Projections, not guarantees.
Landlord ↔ Tenant lean methodology
- Overall (CITY)
- 0 Strongly Tenant-Friendly
- State California
- 18 Strongly Tenant-Friendly · D+13
- County
- — inherits STATE
- City Oakland
- 0 Strongly Tenant-Friendly · D+62
ZIP-level market 94619
- Active inventory
- 90
- Price-to-rent
- 27.1×
Monthly cashflow live
- Estimated rent
- $12,253 medium interval (Pro) →
- Mortgage (P&I)
- −$5,218
- Tax from tax record
- −$1,725 /mo · $20,703/yr
- Insurance
- −$415
- HOA
- −$0
- Vacancy / Maint / Mgmt
- −$2,573
- Net cashflow
- $2,322
Break-even live
4-unit breakdown (identical units grouped — click to expand)
| Units | Beds | Baths | Est. rent |
|---|---|---|---|
| 4× units | 4 | 4 | $12,252 |
| #1 | 4 | 4 | $3,063 |
| #2 | 4 | 4 | $3,063 |
| #3 | 4 | 4 | $3,063 |
| #4 | 4 | 4 | $3,063 |
| Total (4 units) | $12,253 | ||
UW: 25.0% down · 7.5% · 30yr · 1.5% tax · 5.0% vac · 8.0% maint · 8.0% mgmt
Financing live
Cash to close
- Down payment
- $248,750
- Closing costs
- $29,850
- Reserves months
- —
- Total cash needed
- —
Loan-product check · same deal, 3 products live
Conventional
25% down · 7.5% · 30yr
- Down + closing
- —
- Monthly P&I
- —
- Monthly cashflow
- —
- DSCR
- —
- Eligible?
- —
Personal DTI + credit; lowest rate.
DSCR
20% down · 8.5% · 30yr
- Down + closing
- —
- Monthly P&I
- —
- Monthly cashflow
- —
- DSCR
- —
- Eligible?
- —
No personal income docs; deal must DSCR.
Hard money
10% down · 12.0% · 12mo
- Down + closing
- —
- Monthly P&I
- —
- Monthly cashflow
- —
- DSCR
- —
- Eligible?
- —
Short-term bridge; refi at stabilization.
Rent comps 6 comps
| Address | Beds | Baths | Sqft | Rent | $/sqft | DOM | Units | Dist |
|---|---|---|---|---|---|---|---|---|
| 5307 Hillen Dr Oakland, CA | 3.0 | 2.0 | 1831 | $3,895 | $2.13 | 4d | 1 | 1.02mi |
| 4254 Gregory St Oakland, CA | 3.0 | 3.0 | 1949 | $4,500 | $2.31 | 43d | 1 | 1.03mi |
| 2900 Sheffield Ave Oakland, CA | 4.0 | 2.0 | 1692 | $7,000 | $4.14 | 3d | 1 | 1.09mi |
| 4120 Rhoda Ave Oakland, CA | 3.0 | 3.5 | 2561 | $6,995 | $2.73 | 1d | 1 | 1.09mi |
| 2422 E 24th St Unit 1 Oakland, CA | 5.0 | 1.0 | 2364 | $3,500 | $1.48 | 43d | 1 | 1.30mi |
| 5875 Picardy Dr Oakland, CA | 4.0 | 2.5 | 1906 | $5,200 | $2.73 | 43d | 1 | 1.34mi |
Listing history 11 events
-
2026-06-18days on market $995,000 Active 13 DOM
-
2026-06-17days on market $995,000 Active 12 DOM
-
2026-06-16days on market $995,000 Active 11 DOM
-
2026-06-16remarks 699-char remark
-
2026-06-15days on market $995,000 Active 10 DOM
-
2026-06-13days on market $995,000 Active 8 DOM
-
2026-06-13days on market $995,000 Active 7 DOM
-
2026-06-09days on market $995,000 Active 4 DOM
-
2026-06-08days on market $995,000 Active 3 DOM
-
2026-06-07remarks 617-char remark
-
2026-06-07$995,000 Active 2 DOM
ⓘ Source: listings_history table (triggers on properties + properties_extension) + one-shot
backfill from property_details.listing_events for pre-trigger history.
Tax reassessment forecast CA · Resets to sale price
- Current annual tax
- $20,703 · $1,725/mo
- Projected year-2 tax
- $20,703 · $1,725/mo
- Expected delta
- $0/yr ($0/mo · 0.0%)
ⓘ Screening estimate from a state-policy table — verify with the county assessor before closing.
Climate risk First Street
- Flood 1/10 Low FEMA zone X (unshaded) · 0% chance over 30 yrs
- Wildfire 1/10 Low
- Heat 3/10 Moderate 7 d/yr ≥84°F today · 15 d/yr by 30 yrs out
- Wind 1/10 Low
- Air quality 8/10 Severe 14 unhealthy d/yr today · 14 by 30 yrs out
Nearby sold comps map
Loading sold comps map…
Walkable amenities ~0.75 mi
Loading nearby amenities…
Taxation est. · year 1
- Rental income
- $147,036
- − Mortgage interest
- −$55,735
- − Property taxes
- −$20,703
- − Insurance
- −$4,975
- − Repairs & maintenance
- −$11,763
- − Management
- −$11,763
- − Depreciation
- −$28,945
- Taxable income
- $13,152
- Est. tax owed @ 24.0%
- −$3,156
- After-tax cash flow
- $24,710/yr
For passive investors: Depreciation is non-cash, so a rental often shows a tax loss while cash-flowing — sheltering income. Rental losses are passive: they offset passive income freely, and up to $25,000/yr can offset ordinary (W-2) income if you actively participate and your MAGI is under $100k (phasing out to $0 by $150k); unused losses carry forward. On sale, claimed depreciation is recaptured at up to 25%, and gains may owe capital-gains tax (a 1031 exchange can defer both). Figures are a year-1 estimate at your 24.0% rate — not tax advice; consult a CPA.
Schools (NCES district)
- District
- Oakland Unified
- NCES district ID
- 0628050
- Math proficiency
- 27% ▬ 0.00%
- Reading proficiency
- 33% ▬ 0.00%
- Median HH income
- $55,194
- Composite
- 29.52/100
- National rank
- #11769
- State rank
- #1007 of 1400 in CA
Livability — Oakland
- Score
- 71/100
- State rank
- #224
- US rank
- #7245
Category grades
Schools grade is shown separately in the Schools card above.
Census & demographics
- Census place
- Oakland, CA
- County
- Alameda County · 1,614,355 people
- City population
- 385,993
- Metro
- San Francisco-Oakland-Berkeley, CA
- Population (ZIP)
- 26,831
- Household income
- $129,867
- Rent vs Own
- Severe rent burden
- 1071.0
Population outlook (Alameda County) Hauer SSP2
- Today (2025)
- 1,928,884 people
- By 2030
- 2,069,146 · +7.3%
- By 2040
- 2,338,405 · +21.2%
- By 2050
- 2,586,608 · +34.1%
- By 2075
- 3,061,911 · +58.7%
- By 2100
- 3,234,133 · +67.7%
Race, ethnicity, and origin ACS 2023
- Neighborhood character
- Highly diverse neighborhood (Simpson 0.78)
- Race & ethnicity
- White 32% Hispanic / Latino 23% Black 19% Asian 17% Two or more races 14% Native American 1%
- Hispanic origin (detail)
- Mexican 11%
- Common ancestry
- Italian 2% Lithuanian 2% Portuguese 2%
- Foreign-born
- 21% · Canada, China, Vietnam
- Languages at home
- 67% English-only · Spanish 14% Chinese 8% Other Indo-European 2%
Political lean MEDSL · Alameda
- 2024 margin
- Solid D (+53.6) · D 74.6% · R 21.0% · Other 4.4%
- 2008→2024 swing
- -5.9pp toward R · 2008: 59.5pp · 2024: 53.6pp
- All cycles
- 2024: D+53.6 2020: D+62.5 2016: D+64.4 2012: D+59.8 2008: D+59.5
Not yet ingested
- Civics
- —
Market trends
- HPI YoY
- ▼ -835.69%
- Current HPI
- 259.7097
- Rent YoY
- —
- Metro
- San Francisco-Oakland-Berkeley, CA
- State GDP YoY
- ▲ 3.21%
- F500 in state
- 116
Industry mix (Fortune 500 HQ in CA)
| Industry | F500 HQs | Revenue |
|---|---|---|
| Technology | 27 | $1,492B |
|
||
| Financial Services | 3 | $174B |
|
||
| Retail | 3 | $44B |
|
||
| Insurance | 3 | $26B |
|
||
| Media / Entertainment | 2 | $115B |
|
||
| Pharmaceuticals / Biotech | 2 | $62B |
|
||
Price history
+452.8% since first listed18 events — show timeline
- 2026-06-05 Listed $995,000 bridgeMLS, Bay East AOR, or Contra Costa AOR
- 2022-02-27 Sold (MLS) $1,225,000 bridgeMLS, Bay East AOR, or Contra Costa AOR
- 2022-02-16 Sold (Public Records) $1,225,000 Public Records
- 2022-01-14 Pending — bridgeMLS, Bay East AOR, or Contra Costa AOR
- 2021-12-18 Listed $1,150,000 bridgeMLS, Bay East AOR, or Contra Costa AOR
- 2012-09-19 Sold (MLS) $430,000 bridgeMLS, Bay East AOR, or Contra Costa AOR
- 2012-07-18 Pending — bridgeMLS, Bay East AOR, or Contra Costa AOR
- 2012-07-10 Price Changed $440,000 bridgeMLS, Bay East AOR, or Contra Costa AOR
- 2012-05-25 Listed $462,000 bridgeMLS, Bay East AOR, or Contra Costa AOR
- 2005-10-20 Sold (Public Records) $750,000 Public Records
- 2005-10-19 Sold (MLS) $745,000 bridgeMLS, Bay East AOR, or Contra Costa AOR
- 2005-09-15 Listing Removed — bridgeMLS, Bay East AOR, or Contra Costa AOR
- 2005-08-11 Listed $744,999 bridgeMLS, Bay East AOR, or Contra Costa AOR
- 2000-06-28 Sold (Public Records) $217,500 Public Records
- 2000-06-28 Sold (MLS) $217,500 bridgeMLS, Bay East AOR, or Contra Costa AOR
- 2000-05-18 Listing Removed — bridgeMLS, Bay East AOR, or Contra Costa AOR
- 2000-05-12 Listed $195,000 bridgeMLS, Bay East AOR, or Contra Costa AOR
- 1986-01-16 Sold (Public Records) $180,000 Public Records
Property tax history
+3.3%/yrLatest (2025): $20,703 · +4.1% YoY. Source: county tax records.
Cash-flow waterfall
monthlySold comps — $/sqft
last 12 mo · ≤1 miLoading sold comps…