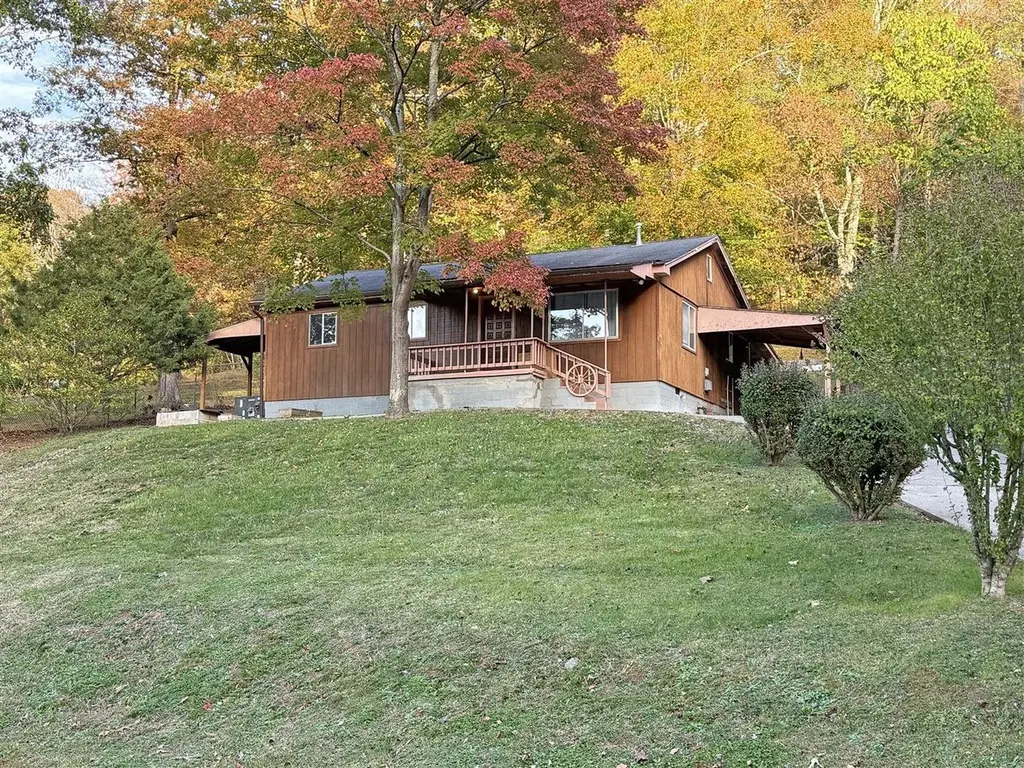
5320 Doc Bailey Rd · Cross Lanes, WV
Flood risk 1/10 · Minimal
- FEMA flood zone
- X (unshaded)
- Chance of flooding over 30 yrs
- 0.0%
- Est. flood insurance / yr
- $507 – $1,088
Fire risk 5/10 · Moderate
- Est. fire insurance / yr
- $787 – $1,461
Heat risk 4/10 · Minor
- Hot days now (above 101°F)
- 7 days/yr
- Hot days in 30 yrs
- 19 days/yr
Wind risk 2/10 · Minimal
- Chance of severe wind over 30 yrs
- 1.0%
Air-quality risk 2/10 · Minimal
- Unhealthy air days now
- 0 days/yr
- Unhealthy air days in 30 yrs
- 1 days/yr
Risk factors via First Street. Map © Google.
Why this score? — see what drove the D+ grade
The composite is a weighted blend of 9 inputs, each scored 0–100. Each bar is that input's sub-score; the figure is the points it added to the 100-point composite (weight × sub-score).
- Cash flow +16.7/30.0
- ARV discount +13.1/15.0
- DSCR +5.2/10.0
- 1% rule +3.4/10.0
- Livability +3.4/5.0
- Schools +2.9/10.0
- Rent growth +2.5/5.0
- Condition / age +2.5/5.0
- Appreciation +0.0/10.0
$140,000
🖨 Deal sheet (PDF) 📄 Offer letter ✓ Due diligence
Listing remarks
Investor special! Being sold as-is this home has good bones, great location, endless potential. Located in a desirable neighborhood close to school, shopping etc. Drone video of property upon request.
Key facts
- 1.41 acre lot
- Built 1963
- Listed 61 days
Property features AI
Exterior
- Utilities: Public water
- Home design: Single-family residence; One-story
- Construction: Wood siding construction; Shingle roof; Built on single-story foundation
- Exterior features: Patio; Porch; Rolling, sloped, wooded lot
Interior
- Bathrooms: 1 full bathroom
- Interior features: Central air conditioning; Heat pump heating
Neighborhood map
What this means for you Summary
Snapshot
- This is a 2-bed/1.0-bath single-family listed at $140k.
Deal economics
- At list price, monthly cash flow is $86 ($1k/yr) — positive.
- The deal already cash-flows at list — no discount required.
- To meet the 1% rule (rent ≥ 1% of price), the offer needs to be $117k (16.3% below list).
- Recommended offer: $117k (16.3% below list) — sets the bar for 1% rule.
- Cap rate 7.0% vs local median 4.9% in Cross Lanes — top-decile yield for the area; either an underpriced asset or a hidden risk that comps aren't pricing in. Stress-test before assuming the spread holds.
Location & tenants
- Location reads 67/100 on livability (#90 in WV) — a middle-class / working-renter tenant base. Strengths: crime A+, cost of living A+, housing A; Watch: employment D+, amenities F, commute F.
- Kanawha County Schools (suburban): math 29% / reading 40% proficiency, ranked #17 of 55 in WV (top 31%) — families likely to look elsewhere, expect single-tenant / working-renter base with shorter leases.
- Zoned schools: Point Harmony Elementary School (math 42% / reading 32%, grade F, #130 of 377 statewide, top 39%, 487 students, 0% FRL); Andrew Jackson Middle School (math 23% / reading 41%, grade F, #46 of 109 statewide, top 46%, 512 students, 0% FRL); Nitro High School (math 22% / reading 57%, grade F, #21 of 110 statewide, top 26%, 827 students, 0% FRL) — zoned schools average 0% FRL vs 46% district-wide (46 pts lower); this property's tenant base skews higher-income than the district average.
- Market conditions: 56 active listings in the ZIP; 103 units permitted in Kanawha County in 2024 (0 in 5+ unit buildings).
Forward outlook
- Local home prices are declining (-3.0%/yr); year-one equity from $968 of loan paydown is wiped out by about $4k of value loss. Plan a longer hold.
- Kanawha County population projected at -17% by 2050 — secular population decline; favor cash flow + early exit over multi-decade hold.
Negotiation context
- It's been on market 61 days — a 6% lower offer ($132k) is reasonable based on typical stale-listing flexibility.
Risks & watch-outs
- Climate carrying-cost: moderate wildfire risk — expect insurance premiums to compound above CPI over the hold.
Questions for the listing agent
- It's been on market 61 days. Have you received any prior offers? Is the seller open to a 16% concession, seller financing, or rate buy-down credit?
- Built in 1963 — when were the roof, HVAC, electrical panel, plumbing, and water heater last replaced?
- Why hasn't it sold? Are there any deal-killer items the seller is aware of (foundation, flood, title, zoning, code violations)?
- Is there a deadline driving the sale (1031 exchange, divorce, estate, relocation)? That informs how much negotiation room exists.
- The area grade is low — what's the realistic commute time and amenity access for the typical tenant pool here? Any planned neighborhood developments (good or bad) we should know about?
- What's the average days-on-market for RENTAL listings here right now (not sales)? A rising rental-DOM trend means longer vacancies and softer asking-rent achievability than the comps imply.
- What's the recent tenant-quality profile in this submarket — average credit score on applications, eviction rate, late-payment / NSF rate, and stable-employment percentage? A property-management company in the area should have these aggregated.
- How much new for-sale + rental construction is in the pipeline within 1–3 miles? Heavy new supply typically softens prices + rents 12–24 months out; constrained supply supports both.
Investment metrics
- 1% rule
- 0.84% ✗
- Cap rate
- 7.03%
- Cash-on-cash
- 2.65%
- DSCR
- 1.12
- GRM
- 10.0
CMA / ARV
- ARV (on-the-fly)
- $159,877
- Comps found
- 4
Show comp detail 4 sales within ~0.75 mi
| Address | Dist | Beds/Ba | Sqft | Sold | Price | $/sf | Match |
|---|---|---|---|---|---|---|---|
| 5311 Katie Ln | 0.65mi | 3/1.0 (+1) | 1,040 (-3%) | 11mo | $155,000 | $149 | 50 |
| 5425 Tiffany Dr | 0.63mi | 3/1.0 (+1) | 1,091 (+2%) | 21mo | $171,000 | $157 | 45 |
| 5411 Kendall Dr | 0.67mi | 3/1.0 (+1) | 1,000 (-7%) | 14mo | $120,000 | $120 | 41 |
| 5247 Doc Bailey Rd | 0.65mi | 3/1.0 (+1) | 1,176 (+10%) | 11mo | $31,000 | $26 | 40 |
Match score weights: distance 35% · size 25% · config 20% · recency 20%. Top-matched comps best support the ARV.
Projected returns pro-forma
-3.0% appreciation · 3.0% rent growth · sell at horizon
- IRR
- -12.2%
- Equity multiple
- 0.56×
- Total profit
- $-17,242
- Equity at exit
- $20,874
- IRR
- -3.1%
- Equity multiple
- 0.79×
- Total profit
- $-8,174
- Equity at exit
- $12,105
Cash invested: $39,200 (down + closing). Projections, not guarantees.
Landlord ↔ Tenant lean methodology
- Overall (STATE)
- 83 Strongly Landlord-Friendly
- State West Virginia
- 83 Strongly Landlord-Friendly · R+22
- County
- — inherits STATE
- City
- — inherits STATE
ZIP-level market 25313
- Home prices YoY
- -12.4%
- Active inventory
- 56
- Price-to-rent
- 10.0×
Monthly cashflow live
- Estimated rent
- $1,172 medium interval (Pro) →
- Mortgage (P&I)
- −$734
- Tax from tax record
- −$47 /mo · $561/yr
- Insurance
- −$58
- HOA
- −$0
- Vacancy / Maint / Mgmt
- −$246
- Net cashflow
- $86
Break-even live
Sensitivity live
| Price | -10% $166 | -5% $126 | +0% $86 | +5% $47 | +10% $7 |
|---|---|---|---|---|---|
| Rent | -10% $-6 | -5% $40 | +0% $86 | +5% $133 | +10% $179 |
| Rate | -1.0pp $157 | -0.5pp $122 | base $86 | +0.5pp $50 | +1.0pp $13 |
UW: 25.0% down · 7.5% · 30yr · 1.5% tax · 5.0% vac · 8.0% maint · 8.0% mgmt
Financing live
Cash to close
- Down payment
- $35,000
- Closing costs
- $4,200
- Reserves months
- —
- Total cash needed
- —
Loan-product check · same deal, 3 products live
Conventional
25% down · 7.5% · 30yr
- Down + closing
- —
- Monthly P&I
- —
- Monthly cashflow
- —
- DSCR
- —
- Eligible?
- —
Personal DTI + credit; lowest rate.
DSCR
20% down · 8.5% · 30yr
- Down + closing
- —
- Monthly P&I
- —
- Monthly cashflow
- —
- DSCR
- —
- Eligible?
- —
No personal income docs; deal must DSCR.
Hard money
10% down · 12.0% · 12mo
- Down + closing
- —
- Monthly P&I
- —
- Monthly cashflow
- —
- DSCR
- —
- Eligible?
- —
Short-term bridge; refi at stabilization.
Listing history 7 events
-
2026-06-05days on market $140,000 Active 61 DOM
-
2026-06-03days on market $140,000 Active 60 DOM
-
2026-06-02days on market $140,000 Active 59 DOM
-
2026-06-01days on market $140,000 Active 58 DOM
-
2026-05-31days on market $140,000 Active 57 DOM
-
2026-05-30days on market $140,000 Active 56 DOM
-
2026-04-05$140,000 Active
ⓘ Source: listings_history table (triggers on properties + properties_extension) + one-shot
backfill from property_details.listing_events for pre-trigger history.
Tax reassessment forecast WV · Resets to sale price
- Current annual tax
- $561 · $47/mo
- Projected year-2 tax
- $826 · $69/mo
- Expected delta
- +$265/yr (+$22/mo · 47.3%)
ⓘ Screening estimate from a state-policy table — verify with the county assessor before closing.
Climate risk First Street
- Flood 1/10 Low FEMA zone X (unshaded) · 0% chance over 30 yrs
- Wildfire 5/10 Major
- Heat 4/10 Moderate 7 d/yr ≥101°F today · 19 d/yr by 30 yrs out
- Wind 2/10 Low 100% chance of damaging wind over 30 yrs
- Air quality 2/10 Low 0 unhealthy d/yr today · 1 by 30 yrs out
Nearby sold comps map
Loading sold comps map…
Walkable amenities ~0.75 mi
Loading nearby amenities…
Taxation est. · year 1
- Rental income
- $14,061
- − Mortgage interest
- −$7,842
- − Property taxes
- −$561
- − Insurance
- −$700
- − Repairs & maintenance
- −$1,125
- − Management
- −$1,125
- − Depreciation
- −$4,073
- Taxable loss
- −$1,365
- Est. tax savings @ 24.0%
- +$328
- After-tax cash flow
- $1,365/yr
For passive investors: Depreciation is non-cash, so a rental often shows a tax loss while cash-flowing — sheltering income. Rental losses are passive: they offset passive income freely, and up to $25,000/yr can offset ordinary (W-2) income if you actively participate and your MAGI is under $100k (phasing out to $0 by $150k); unused losses carry forward. On sale, claimed depreciation is recaptured at up to 25%, and gains may owe capital-gains tax (a 1031 exchange can defer both). Figures are a year-1 estimate at your 24.0% rate — not tax advice; consult a CPA.
Schools (NCES district)
- District
- Kanawha County Schools
- NCES district ID
- 5400600
- Math proficiency
- 29% ▼ -13.00%
- Reading proficiency
- 40% ▼ -7.00%
- Median HH income
- $44,329
- Composite
- 29.35/100
- National rank
- #6540
- State rank
- #17 of 55 in WV
Livability — Cross Lanes
- Score
- 67/100
- State rank
- #90
- US rank
- #10503
Category grades
Schools grade is shown separately in the Schools card above.
Census & demographics
- Census place
- Cross Lanes, WV
- County
- Kanawha County · 33,502 people
- Metro
- Charleston, WV
- Population (ZIP)
- 11,760
- Household income
- $64,385
- Rent vs Own
- Severe rent burden
- 324.0
Population outlook (Kanawha County) Hauer SSP2
- Today (2025)
- 178,946 people
- By 2030
- 172,906 · -3.4%
- By 2040
- 159,874 · -10.7%
- By 2050
- 148,148 · -17.2%
- By 2075
- 123,257 · -31.1%
- By 2100
- 96,454 · -46.1%
Race, ethnicity, and origin ACS 2023
- Neighborhood character
- Predominantly White (90%)
- Race & ethnicity
- White 90% Black 4% Two or more races 3% Hispanic / Latino 3% Asian 1%
- Common ancestry
- Italian 3% Serbian 2% Romanian 2%
- Foreign-born
- 3% · Canada, China
- Languages at home
- 95% English-only · Spanish 2% Other Indo-European 1% Other Asian/Pacific 1%
Political lean MEDSL · Kanawha
- 2024 margin
- R (+17.4) · D 40.2% · R 57.6% · Other 2.2%
- 2008→2024 swing
- -17.0pp toward R · 2008: -0.4pp · 2024: -17.4pp
- All cycles
- 2024: R+17.4 2020: R+14.7 2016: R+20.6 2012: R+11.9 2008: R+0.4
Not yet ingested
- Civics
- —
Market trends
- HPI YoY
- ▼ -28.10%
- Current HPI
- 199.1903
- Rent YoY
- —
- Metro
- Charleston, WV
- State GDP YoY
- —
- F500 in state
- 0
Price history
1 event — show timeline
- 2026-04-05 Listed $140,000 HBRMLS
Property tax history
+2.9%/yrLatest (2025): $561 · -1.3% YoY. Source: county tax records.
Cash-flow waterfall
monthlySold comps — $/sqft
last 12 mo · ≤1 miLoading sold comps…