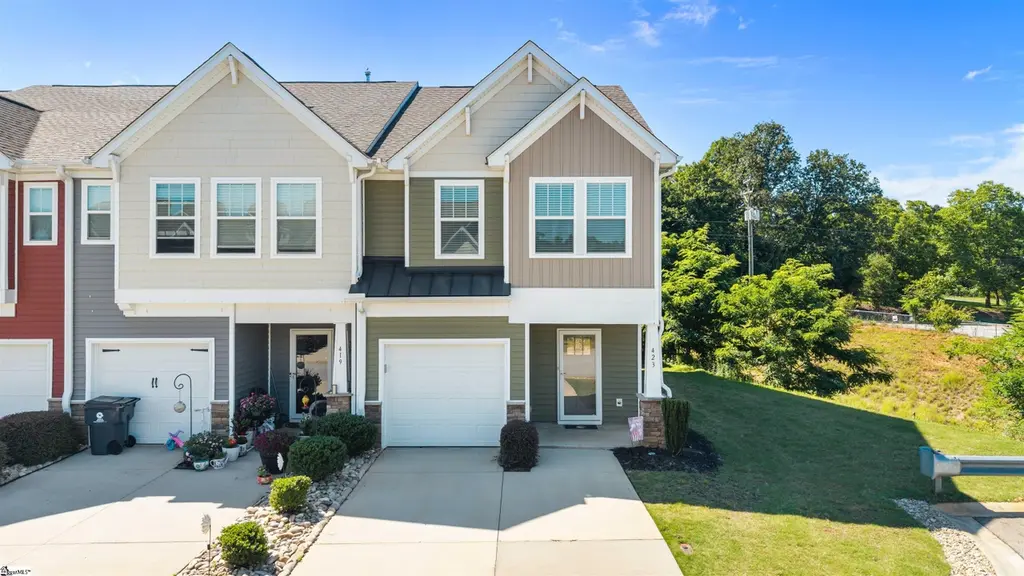
423 Hague Dr · Reidville, SC
Flood risk 1/10 · Minimal
- FEMA flood zone
- X (unshaded)
- Chance of flooding over 30 yrs
- 0.0%
- Est. flood insurance / yr
- $507 – $1,088
Fire risk 3/10 · Minor
- Est. fire insurance / yr
- $783 – $1,453
Heat risk 6/10 · Moderate
- Hot days now (above 105°F)
- 7 days/yr
- Hot days in 30 yrs
- 17 days/yr
Wind risk 2/10 · Minimal
- Chance of severe wind over 30 yrs
- 2.0%
Air-quality risk 4/10 · Minor
- Unhealthy air days now
- 4 days/yr
- Unhealthy air days in 30 yrs
- 5 days/yr
Risk factors via First Street. Map © Google.
Why this score? — see what drove the D grade
The composite is a weighted blend of 9 inputs, each scored 0–100. Each bar is that input's sub-score; the figure is the points it added to the 100-point composite (weight × sub-score).
- Cash flow +12.9/30.0
- ARV discount +6.6/15.0
- Schools +4.1/10.0
- Livability +4.0/5.0
- DSCR +3.9/10.0
- 1% rule +3.3/10.0
- Rent growth +2.9/5.0
- Condition / age +2.5/5.0
- Appreciation +0.0/10.0
$249,999
🖨 Deal sheet (PDF) 📄 Offer letter ✓ Due diligence
Listing remarks
Tucked into an end-unit location at 423 Hague Drive, this thoughtfully updated three-bedroom, two-and-a-half-bath townhome offers a blend of comfort, convenience, and elevated style for today’s first-time buyer or busy professional seeking low-maintenance living with easy access to everything the Upstate has to offer. Recent improvements, including fresh interior paint in the sought-after Repose Gray palette and brand-new carpet throughout creates a bright, refreshed feel, while distinctive features such as the gas fireplace, open stair banisters, fenced outdoor space, and a more functional kitchen-first floor plan help this home stand apart from others in the community. The layout fl
Key facts
- Gas fireplace
- Fenced outdoor space
- $140 HOA
Tags
Property features AI
Finance
- HOA & community: Homeowners association membership; HOA covers exterior maintenance, lawn maintenance, street lights, termite contract, by-laws, restrictive covenants, and yard irrigation; Community amenities include lighting and landscape/lawn maintenance
Exterior
- Parking: Attached 1-car garage; Paved concrete driveway
- Utilities: Public water; Public sewer; Public garbage pickup; Electric service (implied by appliances and cooling); Gas water heater and natural gas heating
- Home design: Two-story residential home; Built in 2019; Storage in attic and garage; Slab foundation; Built by DRB
- Construction: Vinyl siding construction; Composition shingle roof; Slab foundation; Built in 2019
- Exterior features: Thermal windows; Composition shingle roof; Vinyl siding; Cul-de-sac lot; Level lot; Yard irrigation (through HOA)
Interior
- Kitchen: Dishwasher; Disposal; Gas range (stand-alone); Built-in microwave; Range hood; Refrigerator
- Bedrooms: Primary bedroom on second level with double sink, full bath, shower only, and multiple closets; Second bedroom (9 x 17); Third bedroom (9 x 13)
- Flooring: Carpet; Ceramic tile; Luxury vinyl tile/plank
- Bathrooms: Two full bathrooms; One half bathroom
- Heating & cooling: Natural gas heating; Central forced cooling; Gas water heater
- Interior features: Ceiling fans; Smooth ceilings; Granite countertops; Open floor plan; Smoke detector; Pantry closet; All window treatments remain; Gas-log fireplace (1)
- Laundry & utility: Second-floor laundry in closet style with washer connection and electric dryer hookup
Neighborhood map
What this means for you Summary
Snapshot
- This is a 3-bed/2.5-bath townhouse listed at $250k.
Deal economics
- At list price, monthly cash flow is $-18 ($-211/yr) — negative.
- To cash-flow at today's rent, offer at most $247k (1.2% below list).
- To meet the 1% rule (rent ≥ 1% of price), the offer needs to be $209k (16.5% below list).
- Recommended offer: $209k (16.5% below list) — sets the bar for 1% rule.
- Cap rate 6.2% vs local median 3.8% in Reidville — top-decile yield for the area; either an underpriced asset or a hidden risk that comps aren't pricing in. Stress-test before assuming the spread holds.
Location & tenants
- Location reads 80/100 on livability (#12 in SC, #1,810 nationally) — a professional / high-income tenant draw. Strengths: crime A+, employment A+, housing A+; Watch: amenities F, commute F.
- Spartanburg 05 (suburban): math 45% / reading 51% proficiency, ranked #13 of 80 in SC (top 16%) — families likely to look elsewhere, expect single-tenant / working-renter base with shorter leases.
- Zoned schools: River Ridge Elementary (math 53% / reading 48%, grade D+, #160 of 597 statewide, top 27%, 778 students, 64% FRL); Berry Shoals Intermediate (math 54% / reading 48%, grade C, #36 of 229 statewide, top 16%, 902 students, 56% FRL); James F. Byrnes High (math 31% / reading 75%, grade C-, #140 of 196 statewide, top 72%, 2,217 students, 56% FRL) — zoned schools average 59% FRL vs 39% district-wide (19 pts higher); higher-poverty schools than district average — tighter screening recommended.
- Market conditions: Rents rising (+1.5%/yr); 143 active listings in the ZIP; 5 comparable units currently listed for rent nearby; rentals at typical pace (median 23d on market — plan ~3-4 weeks tenant-placement turnaround); solid renter incomes; 3,129 units permitted in Spartanburg County in 2024 (40 in 5+ unit buildings).
- This rent runs 31% of the median local income ($81k/yr) — at the standard rent-burdened threshold; future hikes will face affordability resistance.
Forward outlook
- Local home prices are declining (-3.0%/yr); year-one equity from $2k of loan paydown is wiped out by about $8k of value loss. Plan a longer hold.
- Spartanburg County population projected at +18% by 2050 — long-run rental-demand tailwind backs the buy-and-hold thesis.
Negotiation context
- Only 13 days on market — expect competitive offers; lowballing is unlikely to land.
Risks & watch-outs
- Climate carrying-cost: extreme-heat days projected 7→17/yr by 2055 (HVAC capex compounding) — expect insurance premiums to compound above CPI over the hold.
Questions for the listing agent
- What do current leases actually rent for vs. the listed asking? Can we see a recent rent roll and the last 12 months of T-12 income?
- What does the HOA fee cover, when was the last increase, and are there any pending special assessments or reserve-fund shortfalls?
- Is there a deadline driving the sale (1031 exchange, divorce, estate, relocation)? That informs how much negotiation room exists.
- Schools are B-rated — typically a magnet for longer-tenancy family renters. What's the average tenant stay here, and is there a school-zone premium baked into asking?
- The area grade is low — what's the realistic commute time and amenity access for the typical tenant pool here? Any planned neighborhood developments (good or bad) we should know about?
- What's the average days-on-market for RENTAL listings here right now (not sales)? A rising rental-DOM trend means longer vacancies and softer asking-rent achievability than the comps imply.
- What's the recent tenant-quality profile in this submarket — average credit score on applications, eviction rate, late-payment / NSF rate, and stable-employment percentage? A property-management company in the area should have these aggregated.
- How much new for-sale + rental construction is in the pipeline within 1–3 miles? Heavy new supply typically softens prices + rents 12–24 months out; constrained supply supports both.
Investment metrics
- 1% rule
- 0.83% ✗
- Cap rate
- 6.21%
- Cash-on-cash
- -0.30%
- DSCR
- 0.99
- GRM
- 10.0
CMA / ARV
- ARV (on-the-fly)
- $244,872
- Comps found
- 12
Show comp detail 12 sales within ~0.75 mi
| Address | Dist | Beds/Ba | Sqft | Sold | Price | $/sf | Match |
|---|---|---|---|---|---|---|---|
| 386 Hague Dr | 0.05mi | 3/2.5 | 1,596 (-1%) | 2mo | $220,000 | $138 | 94 |
| 305 Hague Dr | 0.13mi | 3/2.5 | 1,654 (+3%) | 11mo | $223,000 | $135 | 80 |
| 1316 Maplesmith Way | 0.74mi | 3/2.5 | 1,616 (+0%) | 12mo | $239,990 | $149 | 55 |
| 1248 Cherry Orchard Rd | 0.73mi | 3/2.5 | 1,616 (+0%) | 13mo | $255,409 | $158 | 55 |
| 1318 Maplesmith Way | 0.75mi | 3/2.5 | 1,600 (-1%) | 12mo | $241,478 | $151 | 54 |
| 1254 Cherry Orchard Rd | 0.72mi | 3/2.5 | 1,600 (-1%) | 13mo | $251,090 | $157 | 54 |
| 1260 Cherry Orchard Rd | 0.71mi | 3/2.5 | 1,598 (-1%) | 14mo | $267,990 | $168 | 54 |
| 1308 Maplesmith Way | 0.73mi | 3/2.5 | 1,616 (+0%) | 13mo | $241,478 | $149 | 54 |
| 1310 Maplesmith Way | 0.74mi | 3/2.5 | 1,587 (-2%) | 12mo | $223,500 | $141 | 53 |
| 1320 Maplesmith Way | 0.75mi | 3/2.5 | 1,587 (-2%) | 12mo | $241,510 | $152 | 53 |
| 1312 Maplesmith Way | 0.74mi | 3/2.5 | 1,587 (-2%) | 12mo | $240,990 | $152 | 53 |
| 1306 Maplesmith Way | 0.73mi | 3/2.5 | 1,587 (-2%) | 13mo | $261,990 | $165 | 52 |
Match score weights: distance 35% · size 25% · config 20% · recency 20%. Top-matched comps best support the ARV.
Projected returns pro-forma
-3.0% appreciation · 1.52% rent growth · sell at horizon
- IRR
- -18.4%
- Equity multiple
- 0.36×
- Total profit
- $-44,700
- Equity at exit
- $37,276
- IRR
- -13.9%
- Equity multiple
- 0.25×
- Total profit
- $-52,592
- Equity at exit
- $21,615
Cash invested: $70,000 (down + closing). Projections, not guarantees.
Landlord ↔ Tenant lean methodology
- Overall (STATE)
- 90 Strongly Landlord-Friendly
- State South Carolina
- 90 Strongly Landlord-Friendly · R+6
- County
- — inherits STATE
- City
- — inherits STATE
ZIP-level market 29334
- Home prices YoY
- -21.7%
- Rents YoY
- 1.5%
- Active inventory
- 143
- Price-to-rent
- 10.0×
Monthly cashflow live
- Estimated rent
- $2,087 medium interval (Pro) →
- Mortgage (P&I)
- −$1,311
- Tax from tax record
- −$111 /mo · $1,332/yr
- Insurance
- −$104
- HOA
- −$140
- Vacancy / Maint / Mgmt
- −$438
- Net cashflow
- $-18
Break-even live
Sensitivity live
| Price | -10% $124 | -5% $53 | +0% $-18 | +5% $-88 | +10% $-159 |
|---|---|---|---|---|---|
| Rent | -10% $-182 | -5% $-100 | +0% $-18 | +5% $65 | +10% $147 |
| Rate | -1.0pp $108 | -0.5pp $46 | base $-18 | +0.5pp $-82 | +1.0pp $-148 |
UW: 25.0% down · 7.5% · 30yr · 1.5% tax · 5.0% vac · 8.0% maint · 8.0% mgmt
Financing live
Cash to close
- Down payment
- $62,500
- Closing costs
- $7,500
- Reserves months
- —
- Total cash needed
- —
Loan-product check · same deal, 3 products live
Conventional
25% down · 7.5% · 30yr
- Down + closing
- —
- Monthly P&I
- —
- Monthly cashflow
- —
- DSCR
- —
- Eligible?
- —
Personal DTI + credit; lowest rate.
DSCR
20% down · 8.5% · 30yr
- Down + closing
- —
- Monthly P&I
- —
- Monthly cashflow
- —
- DSCR
- —
- Eligible?
- —
No personal income docs; deal must DSCR.
Hard money
10% down · 12.0% · 12mo
- Down + closing
- —
- Monthly P&I
- —
- Monthly cashflow
- —
- DSCR
- —
- Eligible?
- —
Short-term bridge; refi at stabilization.
Rent comps 5 comps
| Address | Beds | Baths | Sqft | Rent | $/sqft | DOM | Units | Dist |
|---|---|---|---|---|---|---|---|---|
| 939 Squires Pt Duncan, SC | 3.0 | 2.0 | 1900 | $2,295 | $1.21 | 15d | 1 | 0.46mi |
| 1010 Palisade Woods Dr Unit 1220-105 Duncan, SC | 2.0 | 2.0 | 1139 | $3,990 | $3.50 | 23d | 1 | 0.73mi |
| 1069 Millison Pl Moore, SC | 3.0 | 2.5 | 1650 | $1,800 | $1.09 | 23d | 1 | 0.82mi |
| 25 Apricot Ln Duncan, SC | 3.0 | 2.5 | 1549 | $1,750 | $1.13 | 15d | 1 | 1.07mi |
| 32 Apricot Ln Duncan, SC | 3.0 | 2.5 | 1498 | $1,550 | $1.03 | 23d | 1 | 1.10mi |
HOA detail
- Monthly dues
- $140 · $1,680/yr
- Likely covers
- gas
Listing history 10 events
-
2026-06-22days on market $249,999 Active 13 DOM
-
2026-06-18days on market $249,999 Active 10 DOM
-
2026-06-17days on market $249,999 Active 9 DOM
-
2026-06-16days on market $249,999 Active 8 DOM
-
2026-06-15days on market $249,999 Active 7 DOM
-
2026-06-14days on market $249,999 Active 5 DOM
-
2026-06-13days on market $249,999 Active 4 DOM
-
2026-06-10days on market $249,999 Active 2 DOM
-
2026-06-09remarks 693-char remark
-
2026-06-09$249,999 Active 1 DOM
ⓘ Source: listings_history table (triggers on properties + properties_extension) + one-shot
backfill from property_details.listing_events for pre-trigger history.
Tax reassessment forecast SC · Resets to sale price
- Current annual tax
- $1,332 · $111/mo
- Projected year-2 tax
- $1,425 · $119/mo
- Expected delta
- +$93/yr (+$8/mo · 7.0%)
ⓘ Screening estimate from a state-policy table — verify with the county assessor before closing.
Climate risk First Street
- Flood 1/10 Low FEMA zone X (unshaded) · 0% chance over 30 yrs
- Wildfire 3/10 Moderate
- Heat 6/10 Major 7 d/yr ≥105°F today · 17 d/yr by 30 yrs out
- Wind 2/10 Low 2% chance of damaging wind over 30 yrs
- Air quality 4/10 Moderate 4 unhealthy d/yr today · 5 by 30 yrs out
Nearby sold comps map
Loading sold comps map…
Walkable amenities ~0.75 mi
Loading nearby amenities…
Taxation est. · year 1
- Rental income
- $25,041
- − Mortgage interest
- −$14,004
- − Property taxes
- −$1,332
- − Insurance
- −$1,250
- − Repairs & maintenance
- −$2,003
- − Management
- −$2,003
- − HOA
- −$1,680
- − Depreciation
- −$7,273
- Taxable loss
- −$4,503
- Est. tax savings @ 24.0%
- +$1,081
- After-tax cash flow
- $870/yr
For passive investors: Depreciation is non-cash, so a rental often shows a tax loss while cash-flowing — sheltering income. Rental losses are passive: they offset passive income freely, and up to $25,000/yr can offset ordinary (W-2) income if you actively participate and your MAGI is under $100k (phasing out to $0 by $150k); unused losses carry forward. On sale, claimed depreciation is recaptured at up to 25%, and gains may owe capital-gains tax (a 1031 exchange can defer both). Figures are a year-1 estimate at your 24.0% rate — not tax advice; consult a CPA.
Schools (NCES district)
- District
- Spartanburg 05
- NCES district ID
- 4503600
- Math proficiency
- 45% ▼ -11.00%
- Reading proficiency
- 51% ▬ 0.00%
- Median HH income
- $52,127
- Composite
- 41.31/100
- National rank
- #3512
- State rank
- #13 of 80 in SC
Livability — Reidville
- Score
- 80/100
- State rank
- #12
- US rank
- #1810
Category grades
Schools grade is shown separately in the Schools card above.
Census & demographics
- County
- Spartanburg County · 258,607 people
- City population
- 129
- Metro
- Spartanburg, SC
- Population (ZIP)
- 18,575
- Household income
- $81,413
- Rent vs Own
- Severe rent burden
- 300.0
Population outlook (Spartanburg County) Hauer SSP2
- Today (2025)
- 325,495 people
- By 2030
- 338,800 · +4.1%
- By 2040
- 363,471 · +11.7%
- By 2050
- 384,156 · +18.0%
- By 2075
- 430,137 · +32.1%
- By 2100
- 442,733 · +36.0%
Race, ethnicity, and origin ACS 2023
- Neighborhood character
- Majority White (64%)
- Race & ethnicity
- White 64% Black 22% Hispanic / Latino 9% Two or more races 7% Asian 2%
- Hispanic origin (detail)
- Mexican 6% Cuban 1%
- Common ancestry
- Lithuanian 2% Serbian 1% Italian 1%
- Foreign-born
- 9% · Canada, Jamaica
- Languages at home
- 90% English-only · Spanish 4% Other Indo-European 2% Russian/Polish/Slavic 1%
Political lean MEDSL · Spartanburg
- 2024 margin
- Solid R (+33.6) · D 32.6% · R 66.2% · Other 1.2%
- 2008→2024 swing
- -12.0pp toward R · 2008: -21.6pp · 2024: -33.6pp
- All cycles
- 2024: R+33.6 2020: R+27.3 2016: R+30.0 2012: R+23.1 2008: R+21.6
Not yet ingested
- Civics
- —
Market trends
- HPI YoY
- ▼ -63.74%
- Current HPI
- 230.2483
- Rent YoY
- ▲ 1.52%
- Metro
- Spartanburg, SC
- State GDP YoY
- ▲ 4.51%
- F500 in state
- 2
Industry mix (Fortune 500 HQ in SC)
| Industry | F500 HQs | Revenue |
|---|---|---|
| Packaging | 1 | $7B |
|
||
Price history
1 event — show timeline
- 2026-06-08 Listed $249,999 Greater Greenville MLS
Property tax history
+15.4%/yrLatest (2025): $1,332 · +0.8% YoY. Source: county tax records.
Cash-flow waterfall
monthlySold comps — $/sqft
last 12 mo · ≤1 miLoading sold comps…