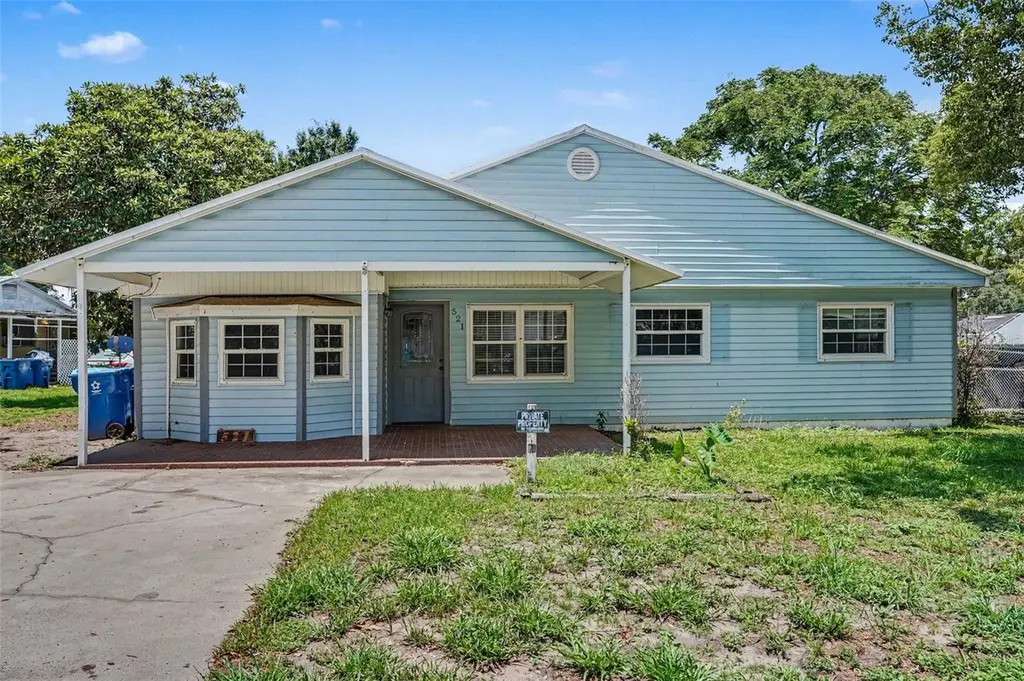
521 Green Cir · Fort Meade, FL
Flood risk 1/10 · Minimal
- FEMA flood zone
- X (unshaded)
- Chance of flooding over 30 yrs
- 0.0%
- Est. flood insurance / yr
- $507 – $1,088
Fire risk 6/10 · Moderate
- Est. fire insurance / yr
- $947 – $1,759
Heat risk 8/10 · Major
- Hot days now (above 108°F)
- 7 days/yr
- Hot days in 30 yrs
- 25 days/yr
Wind risk 9/10 · Severe
- Chance of severe wind over 30 yrs
- 99.0%
Air-quality risk 2/10 · Minimal
- Unhealthy air days now
- 2 days/yr
- Unhealthy air days in 30 yrs
- 2 days/yr
Risk factors via First Street. Map © Google.
Why this score? — see what drove the C- grade
The composite is a weighted blend of 9 inputs, each scored 0–100. Each bar is that input's sub-score; the figure is the points it added to the 100-point composite (weight × sub-score).
- Cash flow +14.4/30.0
- Appreciation +10.0/10.0
- ARV discount +7.5/15.0
- DSCR +4.4/10.0
- Schools +3.5/10.0
- Livability +3.1/5.0
- 1% rule +3.0/10.0
- Rent growth +2.5/5.0
- Condition / age +2.5/5.0
$200,000
🖨 Deal sheet 📄 Offer letter ✓ Due diligence
Listing remarks
Welcome to this spacious 5-bedroom, 2-bathroom home located in Fort Meade, Florida. Offering plenty of room for comfortable living, this property is a great opportunity for buyers needing extra bedrooms, flexible space, or room to grow. The home features a large backyard, ideal for outdoor entertaining, family gatherings, pets, gardening, or simply enjoying Florida’s beautiful weather. Major updates include a 2-year-old A/C system with approximately 8 years of warranty remaining, providing added comfort and peace of mind. The electrical panel has also been recently updated, adding extra value for the next owner. Conveniently located near local shops, schools, and everyday amenities, t
Key facts
- Near schools
- Large backyard
- Near local shops
Tags
Property features AI
Finance
- Other: Property is homesteaded; Zoned R-1B; Lot about 0.26 acres (approx. 1/4 to less than 1/2 acre)
- Financial info: No additional financial details provided
- HOA & community: No HOA; Pets allowed
Exterior
- Parking: Parking details not provided
- Security: No security features listed
- Utilities: Public water; Public sewer; Public utilities
- Home design: Single-family residence; One story; South-facing
- Construction: Block construction; Other roof type; Slab foundation; Built area approximately 1,988 square feet
- Exterior features: Asphalt road access
Interior
- Kitchen: Refrigerator included
- Bedrooms: 5 bedrooms
- Flooring: Vinyl flooring; Other flooring types
- Bathrooms: 2 full bathrooms
- Heating & cooling: Central heating (electric); Central air conditioning
- Interior features: No interior features listed
- Laundry & utility: Indoor laundry with washer hookup
Neighborhood map
What this means for you Summary
Snapshot
- This is a 3-bed/2.0-bath single-family listed at $200k.
Deal economics
- At list price, monthly cash flow is $41 ($497/yr) — positive.
- The deal already cash-flows at list — no discount required.
- To meet the 1% rule (rent ≥ 1% of price), the offer needs to be $160k (20.1% below list).
- Recommended offer: $160k (20.1% below list) — sets the bar for 1% rule.
Location & tenants
- Location reads 61/100 on livability (#779 in FL) — a middle-class / working-renter tenant base. Strengths: cost of living A+, housing A+; Watch: schools D-, amenities F, commute F.
- Polk (suburban): math 39% / reading 43% proficiency, ranked #62 of 73 in FL (top 85%) — families likely to look elsewhere, expect single-tenant / working-renter base with shorter leases.
- Market conditions: 119 active listings in the ZIP; 10,384 units permitted in Polk County in 2024 (1,716 in 5+ unit buildings).
Forward outlook
- In year one you build about $21k of equity ($1k loan paydown + $20k appreciation (10.0% local appreciation)).
- Polk County population projected at +33% by 2050 — long-run rental-demand tailwind backs the buy-and-hold thesis.
- At projected returns (10.0% appreciation + 3.0% rent growth), your $56k cash investment doubles in ~3 years — after that, you're playing with house money.
- By year 2, paydown + projected appreciation supports a ~$34k cash-out refi (75% LTV) — recoverable capital for the next deal without selling this one.
Negotiation context
- Only 6 days on market — expect competitive offers; lowballing is unlikely to land.
- Current owner paid $80k; list at $200k implies a 149% gain — meaningful room to come down on a strong offer.
Risks & watch-outs
- Watch-outs: built in 1954 — expect roof / HVAC / electrical / plumbing capex.
- Climate carrying-cost: severe wind risk, 99% chance of damaging wind over 30y; major wildfire risk; extreme-heat days projected 7→25/yr by 2055 (HVAC capex compounding) — expect insurance premiums to compound above CPI over the hold.
Questions for the listing agent
- Built in 1954 — when were the roof, HVAC, electrical panel, plumbing, and water heater last replaced?
- Is there a deadline driving the sale (1031 exchange, divorce, estate, relocation)? That informs how much negotiation room exists.
- Schools are D-rated, which usually means shorter tenancies and higher turnover. Who's the typical renter profile here, and what's been the actual vacancy rate?
- What's the average days-on-market for RENTAL listings here right now (not sales)? A rising rental-DOM trend means longer vacancies and softer asking-rent achievability than the comps imply.
- What's the recent tenant-quality profile in this submarket — average credit score on applications, eviction rate, late-payment / NSF rate, and stable-employment percentage? A property-management company in the area should have these aggregated.
- How much new for-sale + rental construction is in the pipeline within 1–3 miles? Heavy new supply typically softens prices + rents 12–24 months out; constrained supply supports both.
Investment metrics
- 1% rule
- 0.80% ✗
- Cap rate
- 6.54%
- Cash-on-cash
- 0.89%
- DSCR
- 1.04
- GRM
- 10.4
CMA / ARV
No comps found within radius.
Projected returns pro-forma
10.0% appreciation · 3.0% rent growth · sell at horizon
- IRR
- 24.9%
- Equity multiple
- 2.99×
- Total profit
- $111,489
- Equity at exit
- $180,176
- IRR
- 22.0%
- Equity multiple
- 6.82×
- Total profit
- $326,093
- Equity at exit
- $388,556
Cash invested: $56,000 (down + closing). Projections, not guarantees.
Landlord ↔ Tenant lean methodology
- Overall (STATE)
- 87 Strongly Landlord-Friendly
- State Florida
- 87 Strongly Landlord-Friendly · R+3
- County
- — inherits STATE
- City
- — inherits STATE
ZIP-level market 33841
- Home prices YoY
- 7.7%
- Active inventory
- 119
- Price-to-rent
- 10.4×
Monthly cashflow live
- Estimated rent
- $1,599 medium interval (Pro) →
- Mortgage (P&I)
- −$1,049
- Tax from tax record
- −$90 /mo · $1,075/yr
- Insurance
- −$83
- HOA
- −$0
- Vacancy / Maint / Mgmt
- −$336
- Net cashflow
- $41
Break-even live
UW: 25.0% down · 7.5% · 30yr · 1.5% tax · 5.0% vac · 8.0% maint · 8.0% mgmt
Financing live
Cash to close
- Down payment
- $50,000
- Closing costs
- $6,000
- Reserves months
- —
- Total cash needed
- —
Loan-product check · same deal, 3 products live
Conventional
25% down · 7.5% · 30yr
- Down + closing
- —
- Monthly P&I
- —
- Monthly cashflow
- —
- DSCR
- —
- Eligible?
- —
Personal DTI + credit; lowest rate.
DSCR
20% down · 8.5% · 30yr
- Down + closing
- —
- Monthly P&I
- —
- Monthly cashflow
- —
- DSCR
- —
- Eligible?
- —
No personal income docs; deal must DSCR.
Hard money
10% down · 12.0% · 12mo
- Down + closing
- —
- Monthly P&I
- —
- Monthly cashflow
- —
- DSCR
- —
- Eligible?
- —
Short-term bridge; refi at stabilization.
Listing history 7 events
-
2026-06-18days on market $200,000 Active 6 DOM
-
2026-06-18price $200,000 Active 5 DOM
-
2026-06-17days on market $220,000 Active 5 DOM
-
2026-06-16days on market $220,000 Active 4 DOM
-
2026-06-15days on market $220,000 Active 3 DOM
-
2026-06-13remarks 693-char remark
-
2026-06-13$220,000 Active 1 DOM
ⓘ Source: listings_history table (triggers on properties + properties_extension) + one-shot
backfill from property_details.listing_events for pre-trigger history.
Tax reassessment forecast FL · Resets to sale price
- Current annual tax
- $1,075 · $90/mo
- Projected year-2 tax
- $1,660 · $138/mo
- Expected delta
- +$585/yr (+$49/mo · 54.5%)
ⓘ Screening estimate from a state-policy table — verify with the county assessor before closing.
Climate risk First Street
- Flood 1/10 Low FEMA zone X (unshaded) · 0% chance over 30 yrs
- Wildfire 6/10 Major
- Heat 8/10 Severe 7 d/yr ≥108°F today · 25 d/yr by 30 yrs out
- Wind 9/10 Extreme 99% chance of damaging wind over 30 yrs
- Air quality 2/10 Low 2 unhealthy d/yr today · 2 by 30 yrs out
Nearby sold comps map
Loading sold comps map…
Walkable amenities ~0.75 mi
Loading nearby amenities…
Taxation est. · year 1
- Rental income
- $19,187
- − Mortgage interest
- −$11,203
- − Property taxes
- −$1,075
- − Insurance
- −$1,000
- − Repairs & maintenance
- −$1,535
- − Management
- −$1,535
- − Depreciation
- −$5,818
- Taxable loss
- −$2,979
- Est. tax savings @ 24.0%
- +$715
- After-tax cash flow
- $1,212/yr
For passive investors: Depreciation is non-cash, so a rental often shows a tax loss while cash-flowing — sheltering income. Rental losses are passive: they offset passive income freely, and up to $25,000/yr can offset ordinary (W-2) income if you actively participate and your MAGI is under $100k (phasing out to $0 by $150k); unused losses carry forward. On sale, claimed depreciation is recaptured at up to 25%, and gains may owe capital-gains tax (a 1031 exchange can defer both). Figures are a year-1 estimate at your 24.0% rate — not tax advice; consult a CPA.
Schools (NCES district)
- District
- Polk
- NCES district ID
- 1201590
- Math proficiency
- 39% ▼ -11.00%
- Reading proficiency
- 43% ▼ -4.00%
- Median HH income
- $43,979
- Composite
- 34.74/100
- National rank
- #5132
- State rank
- #62 of 73 in FL
Livability — Fort Meade
- Score
- 61/100
- State rank
- #779
- US rank
- #17625
Category grades
Schools grade is shown separately in the Schools card above.
Census & demographics
- Census place
- Fort Meade, FL
- Population (ZIP)
- 8,268
Population outlook (Polk County) Hauer SSP2
- Today (2025)
- 752,975 people
- By 2030
- 804,621 · +6.9%
- By 2040
- 906,117 · +20.3%
- By 2050
- 1,000,476 · +32.9%
- By 2075
- 1,197,520 · +59.0%
- By 2100
- 1,271,518 · +68.9%
Race, ethnicity, and origin ACS 2023
- Neighborhood character
- Diverse neighborhood (Simpson 0.59)
- Race & ethnicity
- White 50% Hispanic / Latino 38% Two or more races 13% Black 9%
- Hispanic origin (detail)
- Mexican 32% Puerto Rican 3%
- Common ancestry
- Slovak 1% Lithuanian 1%
- Foreign-born
- 11% · Canada, Jamaica
- Languages at home
- 70% English-only · Spanish 30%
Political lean MEDSL · Polk
- 2024 margin
- Strong R (+20.7) · D 39.2% · R 59.9%
- 2008→2024 swing
- -14.6pp toward R · 2008: -6.1pp · 2024: -20.7pp
- All cycles
- 2024: R+20.7 2020: R+14.4 2016: R+14.1 2012: R+6.8 2008: R+6.1
Not yet ingested
- Civics
- —
Market trends
- HPI YoY
- ▲ 26.92%
- Current HPI
- 376.8183
- Rent YoY
- —
- Metro
- —
- State GDP YoY
- ▲ 3.28%
- F500 in state
- 36
Industry mix (Fortune 500 HQ in FL)
| Industry | F500 HQs | Revenue |
|---|---|---|
| Industrial Technology | 2 | $29B |
|
||
| Insurance | 2 | $17B |
|
||
| Retail | 1 | $60B |
|
||
| Technology Distribution | 1 | $58B |
|
||
| Homebuilding | 1 | $35B |
|
||
| Technology Manufacturing | 1 | $35B |
|
||
Price history
+465.6% since first listed4 events — show timeline
- 2026-06-12 Listed $220,000 Stellar MLS as Distributed by MLS Grid
- 2020-04-30 Sold (Public Records) $80,400 Public Records
- 2014-04-29 Sold (Public Records) $87,500 Public Records
- 1986-10-01 Sold (Public Records) $38,900 Public Records
Property tax history
+5.5%/yrLatest (2025): $1,075 · +3.3% YoY. Source: county tax records.
Cash-flow waterfall
monthlySold comps — $/sqft
last 12 mo · ≤1 miLoading sold comps…