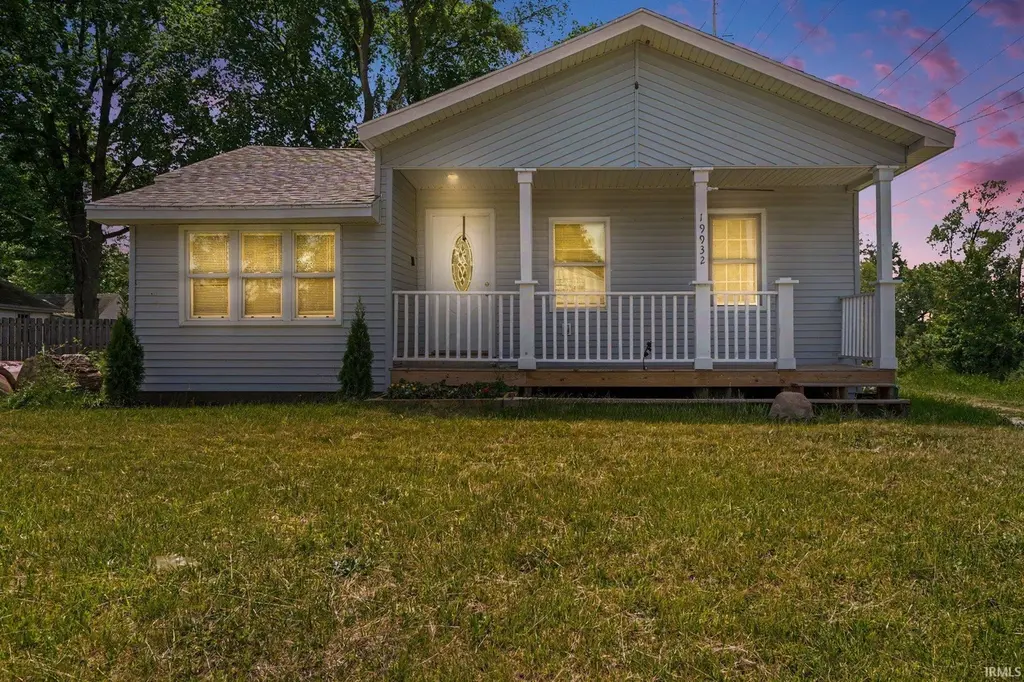
19932 Auten Rd · South Bend, IN
Flood risk 1/10 · Minimal
- FEMA flood zone
- X (unshaded)
- Chance of flooding over 30 yrs
- 0.0%
- Est. flood insurance / yr
- $473 – $860
Fire risk 1/10 · Minimal
- Est. fire insurance / yr
- $717 – $1,331
Heat risk 2/10 · Minimal
- Hot days now (above 100°F)
- 7 days/yr
- Hot days in 30 yrs
- 16 days/yr
Wind risk 2/10 · Minimal
- Chance of severe wind over 30 yrs
- —
Air-quality risk 3/10 · Minor
- Unhealthy air days now
- 3 days/yr
- Unhealthy air days in 30 yrs
- 3 days/yr
Risk factors via First Street. Map © Google.
Why this score? — see what drove the D- grade
The composite is a weighted blend of 9 inputs, each scored 0–100. Each bar is that input's sub-score; the figure is the points it added to the 100-point composite (weight × sub-score).
- Cash flow +17.3/30.0
- DSCR +5.4/10.0
- 1% rule +4.0/10.0
- Livability +3.2/5.0
- Rent growth +2.5/5.0
- Condition / age +2.5/5.0
- Schools +1.4/10.0
- ARV discount +0.0/15.0
- Appreciation +0.0/10.0
$199,900
🖨 Deal sheet (PDF) 📄 Offer letter ✓ Due diligence
Listing remarks MLS
Nice Remodeled 3 Bedroom and 2 Bath home with a basement and a 2 car Garage comes with a Microwave, Fridge, Stove and Built in dish washer. Nice open concept living room area and kitchen. New Roof on the house, New Furnace, New hot water heater, New Sliding, New windows also new plumbing.
Key facts
- Covered front porch
- Engineered flooring
- Newer roof
Tags
Property features AI
Exterior
- Parking: Detached 2-car garage
- Utilities: Private well water; Septic tank
- Home design: Single-family residence; Site-built home; One story
- Construction: Vinyl siding; Asphalt shingle roof; Built on a full basement
- Exterior features: Covered porch; Porch
Interior
- Kitchen: Dishwasher; Microwave; Refrigerator; Gas range
- Bedrooms: Total rooms: 5
- Flooring: Hardwood; Tile
- Bathrooms: 2 full bathrooms (both on the main level)
- Heating & cooling: Natural gas forced-air heating; Central air conditioning; Ceiling fans
- Interior features: Walk-in closets; Ceiling fans; Laminate countertops; Full basement
- Laundry & utility: Washer and dryer included; Main-level laundry; Gas water heater
Neighborhood map
What this means for you Summary
Snapshot
- This is a 3-bed/1.0-bath single-family listed at $200k.
Deal economics
- At list price, monthly cash flow is $147 ($2k/yr) — positive.
- The deal already cash-flows at list — no discount required.
- To meet the 1% rule (rent ≥ 1% of price), the offer needs to be $180k (10.2% below list).
- Recommended offer: $180k (10.2% below list) — sets the bar for 1% rule.
- Cap rate 7.2% vs local median 4.3% in South Bend — top-decile yield for the area; either an underpriced asset or a hidden risk that comps aren't pricing in. Stress-test before assuming the spread holds.
Location & tenants
- Location reads 64/100 on livability (#365 in IN) — a middle-class / working-renter tenant base. Strengths: cost of living A+, housing A+, health & safety A+; Watch: amenities D, employment D, crime F.
- South Bend Community School Corporation (urban): math 12% / reading 21% proficiency, ranked #284 of 301 in IN (top 94%) — low school quality limits family demand, transient renter base, plan for 1-2y turnover; 66% free/reduced lunch — lower-income household profile, screen leases tightly.
- Zoned schools: Darden Elementary School (math 12% / reading 16%, grade F, #874 of 994 statewide, top 89%, 522 students, 78% FRL); Lasalle Academy (math 23% / reading 53%, grade F, #136 of 330 statewide, top 44%, 488 students, 56% FRL); Clay High School (math 17% / reading 52%, grade F, #270 of 369 statewide, top 77%, 628 students, 65% FRL) — zoned schools at 66% FRL track the district average.
- Zoned-school proficiency averages 29% at this address vs 16% district-wide (+12 pts) — the actual schools serving this property are materially stronger than the South Bend Community School Corporation average implies; a family-tenant draw the district grade alone would hide.
- Market conditions: 114 active listings in the ZIP; 1 comparable units currently listed for rent nearby; 754 units permitted in St. Joseph County in 2024 (460 in 5+ unit buildings).
Forward outlook
- Local home prices are declining (-3.0%/yr); year-one equity from $1k of loan paydown is wiped out by about $6k of value loss. Plan a longer hold.
Negotiation context
- It's been on market 17 days — a 2% lower offer ($197k) is reasonable based on typical stale-listing flexibility.
- 2 sale attempts since 3y ago with the ask held roughly flat each time — persistent listings suggest the price (not the market) is what's stuck; bring a comps-based counter.
Risks & watch-outs
- Watch-outs: built in 1924 — expect roof / HVAC / electrical / plumbing capex.
Questions for the listing agent
- Built in 1924 — when were the roof, HVAC, electrical panel, plumbing, and water heater last replaced?
- Is there a deadline driving the sale (1031 exchange, divorce, estate, relocation)? That informs how much negotiation room exists.
- Schools are F-rated, which usually means shorter tenancies and higher turnover. Who's the typical renter profile here, and what's been the actual vacancy rate?
- Crime grade is F in this area — have there been break-ins, vandalism, or insurance claims at this property in the last 3 years? What carrier currently insures it and at what premium?
- The area grade is low — what's the realistic commute time and amenity access for the typical tenant pool here? Any planned neighborhood developments (good or bad) we should know about?
- What's the average days-on-market for RENTAL listings here right now (not sales)? A rising rental-DOM trend means longer vacancies and softer asking-rent achievability than the comps imply.
- What's the recent tenant-quality profile in this submarket — average credit score on applications, eviction rate, late-payment / NSF rate, and stable-employment percentage? A property-management company in the area should have these aggregated.
- How much new for-sale + rental construction is in the pipeline within 1–3 miles? Heavy new supply typically softens prices + rents 12–24 months out; constrained supply supports both.
Investment metrics
- 1% rule
- 0.90% ✗
- Cap rate
- 7.17%
- Cash-on-cash
- 3.14%
- DSCR
- 1.14
- GRM
- 9.3
CMA / ARV
- ARV (on-the-fly)
- $163,096
- Comps found
- 12
Show comp detail 12 sales within ~0.75 mi
| Address | Dist | Beds/Ba | Sqft | Sold | Price | $/sf | Match |
|---|---|---|---|---|---|---|---|
| 20139 Oakdale Ave | 0.31mi | 2/1.0 (-1) | 1,080 (+1%) | 13mo | $200,000 | $185 | 69 |
| 20066 Sarah St | 0.31mi | 2/1.0 (-1) | 1,065 (-1%) | 16mo | $102,000 | $96 | 66 |
| 19602 Greenacre St | 0.63mi | 3/1.0 | 1,080 (+1%) | 5mo | $169,900 | $157 | 65 |
| 51651 Hollyhock Rd | 0.62mi | 3/1.0 | 1,120 (+4%) | 3mo | $163,000 | $146 | 61 |
| 19959 Kelley St | 0.61mi | 2/1.0 (-1) | 1,086 (+1%) | 9mo | $112,000 | $103 | 57 |
| 19572 Oakdale Ave | 0.35mi | 3/1.0 | 1,164 (+8%) | 19mo | $240,000 | $206 | 54 |
| 19801 Greenacre St | 0.63mi | 2/1.0 (-1) | 984 (-8%) | 2mo | $175,000 | $178 | 50 |
| 19638 Auten Rd | 0.22mi | 2/1.0 (-1) | 1,218 (+14%) | 20mo | $120,000 | $99 | 45 |
| 52090 Oakland Ave | 0.65mi | 3/1.0 | 1,012 (-6%) | 20mo | $205,000 | $203 | 44 |
| 19225 Auten Rd | 0.66mi | 4/1.0 (+1) | 1,172 (+9%) | 17mo | $178,500 | $152 | 34 |
| 19204 Helen Ave | 0.70mi | 2/1.0 (-1) | 984 (-8%) | 20mo | $145,000 | $147 | 32 |
| 19444 Greenacre St | 0.73mi | 2/1.0 (-1) | 1,212 (+13%) | 8mo | $162,500 | $134 | 32 |
Match score weights: distance 35% · size 25% · config 20% · recency 20%. Top-matched comps best support the ARV.
Projected returns pro-forma
-3.0% appreciation · 3.0% rent growth · sell at horizon
- IRR
- -11.4%
- Equity multiple
- 0.59×
- Total profit
- $-23,098
- Equity at exit
- $29,806
- IRR
- -2.2%
- Equity multiple
- 0.85×
- Total profit
- $-8,257
- Equity at exit
- $17,284
Cash invested: $55,972 (down + closing). Projections, not guarantees.
Landlord ↔ Tenant lean methodology
- Overall (STATE)
- 90 Strongly Landlord-Friendly
- State Indiana
- 90 Strongly Landlord-Friendly · R+11
- County
- — inherits STATE
- City
- — inherits STATE
ZIP-level market 46637
- Active inventory
- 114
- Price-to-rent
- 9.3×
Monthly cashflow live
- Estimated rent
- $1,795 medium interval (Pro) →
- Mortgage (P&I)
- −$1,048
- Tax from tax record
- −$140 /mo · $1,679/yr
- Insurance
- −$83
- HOA
- −$0
- Vacancy / Maint / Mgmt
- −$377
- Net cashflow
- $147
Break-even live
Sensitivity live
| Price | -10% $260 | -5% $203 | +0% $147 | +5% $90 | +10% $33 |
|---|---|---|---|---|---|
| Rent | -10% $5 | -5% $76 | +0% $147 | +5% $217 | +10% $288 |
| Rate | -1.0pp $247 | -0.5pp $197 | base $147 | +0.5pp $95 | +1.0pp $42 |
UW: 25.0% down · 7.5% · 30yr · 1.5% tax · 5.0% vac · 8.0% maint · 8.0% mgmt
Financing live
Cash to close
- Down payment
- $49,975
- Closing costs
- $5,997
- Reserves months
- —
- Total cash needed
- —
Loan-product check · same deal, 3 products live
Conventional
25% down · 7.5% · 30yr
- Down + closing
- —
- Monthly P&I
- —
- Monthly cashflow
- —
- DSCR
- —
- Eligible?
- —
Personal DTI + credit; lowest rate.
DSCR
20% down · 8.5% · 30yr
- Down + closing
- —
- Monthly P&I
- —
- Monthly cashflow
- —
- DSCR
- —
- Eligible?
- —
No personal income docs; deal must DSCR.
Hard money
10% down · 12.0% · 12mo
- Down + closing
- —
- Monthly P&I
- —
- Monthly cashflow
- —
- DSCR
- —
- Eligible?
- —
Short-term bridge; refi at stabilization.
Rent comps 1 comps
| Address | Beds | Baths | Sqft | Rent | $/sqft | DOM | Units | Dist |
|---|---|---|---|---|---|---|---|---|
| 924 Merrill Ct S Unit 924 South Bend, IN | 2.0 | 1.5 | 1263 | $1,795 | $1.42 | 15d | 1 | 0.61mi |
Listing history 12 events
-
2026-06-22days on market $199,900 Active 17 DOM
-
2026-06-18days on market $199,900 Active 14 DOM
-
2026-06-17days on market $199,900 Active 13 DOM
-
2026-06-16days on market $199,900 Active 12 DOM
-
2026-06-15days on market $199,900 Active 11 DOM
-
2026-06-14days on market $199,900 Active 9 DOM
-
2026-06-13days on market $199,900 Active 8 DOM
-
2026-06-10days on market $199,900 Active 6 DOM
-
2026-06-09days on market $199,900 Active 5 DOM
-
2026-06-08days on market $199,900 Active 4 DOM
-
2026-06-07remarks 693-char remark
-
2026-06-07$199,900 Active 3 DOM
ⓘ Source: listings_history table (triggers on properties + properties_extension) + one-shot
backfill from property_details.listing_events for pre-trigger history.
Tax reassessment forecast IN · Partial reset (capped growth)
- Current annual tax
- $1,679 · $140/mo
- Projected year-2 tax
- $1,689 · $141/mo
- Expected delta
- +$10/yr (+$1/mo · 0.6%)
ⓘ Screening estimate from a state-policy table — verify with the county assessor before closing.
Climate risk First Street
- Flood 1/10 Low FEMA zone X (unshaded) · 0% chance over 30 yrs
- Wildfire 1/10 Low
- Heat 2/10 Low 7 d/yr ≥100°F today · 16 d/yr by 30 yrs out
- Wind 2/10 Low
- Air quality 3/10 Moderate 3 unhealthy d/yr today · 3 by 30 yrs out
Nearby sold comps map
Loading sold comps map…
Walkable amenities ~0.75 mi
Loading nearby amenities…
Taxation est. · year 1
- Rental income
- $21,540
- − Mortgage interest
- −$11,198
- − Property taxes
- −$1,679
- − Insurance
- −$1,000
- − Repairs & maintenance
- −$1,723
- − Management
- −$1,723
- − Depreciation
- −$5,815
- Taxable loss
- −$1,597
- Est. tax savings @ 24.0%
- +$383
- After-tax cash flow
- $2,142/yr
For passive investors: Depreciation is non-cash, so a rental often shows a tax loss while cash-flowing — sheltering income. Rental losses are passive: they offset passive income freely, and up to $25,000/yr can offset ordinary (W-2) income if you actively participate and your MAGI is under $100k (phasing out to $0 by $150k); unused losses carry forward. On sale, claimed depreciation is recaptured at up to 25%, and gains may owe capital-gains tax (a 1031 exchange can defer both). Figures are a year-1 estimate at your 24.0% rate — not tax advice; consult a CPA.
Schools (NCES district)
- District
- South Bend Community School Corporation
- NCES district ID
- 1810290
- Math proficiency
- 12% ▼ -10.00%
- Reading proficiency
- 21% ▼ -6.00%
- Median HH income
- $41,935
- Composite
- 14.21/100
- National rank
- #9452
- State rank
- #284 of 301 in IN
Livability — South Bend
- Score
- 64/100
- State rank
- #365
- US rank
- #13730
Category grades
Schools grade is shown separately in the Schools card above.
Census & demographics
- City population
- 99,767
- Population (ZIP)
- 16,079
Population outlook (St. Joseph County) Hauer SSP2
- Today (2025)
- 273,186 people
- By 2030
- 273,594 · +0.1%
- By 2040
- 271,641 · -0.6%
- By 2050
- 269,187 · -1.5%
- By 2075
- 263,136 · -3.7%
- By 2100
- 245,659 · -10.1%
Race, ethnicity, and origin ACS 2023
- Neighborhood character
- Predominantly White (71%)
- Race & ethnicity
- White 71% Black 17% Two or more races 6% Asian 4% Hispanic / Latino 3%
- Common ancestry
- Romanian 11% Italian 3% Iranian 3%
- Foreign-born
- 9% · China, Canada, Vietnam
- Languages at home
- 91% English-only · Spanish 2% Chinese 2% Other Indo-European 1%
Political lean MEDSL · St. Joseph
- 2024 margin
- Toss-up / Even · D 50.0% · R 48.5% · Other 1.5%
- 2008→2024 swing
- -15.6pp toward R · 2008: 17.1pp · 2024: 1.5pp
- All cycles
- 2024: D+1.5 2020: D+5.8 2016: D+0.2 2012: D+3.5 2008: D+17.1
Not yet ingested
- Civics
- —
Market trends
- HPI YoY
- ▼ -128.33%
- Current HPI
- 210.1124
- Rent YoY
- —
- Metro
- —
- State GDP YoY
- ▲ 2.90%
- F500 in state
- 18
Industry mix (Fortune 500 HQ in IN)
| Industry | F500 HQs | Revenue |
|---|---|---|
| Industrial Machinery | 2 | $37B |
|
||
| Healthcare | 1 | $177B |
|
||
| Pharmaceuticals | 1 | $45B |
|
||
| Metals / Steel | 1 | $18B |
|
||
| Agriculture | 1 | $17B |
|
||
| Packaging | 1 | $12B |
|
||
Price history
-0.0% since first listed5 events — show timeline
- 2026-06-04 Listed $199,900 IRMLS
- 2023-11-21 Sold (MLS) $185,000 IRMLS
- 2023-09-25 Pending — IRMLS
- 2023-09-07 Price Changed $194,500 IRMLS
- 2023-08-14 Listed $199,999 IRMLS
Property tax history
+4.6%/yrLatest (2024): $1,679 · +267.4% YoY. Source: county tax records.
Cash-flow waterfall
monthlySold comps — $/sqft
last 12 mo · ≤1 miLoading sold comps…