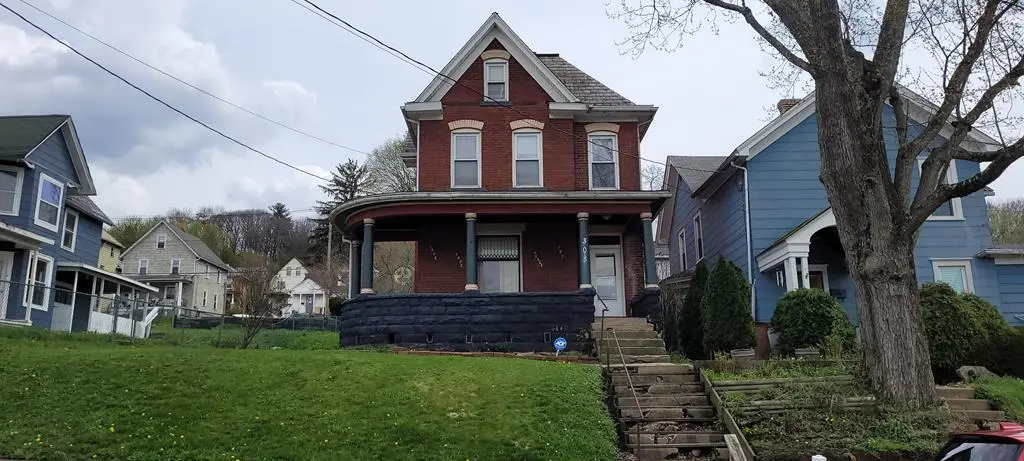
303 Hone Ave · Oil City, PA
Flood risk 1/10 · Minimal
- FEMA flood zone
- X (unshaded)
- Chance of flooding over 30 yrs
- 0.0%
- Est. flood insurance / yr
- $473 – $860
Fire risk 3/10 · Minor
- Est. fire insurance / yr
- $511 – $949
Heat risk 3/10 · Minor
- Hot days now (above 92°F)
- 7 days/yr
- Hot days in 30 yrs
- 19 days/yr
Wind risk 1/10 · Minimal
- Chance of severe wind over 30 yrs
- —
Air-quality risk 2/10 · Minimal
- Unhealthy air days now
- 1 days/yr
- Unhealthy air days in 30 yrs
- 2 days/yr
Risk factors via First Street. Map © Google.
Why this score? — see what drove the B- grade
The composite is a weighted blend of 9 inputs, each scored 0–100. Each bar is that input's sub-score; the figure is the points it added to the 100-point composite (weight × sub-score).
- Cash flow +30.0/30.0
- DSCR +10.0/10.0
- 1% rule +9.7/10.0
- Appreciation +6.1/10.0
- Livability +3.6/5.0
- Schools +2.7/10.0
- Rent growth +2.5/5.0
- Condition / age +2.5/5.0
- ARV discount +0.0/15.0
$70,000
🖨 Deal sheet 📄 Offer letter ✓ Due diligence
Listing remarks MLS
This Victorian home has all the woodwork of its time. Hardwood floors, high baseboards and a nice staircase. Updated bathroom. There is bonus space on the third floor with the three rooms. * Property is being sold as is, where is with no warranty or repair.
Key facts
- Bonus space
- Hardwood floors
- High baseboards
Tags
Neighborhood map
What this means for you Summary
Snapshot
- This is a 3-bed/1.0-bath single-family listed at $70k.
Deal economics
- At list price, monthly cash flow is $294 ($4k/yr) — positive.
- The deal already cash-flows at list — no discount required.
- Meets the 1% rule at list price ($1k rent vs $70k).
- Recommended offer: $66k (6.0% below list) — sets the bar for market timing.
Location & tenants
- Location reads 71/100 on livability (#704 in PA) — a middle-class / working-renter tenant base. Strengths: crime A+, cost of living A+, housing A+; Watch: amenities F, commute F, employment F.
- Oil City Area SD (town): math 20% / reading 46% proficiency, ranked #436 of 539 in PA (top 81%) — families likely to look elsewhere, expect single-tenant / working-renter base with shorter leases.
- Market conditions: 53 active listings in the ZIP; 3 comparable units currently listed for rent nearby; rentals lingering (median 44d on market — plan ~5-8 weeks vacancy on turnover, expect pricing pressure); 100% of comp listings sitting > 30 days — soft ceiling on asking rent; 42 units permitted in Venango County in 2024 (0 in 5+ unit buildings).
Forward outlook
- In year one you build about $2k of equity ($484 loan paydown + $2k appreciation (2.2% local appreciation)).
- Venango County population projected at -30% by 2050 — secular population decline; favor cash flow + early exit over multi-decade hold.
- At projected returns (2.2% appreciation + 3.0% rent growth), your $20k cash investment doubles in ~4 years — after that, you're playing with house money.
Negotiation context
- It's been on market 63 days — a 6% lower offer ($66k) is reasonable based on typical stale-listing flexibility.
Risks & watch-outs
- Watch-outs: built in 1897 — expect roof / HVAC / electrical / plumbing capex.
Questions for the listing agent
- It's been on market 63 days. Have you received any prior offers? Is the seller open to a 6% concession, seller financing, or rate buy-down credit?
- Built in 1897 — when were the roof, HVAC, electrical panel, plumbing, and water heater last replaced?
- Why hasn't it sold? Are there any deal-killer items the seller is aware of (foundation, flood, title, zoning, code violations)?
- Is there a deadline driving the sale (1031 exchange, divorce, estate, relocation)? That informs how much negotiation room exists.
- What's the average days-on-market for RENTAL listings here right now (not sales)? A rising rental-DOM trend means longer vacancies and softer asking-rent achievability than the comps imply.
- What's the recent tenant-quality profile in this submarket — average credit score on applications, eviction rate, late-payment / NSF rate, and stable-employment percentage? A property-management company in the area should have these aggregated.
- How much new for-sale + rental construction is in the pipeline within 1–3 miles? Heavy new supply typically softens prices + rents 12–24 months out; constrained supply supports both.
Investment metrics
- 1% rule
- 1.47% ✓
- Cap rate
- 11.34%
- Cash-on-cash
- 18.03%
- DSCR
- 1.80
- GRM
- 5.6
CMA / ARV
- ARV (median comp)
- $55,591
- List price
- $70,000
- Delta
- 25.92%
- Verdict
- OVERPRICED
- Comps
- 20 within 1.0 mi
Show comp detail 9 sales within ~0.75 mi
| Address | Dist | Beds/Ba | Sqft | Sold | Price | $/sf | Match |
|---|---|---|---|---|---|---|---|
| 289 Cedar Ave | 0.05mi | 3/2.0 | 1,597 (-3%) | 13mo | $114,000 | $71 | 78 |
| 272 Linden Ave | 0.12mi | 3/1.0 | 1,560 (-5%) | 16mo | $35,000 | $22 | 73 |
| 413 Bissell Ave | 0.19mi | 4/1.5 (+1) | 1,532 (-7%) | 8mo | $169,000 | $110 | 67 |
| 305 Hasson Ave | 0.07mi | 3/1.5 | 1,797 (+10%) | 16mo | $37,500 | $21 | 65 |
| 16 Smithman St | 0.44mi | 3/2.0 | 1,584 (-3%) | 6mo | $115,000 | $73 | 64 |
| 605 Cornplanter Ave | 0.25mi | 2/1.5 (-1) | 1,818 (+11%) | 4mo | $25,500 | $14 | 60 |
| 507 Hoffman Ave | 0.18mi | 4/2.0 (+1) | 1,554 (-5%) | 22mo | $37,000 | $24 | 56 |
| 123 Washington Ave | 0.31mi | 3/1.0 | 1,512 (-8%) | 23mo | $47,000 | $31 | 54 |
| 18 Ellen Dr | 0.73mi | 3/2.0 | 1,728 (+5%) | 12mo | $152,000 | $88 | 43 |
Match score weights: distance 35% · size 25% · config 20% · recency 20%. Top-matched comps best support the ARV.
Projected returns pro-forma
2.18% appreciation · 3.0% rent growth · sell at horizon
- IRR
- 22.7%
- Equity multiple
- 2.24×
- Total profit
- $24,218
- Equity at exit
- $28,278
- IRR
- 24.4%
- Equity multiple
- 4.26×
- Total profit
- $63,866
- Equity at exit
- $41,241
Cash invested: $19,600 (down + closing). Projections, not guarantees.
Landlord ↔ Tenant lean methodology
- Overall (STATE)
- 62 Landlord-Friendly
- State Pennsylvania
- 62 Landlord-Friendly · EVEN
- County
- — inherits STATE
- City
- — inherits STATE
ZIP-level market 16301
- Home prices YoY
- 1.0%
- Active inventory
- 53
- Price-to-rent
- 5.6×
Monthly cashflow live
- Estimated rent
- $1,032 medium interval (Pro) →
- Mortgage (P&I)
- −$367
- Tax from tax record
- −$125 /mo · $1,499/yr
- Insurance
- −$29
- HOA
- −$0
- Vacancy / Maint / Mgmt
- −$217
- Net cashflow
- $294
Break-even live
UW: 25.0% down · 7.5% · 30yr · 1.5% tax · 5.0% vac · 8.0% maint · 8.0% mgmt
Financing live
Cash to close
- Down payment
- $17,500
- Closing costs
- $2,100
- Reserves months
- —
- Total cash needed
- —
Loan-product check · same deal, 3 products live
Conventional
25% down · 7.5% · 30yr
- Down + closing
- —
- Monthly P&I
- —
- Monthly cashflow
- —
- DSCR
- —
- Eligible?
- —
Personal DTI + credit; lowest rate.
DSCR
20% down · 8.5% · 30yr
- Down + closing
- —
- Monthly P&I
- —
- Monthly cashflow
- —
- DSCR
- —
- Eligible?
- —
No personal income docs; deal must DSCR.
Hard money
10% down · 12.0% · 12mo
- Down + closing
- —
- Monthly P&I
- —
- Monthly cashflow
- —
- DSCR
- —
- Eligible?
- —
Short-term bridge; refi at stabilization.
Rent comps 3 comps
| Address | Beds | Baths | Sqft | Rent | $/sqft | DOM | Units | Dist |
|---|---|---|---|---|---|---|---|---|
| 306 Plummer St Oil City, PA | 2.0 | 1.0 | 1084 | $1,000 | $0.92 | 44d | 1 | 0.14mi |
| 211 Central Ave Unit 1 Oil City, PA | 2.0 | 1.0 | 1200 | $1,000 | $0.83 | 44d | 1 | 0.81mi |
| 815 W 1st St Oil City, PA | 4.0 | 1.5 | 1674 | $1,300 | $0.78 | 44d | 1 | 1.42mi |
Listing history 15 events
-
2026-06-18days on market $70,000 Active 63 DOM
-
2026-06-17days on market $70,000 Active 62 DOM
-
2026-06-16days on market $70,000 Active 61 DOM
-
2026-06-15days on market $70,000 Active 60 DOM
-
2026-06-13days on market $70,000 Active 58 DOM
-
2026-06-12days on market $70,000 Active 57 DOM
-
2026-06-09days on market $70,000 Active 54 DOM
-
2026-06-08days on market $70,000 Active 53 DOM
-
2026-06-08days on market $70,000 Active 52 DOM
-
2026-06-07days on market $70,000 Active 51 DOM
-
2026-06-04days on market $70,000 Active 48 DOM
-
2026-06-02days on market $70,000 Active 47 DOM
-
2026-06-01days on market $70,000 Active 46 DOM
-
2026-05-31days on market $70,000 Active 45 DOM
-
2026-04-16$89,900 Active 257-char remark
Show marketing remark (257 chars)
This Victorian home has all the woodwork of its time. Hardwood floors, high baseboards and a nice staircase. Updated bathroom. There is bonus space on the third floor with the three rooms. * Property is being sold as is, where is with no warranty or repair.
ⓘ Source: listings_history table (triggers on properties + properties_extension) + one-shot
backfill from property_details.listing_events for pre-trigger history.
Tax reassessment forecast PA · Partial reset (capped growth)
- Current annual tax
- $1,499 · $125/mo
- Projected year-2 tax
- $1,499 · $125/mo
- Expected delta
- $0/yr ($0/mo · 0.0%)
ⓘ Screening estimate from a state-policy table — verify with the county assessor before closing.
Climate risk First Street
- Flood 1/10 Low FEMA zone X (unshaded) · 0% chance over 30 yrs
- Wildfire 3/10 Moderate
- Heat 3/10 Moderate 7 d/yr ≥92°F today · 19 d/yr by 30 yrs out
- Wind 1/10 Low
- Air quality 2/10 Low 1 unhealthy d/yr today · 2 by 30 yrs out
Nearby sold comps map
Loading sold comps map…
Walkable amenities ~0.75 mi
Loading nearby amenities…
Taxation est. · year 1
- Rental income
- $12,389
- − Mortgage interest
- −$3,921
- − Property taxes
- −$1,499
- − Insurance
- −$350
- − Repairs & maintenance
- −$991
- − Management
- −$991
- − Depreciation
- −$2,036
- Taxable income
- $2,600
- Est. tax owed @ 24.0%
- −$624
- After-tax cash flow
- $2,909/yr
For passive investors: Depreciation is non-cash, so a rental often shows a tax loss while cash-flowing — sheltering income. Rental losses are passive: they offset passive income freely, and up to $25,000/yr can offset ordinary (W-2) income if you actively participate and your MAGI is under $100k (phasing out to $0 by $150k); unused losses carry forward. On sale, claimed depreciation is recaptured at up to 25%, and gains may owe capital-gains tax (a 1031 exchange can defer both). Figures are a year-1 estimate at your 24.0% rate — not tax advice; consult a CPA.
Schools (NCES district)
- District
- Oil City Area SD
- NCES district ID
- 4218090
- Math proficiency
- 20% ▼ -19.00%
- Reading proficiency
- 46% ▼ -10.00%
- Median HH income
- $37,451
- Composite
- 27.39/100
- National rank
- #6973
- State rank
- #436 of 539 in PA
Livability — Oil City
- Score
- 71/100
- State rank
- #704
- US rank
- #6931
Category grades
Schools grade is shown separately in the Schools card above.
Census & demographics
- Census place
- Oil City, PA
- Population (ZIP)
- 15,067
Population outlook (Venango County) Hauer SSP2
- Today (2025)
- 48,827 people
- By 2030
- 46,061 · -5.7%
- By 2040
- 39,989 · -18.1%
- By 2050
- 34,094 · -30.2%
- By 2075
- 22,500 · -53.9%
- By 2100
- 13,659 · -72.0%
Race, ethnicity, and origin ACS 2023
- Neighborhood character
- Predominantly White (93%)
- Race & ethnicity
- White 93% Two or more races 4% Hispanic / Latino 1%
- Common ancestry
- Romanian 7% Iranian 3% Italian 2%
- Foreign-born
- 1%
Political lean MEDSL · Venango
- 2024 margin
- Solid R (+42.1) · D 28.5% · R 70.6%
- 2008→2024 swing
- -22.9pp toward R · 2008: -19.2pp · 2024: -42.1pp
- All cycles
- 2024: R+42.1 2020: R+41.4 2016: R+42.4 2012: R+26.3 2008: R+19.2
Not yet ingested
- Civics
- —
Market trends
- HPI YoY
- ▲ 2.18%
- Current HPI
- 218.0124
- Rent YoY
- —
- Metro
- —
- State GDP YoY
- ▲ 1.68%
- F500 in state
- 34
Industry mix (Fortune 500 HQ in PA)
| Industry | F500 HQs | Revenue |
|---|---|---|
| Healthcare | 2 | $309B |
|
||
| Insurance | 2 | $27B |
|
||
| Telecommunications / Media | 1 | $124B |
|
||
| Industrial Distribution | 1 | $22B |
|
||
| Financial Services | 1 | $20B |
|
||
| Chemicals / Materials | 1 | $18B |
|
||
Price history
1 event — show timeline
- 2026-04-16 Listed $89,900 AVBREALTORS
Property tax history
+1.0%/yrLatest (2026): $1,499 · -1.3% YoY. Source: county tax records.
Cash-flow waterfall
monthlySold comps — $/sqft
last 12 mo · ≤1 miLoading sold comps…