 🏷️ Likely Rental
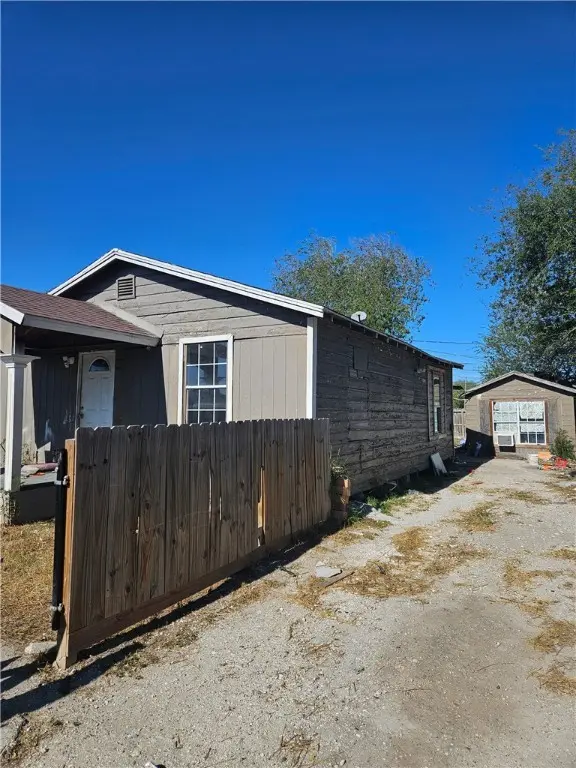
2730 Kitchens St · Corpus Christi, TX
Flood risk 3/10 · Minor
- FEMA flood zone
- X (unshaded)
- Chance of flooding over 30 yrs
- 0.2%
- Est. flood insurance / yr
- $507 – $1,088
Fire risk 1/10 · Minimal
- Est. fire insurance / yr
- $1,222 – $2,270
Heat risk 10/10 · Severe
- Hot days now (above 107°F)
- 6 days/yr
- Hot days in 30 yrs
- 22 days/yr
Wind risk 9/10 · Severe
- Chance of severe wind over 30 yrs
- 99.0%
Air-quality risk 1/10 · Minimal
- Unhealthy air days now
- 0 days/yr
- Unhealthy air days in 30 yrs
- 0 days/yr
Risk factors via First Street. Map © Google.
Why this score? — see what drove the B grade
The composite is a weighted blend of 9 inputs, each scored 0–100. Each bar is that input's sub-score; the figure is the points it added to the 100-point composite (weight × sub-score).
- Cash flow +25.1/30.0
- ARV discount +15.0/15.0
- DSCR +8.2/10.0
- 1% rule +7.7/10.0
- Appreciation +5.7/10.0
- Livability +3.9/5.0
- Schools +2.8/10.0
- Rent growth +2.5/5.0
- Condition / age +2.5/5.0
$70,000
🖨 Deal sheet (PDF) 📄 Offer letter ✓ Due diligence
Listing remarks MLS
Owner was in process of remodeling after previous tenant vacated. Open floor plan needing work to be completed. There is an efficiency apt in back of property that is currently on month to month. Please verify all information including schools.
Key facts
- 4,064 sq ft lot
- Built 1948
- Listed 194 days
Neighborhood map
What this means for you Summary
Snapshot
- This is a 2-bed/1.0-bath single-family listed at $70k.
Deal economics
- At list price, monthly cash flow is $154 ($2k/yr) — positive.
- The deal already cash-flows at list — no discount required.
- Meets the 1% rule at list price ($889 rent vs $70k).
- Recommended offer: $62k (12.0% below list) — sets the bar for market timing.
Location & tenants
- Location reads 78/100 on livability (#66 in TX, #2,404 nationally) — a middle-class / working-renter tenant base. Strengths: commute A+, cost of living A+, housing A+; Watch: crime F.
- Corpus Christi ISD (urban): math 31% / reading 35% proficiency, ranked #562 of 826 in TX (top 68%) — families likely to look elsewhere, expect single-tenant / working-renter base with shorter leases; 63% free/reduced lunch — lower-income household profile, screen leases tightly.
- Zoned schools: Windsor Park G/T (math 85% / reading 90%, grade A+, #6 of 4,322 statewide, top 0%, 609 students, 29% FRL); Adkins Middle (math 40% / reading 39%, grade F, #660 of 1,662 statewide, top 41%, 956 students, 48% FRL); Moody H S (math 33% / reading 26%, grade F, #1,112 of 1,632 statewide, top 70%, 1,382 students, 84% FRL).
- Zoned-school proficiency averages 52% at this address vs 33% district-wide (+19 pts) — the actual schools serving this property are materially stronger than the Corpus Christi ISD average implies; a family-tenant draw the district grade alone would hide.
- Market conditions: 77 active listings in the ZIP; 10 comparable units currently listed for rent nearby; rentals lingering (median 46d on market — plan ~5-8 weeks vacancy on turnover, expect pricing pressure); 80% of comp listings sitting > 30 days — soft ceiling on asking rent; lower-income renter base — watch delinquency; 1,397 units permitted in Nueces County in 2024 (47 in 5+ unit buildings).
Forward outlook
- In year one you build about $1k of equity ($484 loan paydown + $994 appreciation (1.4% local appreciation)).
- Nueces County population projected at +36% by 2050 — long-run rental-demand tailwind backs the buy-and-hold thesis.
- At projected returns (1.4% appreciation + 3.0% rent growth), your $20k cash investment doubles in ~6 years — after that, you're playing with house money.
Negotiation context
- It's been on market 194 days — a 12% lower offer ($62k) is reasonable based on typical stale-listing flexibility.
- 2 sale attempts since 26y ago with the ask held roughly flat each time — persistent listings suggest the price (not the market) is what's stuck; bring a comps-based counter.
- Current owner paid $21k; list at $70k implies a 233% gain — meaningful room to come down on a strong offer.
Risks & watch-outs
- Watch-outs: property tax is 2.6% of price; built in 1948 — expect roof / HVAC / electrical / plumbing capex.
- Climate carrying-cost: severe wind risk, 99% chance of damaging wind over 30y; extreme-heat days projected 6→22/yr by 2055 (HVAC capex compounding) — expect insurance premiums to compound above CPI over the hold.
Questions for the listing agent
- It's been on market 194 days. Have you received any prior offers? Is the seller open to a 12% concession, seller financing, or rate buy-down credit?
- Built in 1948 — when were the roof, HVAC, electrical panel, plumbing, and water heater last replaced?
- Property tax is high relative to price — has the assessment been appealed recently, and will the sale trigger a re-assessment?
- Why hasn't it sold? Are there any deal-killer items the seller is aware of (foundation, flood, title, zoning, code violations)?
- Is there a deadline driving the sale (1031 exchange, divorce, estate, relocation)? That informs how much negotiation room exists.
- Crime grade is F in this area — have there been break-ins, vandalism, or insurance claims at this property in the last 3 years? What carrier currently insures it and at what premium?
- What's the average days-on-market for RENTAL listings here right now (not sales)? A rising rental-DOM trend means longer vacancies and softer asking-rent achievability than the comps imply.
- What's the recent tenant-quality profile in this submarket — average credit score on applications, eviction rate, late-payment / NSF rate, and stable-employment percentage? A property-management company in the area should have these aggregated.
- How much new for-sale + rental construction is in the pipeline within 1–3 miles? Heavy new supply typically softens prices + rents 12–24 months out; constrained supply supports both.
Investment metrics
- 1% rule
- 1.27% ✓
- Cap rate
- 8.93%
- Cash-on-cash
- 9.43%
- DSCR
- 1.42
- GRM
- 6.6
CMA / ARV
- ARV (median comp)
- $88,691
- List price
- $70,000
- Delta
- -21.07%
- Verdict
- UNDERPRICED
- Comps
- 20 within 1.0 mi
Show comp detail 9 sales within ~0.75 mi
| Address | Dist | Beds/Ba | Sqft | Sold | Price | $/sf | Match |
|---|---|---|---|---|---|---|---|
| 2622 Dunbar St | 0.40mi | 2/1.0 | 672 (0%) | 1mo | $88,000 | $131 | 80 |
| 3237 Eisenhower St | 0.12mi | 2/1.0 | 611 (-9%) | 4mo | $65,000 | $106 | 76 |
| 2750 Nogales St | 0.15mi | 2/1.0 | 660 (-2%) | 19mo | $109,900 | $167 | 74 |
| 3621 Cub St | 0.35mi | 2/1.0 | 667 (-1%) | 15mo | $60,000 | $90 | 70 |
| 3746 Macarthur St | 0.36mi | 2/1.0 | 684 (+2%) | 20mo | $55,000 | $80 | 64 |
| 3801 Betel St | 0.56mi | 2/1.0 | 684 (+2%) | 16mo | $76,900 | $112 | 58 |
| 2534 Tarlton St | 0.33mi | 2/1.0 | 595 (-12%) | 14mo | $60,000 | $101 | 54 |
| 641 Cheyenne St | 0.67mi | 1/1.0 (-1) | 720 (+7%) | 13mo | $64,900 | $90 | 41 |
| 1742 Sherman St | 0.69mi | 2/1.0 | 588 (-12%) | 8mo | $87,500 | $149 | 40 |
Match score weights: distance 35% · size 25% · config 20% · recency 20%. Top-matched comps best support the ARV.
Projected returns pro-forma
1.42% appreciation · 3.0% rent growth · sell at horizon
- IRR
- 12.3%
- Equity multiple
- 1.64×
- Total profit
- $12,619
- Equity at exit
- $25,442
- IRR
- 15.6%
- Equity multiple
- 2.98×
- Total profit
- $38,794
- Equity at exit
- $35,038
Cash invested: $19,600 (down + closing). Projections, not guarantees.
Landlord ↔ Tenant lean methodology
- Overall (STATE)
- 87 Strongly Landlord-Friendly
- State Texas
- 87 Strongly Landlord-Friendly · R+5
- County
- — inherits STATE
- City
- — inherits STATE
ZIP-level market 78405
- Home prices YoY
- 1.3%
- Active inventory
- 77
- Price-to-rent
- 6.6×
Monthly cashflow live
- Estimated rent
- $889 high interval (Pro) →
- Mortgage (P&I)
- −$367
- Tax from tax record
- −$152 /mo · $1,821/yr
- Insurance
- −$29
- HOA
- −$0
- Vacancy / Maint / Mgmt
- −$187
- Net cashflow
- $154
Break-even live
Sensitivity live
| Price | -10% $194 | -5% $174 | +0% $154 | +5% $134 | +10% $114 |
|---|---|---|---|---|---|
| Rent | -10% $84 | -5% $119 | +0% $154 | +5% $189 | +10% $224 |
| Rate | -1.0pp $189 | -0.5pp $172 | base $154 | +0.5pp $136 | +1.0pp $117 |
UW: 25.0% down · 7.5% · 30yr · 1.5% tax · 5.0% vac · 8.0% maint · 8.0% mgmt
Financing live
Cash to close
- Down payment
- $17,500
- Closing costs
- $2,100
- Reserves months
- —
- Total cash needed
- —
Loan-product check · same deal, 3 products live
Conventional
25% down · 7.5% · 30yr
- Down + closing
- —
- Monthly P&I
- —
- Monthly cashflow
- —
- DSCR
- —
- Eligible?
- —
Personal DTI + credit; lowest rate.
DSCR
20% down · 8.5% · 30yr
- Down + closing
- —
- Monthly P&I
- —
- Monthly cashflow
- —
- DSCR
- —
- Eligible?
- —
No personal income docs; deal must DSCR.
Hard money
10% down · 12.0% · 12mo
- Down + closing
- —
- Monthly P&I
- —
- Monthly cashflow
- —
- DSCR
- —
- Eligible?
- —
Short-term bridge; refi at stabilization.
Rent comps 10 comps
| Address | Beds | Baths | Sqft | Rent | $/sqft | DOM | Units | Dist |
|---|---|---|---|---|---|---|---|---|
| 3150 Elgin St Corpus Christi, TX | 2.0 | 1.0 | 616 | $925 | $1.50 | 45d | 1 | 0.12mi |
| 637 Mohawk St Unit MA4 Corpus Christi, TX | 1.0 | 1.0 | 500 | $630 | $1.26 | 45d | 1 | 0.69mi |
| 510 Cheyenne St Corpus Christi, TX | 1.0 | 1.0 | 420 | $699 | $1.66 | 45d | 1 | 0.89mi |
| 1114 25th St Corpus Christi, TX | 1.0–2.0 | 1.0 | 712 | $1,050 | $1.47 | 15d | 6 | 1.15mi |
| 4702 Old Brownsville Rd Corpus Christi, TX | 1.0 | 1.0 | 700 | $764 | $1.09 | 45d | 1 | 1.17mi |
| 2937 Ruth St Corpus Christi, TX | 2.0 | 1.0 | 676 | $950 | $1.41 | 45d | 1 | 1.18mi |
| 1458 W Point Rd Corpus Christi, TX | 2.0–3.0 | 1.0 | 777 | $800 | $1.03 | 15d | 2 | 1.24mi |
| 3115 Agnes St Corpus Christi, TX | 2.0 | 1.0 | 428 | $828 | $1.93 | 45d | 3 | 1.40mi |
| 1808 Morgan Ave Corpus Christi, TX | 1.0 | 1.0 | 667 | $975 | $1.46 | 45d | 1 | 1.48mi |
| 1802 Morgan Ave Unit 1804 Corpus Christi, TX | 1.0 | 1.0 | 667 | $695 | $1.04 | 45d | 1 | 1.49mi |
Listing history 8 events
-
2026-05-31days on market $70,000 Active 194 DOM
-
2026-05-30days on market $70,000 Active 193 DOM
-
2025-11-17$70,000 Active 244-char remark
Show marketing remark (244 chars)
Owner was in process of remodeling after previous tenant vacated. Open floor plan needing work to be completed. There is an efficiency apt in back of property that is currently on month to month. Please verify all information including schools.
-
2020-07-01soldstatus
-
2012-01-26soldstatus
-
2000-03-17soldstatus 195-char remark
Show marketing remark (195 chars)
CUTE RENTAL OR 1ST TIME BUYER. HAS STORM SHUTTERS AT WINDOWS. TRIM NEEDS PAINTING & OWNER WILL DO AT FULL PRICE. WALK TO MOODY. CALL RENTER: CEDRIC JOHNSON AT 884-3722. IF NO ANSWER USE LB.
-
2000-03-17soldstatus $21,000
Show marketing remark (195 chars)
CUTE RENTAL OR 1ST TIME BUYER. HAS STORM SHUTTERS AT WINDOWS. TRIM NEEDS PAINTING & OWNER WILL DO AT FULL PRICE. WALK TO MOODY. CALL RENTER: CEDRIC JOHNSON AT 884-3722. IF NO ANSWER USE LB.
-
2000-01-17$28,900 195-char remark
Show marketing remark (195 chars)
CUTE RENTAL OR 1ST TIME BUYER. HAS STORM SHUTTERS AT WINDOWS. TRIM NEEDS PAINTING & OWNER WILL DO AT FULL PRICE. WALK TO MOODY. CALL RENTER: CEDRIC JOHNSON AT 884-3722. IF NO ANSWER USE LB.
ⓘ Source: listings_history table (triggers on properties + properties_extension) + one-shot
backfill from property_details.listing_events for pre-trigger history.
Tax reassessment forecast TX · Resets to sale price
- Current annual tax
- $1,821 · $152/mo
- Projected year-2 tax
- $1,821 · $152/mo
- Expected delta
- $0/yr ($0/mo · 0.0%)
ⓘ Screening estimate from a state-policy table — verify with the county assessor before closing.
Climate risk First Street
- Flood 3/10 Moderate FEMA zone X (unshaded) · 20% chance over 30 yrs
- Wildfire 1/10 Low
- Heat 10/10 Extreme 6 d/yr ≥107°F today · 22 d/yr by 30 yrs out
- Wind 9/10 Extreme 99% chance of damaging wind over 30 yrs
- Air quality 1/10 Low 0 unhealthy d/yr today · 0 by 30 yrs out
Nearby sold comps map
Loading sold comps map…
Walkable amenities ~0.75 mi
Loading nearby amenities…
Taxation est. · year 1
- Rental income
- $10,662
- − Mortgage interest
- −$3,921
- − Property taxes
- −$1,821
- − Insurance
- −$350
- − Repairs & maintenance
- −$853
- − Management
- −$853
- − Depreciation
- −$2,036
- Taxable income
- $828
- Est. tax owed @ 24.0%
- −$199
- After-tax cash flow
- $1,649/yr
For passive investors: Depreciation is non-cash, so a rental often shows a tax loss while cash-flowing — sheltering income. Rental losses are passive: they offset passive income freely, and up to $25,000/yr can offset ordinary (W-2) income if you actively participate and your MAGI is under $100k (phasing out to $0 by $150k); unused losses carry forward. On sale, claimed depreciation is recaptured at up to 25%, and gains may owe capital-gains tax (a 1031 exchange can defer both). Figures are a year-1 estimate at your 24.0% rate — not tax advice; consult a CPA.
Schools (NCES district)
- District
- Corpus Christi ISD
- NCES district ID
- 4815270
- Math proficiency
- 31% ▼ -18.00%
- Reading proficiency
- 35% ▼ -7.00%
- Median HH income
- $45,672
- Composite
- 28.27/100
- National rank
- #6793
- State rank
- #562 of 826 in TX
Livability — Corpus Christi
- Score
- 78/100
- State rank
- #66
- US rank
- #2404
Category grades
Schools grade is shown separately in the Schools card above.
Census & demographics
- Census place
- Corpus Christi, TX
- County
- Nueces County · 296,836 people
- City population
- 296,836
- Metro
- Corpus Christi, TX
- Population (ZIP)
- 14,602
- Household income
- $38,294
- Rent vs Own
- Severe rent burden
- 867.0
Population outlook (Nueces County) Hauer SSP2
- Today (2025)
- 418,037 people
- By 2030
- 447,123 · +7.0%
- By 2040
- 505,911 · +21.0%
- By 2050
- 567,522 · +35.8%
- By 2075
- 729,686 · +74.6%
- By 2100
- 847,087 · +102.6%
Race, ethnicity, and origin ACS 2023
- Neighborhood character
- Predominantly Hispanic (91%)
- Race & ethnicity
- Hispanic / Latino 91% Two or more races 48% Black 4% White 4%
- Hispanic origin (detail)
- Mexican 83%
- Foreign-born
- 18% · Canada
- Languages at home
- 52% English-only · Spanish 48%
Political lean MEDSL · Nueces
- 2024 margin
- R (+11.5) · D 43.8% · R 55.3%
- 2008→2024 swing
- -7.1pp toward R · 2008: -4.4pp · 2024: -11.5pp
- All cycles
- 2024: R+11.5 2020: R+2.9 2016: R+1.5 2012: R+3.2 2008: R+4.4
Not yet ingested
- Civics
- —
Market trends
- HPI YoY
- ▲ 1.42%
- Current HPI
- 113.2227
- Rent YoY
- —
- Metro
- Corpus Christi, TX
- State GDP YoY
- ▲ 3.95%
- F500 in state
- 110
Industry mix (Fortune 500 HQ in TX)
| Industry | F500 HQs | Revenue |
|---|---|---|
| Energy | 16 | $1,198B |
|
||
| Technology | 5 | $198B |
|
||
| Engineering / Construction | 4 | $72B |
|
||
| Energy Services | 3 | $60B |
|
||
| Utilities | 3 | $41B |
|
||
| Healthcare | 2 | $330B |
|
||
Price history
+142.2% since first listed6 events — show timeline
- 2025-11-17 Listed $70,000 CBMLS
- 2020-07-01 Sold (Public Records) — Public Records
- 2012-01-26 Sold (Public Records) — Public Records
- 2000-03-17 Sold (Public Records) $21,000 Public Records
- 2000-03-17 Sold (MLS) — CBMLS
- 2000-01-17 Listed $28,900 CBMLS
Property tax history
+4.9%/yrLatest (2025): $1,821 · +0.6% YoY. Source: county tax records.
Cash-flow waterfall
monthlySold comps — $/sqft
last 12 mo · ≤1 miLoading sold comps…