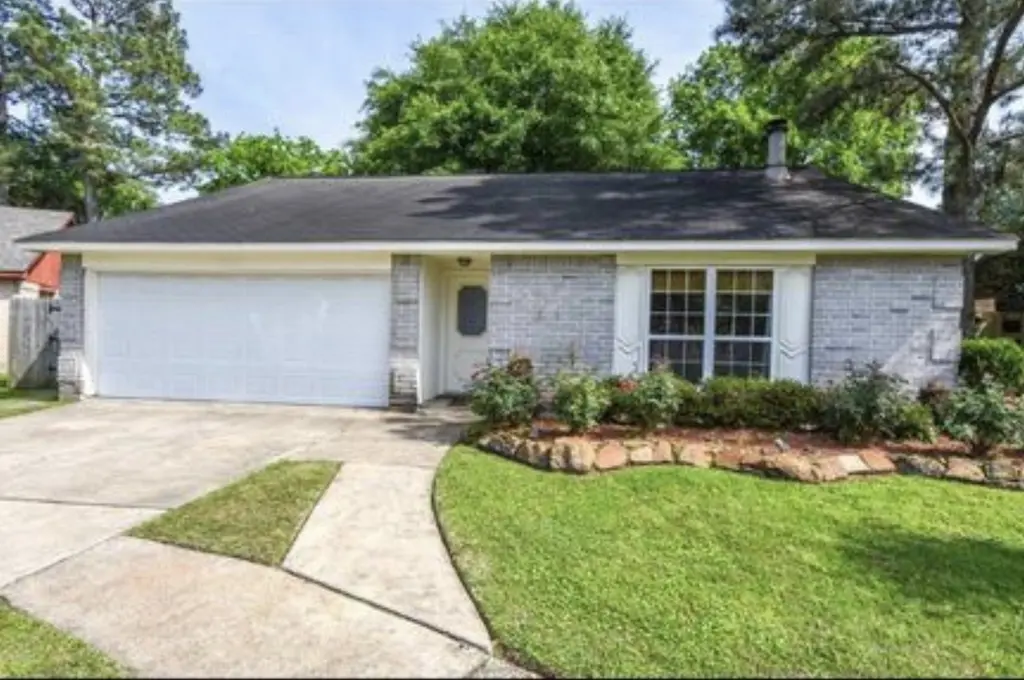
5906 Flower Gate Dr · Spring, TX
Flood risk 1/10 · Minimal
- FEMA flood zone
- X (unshaded)
- Chance of flooding over 30 yrs
- 0.0%
- Est. flood insurance / yr
- $507 – $1,088
Fire risk 2/10 · Minimal
- Est. fire insurance / yr
- $1,222 – $2,270
Heat risk 9/10 · Severe
- Hot days now (above 111°F)
- 7 days/yr
- Hot days in 30 yrs
- 25 days/yr
Wind risk 8/10 · Major
- Chance of severe wind over 30 yrs
- 99.0%
Air-quality risk 3/10 · Minor
- Unhealthy air days now
- 3 days/yr
- Unhealthy air days in 30 yrs
- 3 days/yr
Risk factors via First Street. Map © Google.
Why this score? — see what drove the C- grade
The composite is a weighted blend of 9 inputs, each scored 0–100. Each bar is that input's sub-score; the figure is the points it added to the 100-point composite (weight × sub-score).
- Cash flow +19.8/30.0
- ARV discount +9.6/15.0
- 1% rule +6.8/10.0
- DSCR +6.3/10.0
- Livability +3.3/5.0
- Condition / age +2.5/5.0
- Rent growth +2.4/5.0
- Schools +2.0/10.0
- Appreciation +0.0/10.0
$189,995
🖨 Deal sheet 📄 Offer letter ✓ Due diligence
Listing remarks MLS
This beautiful 3/bed 2/bath home is tucked away in the lovely cul-de-sac of Greengate Place. Interior features include a wood-burning fireplace, vaulted ceilings, and wood flooring. Exterior features include an amazing custom, covered wood deck, additional bonus patios, and impeccably landscaped and maintained yards - both the front and back! Come by and visit your new home today!
Key facts
- Large backyard
- Cozy fireplace
- 7,601 sq ft lot
Tags
Property features AI
Finance
- Other: Lease not considered
- HOA & community: Part of Greengate Place association; Annual association fee of $374
Exterior
- Parking: Attached garage with 2 parking spaces
- Utilities: Public water; Public sewer
- Home design: Residential property; Built in 1980; Slab foundation; Composition roof
- Construction: Brick construction
- Exterior features: Located on a cul-de-sac
Interior
- Bedrooms: 3 total rooms
- Bathrooms: 2 full bathrooms; 2 half bathrooms
- Heating & cooling: Central heating (electric); Central air conditioning (electric)
- Interior features: Wood-burning fireplace (1)
Neighborhood map
What this means for you Summary
Snapshot
- This is a 3-bed/2.0-bath single-family listed at $190k.
Deal economics
- At list price, monthly cash flow is $226 ($3k/yr) — positive.
- The deal already cash-flows at list — no discount required.
- Meets the 1% rule at list price ($2k rent vs $190k).
- Recommended offer: $187k (1.5% below list) — sets the bar for market timing.
- Cap rate 7.7% vs local median 4.5% in Spring — top-decile yield for the area; either an underpriced asset or a hidden risk that comps aren't pricing in. Stress-test before assuming the spread holds.
Location & tenants
- Location reads 66/100 on livability (#635 in TX) — a middle-class / working-renter tenant base. Strengths: cost of living A+, housing A+, employment B; Watch: schools C-, crime D, amenities F.
- Spring ISD (suburban): math 19% / reading 26% proficiency, ranked #730 of 826 in TX (top 88%) — low school quality limits family demand, transient renter base, plan for 1-2y turnover; 66% free/reduced lunch — lower-income household profile, screen leases tightly.
- Market conditions: Rents soft (-0.3%/yr); 595 active listings in the ZIP; solid renter incomes; 29,883 units permitted in Harris County in 2024 (8,621 in 5+ unit buildings).
- This rent runs 30% of the median local income ($89k/yr) — at the standard rent-burdened threshold; future hikes will face affordability resistance.
Forward outlook
- Local home prices are declining (-3.0%/yr); year-one equity from $1k of loan paydown is wiped out by about $6k of value loss. Plan a longer hold.
- Harris County population projected at +47% by 2050 — long-run rental-demand tailwind backs the buy-and-hold thesis.
Negotiation context
- It's been on market 25 days — a 2% lower offer ($187k) is reasonable based on typical stale-listing flexibility.
- 2 sale attempts since 8y ago with the ask held roughly flat each time — persistent listings suggest the price (not the market) is what's stuck; bring a comps-based counter.
- Current owner paid $32k; list at $190k implies a 501% gain — meaningful room to come down on a strong offer.
Risks & watch-outs
- Watch-outs: property tax is 2.8% of price.
- Climate carrying-cost: severe wind risk, 99% chance of damaging wind over 30y; extreme-heat days projected 7→25/yr by 2055 (HVAC capex compounding) — expect insurance premiums to compound above CPI over the hold.
Questions for the listing agent
- Property tax is high relative to price — has the assessment been appealed recently, and will the sale trigger a re-assessment?
- What does the HOA fee cover, when was the last increase, and are there any pending special assessments or reserve-fund shortfalls?
- Is there a deadline driving the sale (1031 exchange, divorce, estate, relocation)? That informs how much negotiation room exists.
- Crime grade is D in this area — have there been break-ins, vandalism, or insurance claims at this property in the last 3 years? What carrier currently insures it and at what premium?
- What's the average days-on-market for RENTAL listings here right now (not sales)? A rising rental-DOM trend means longer vacancies and softer asking-rent achievability than the comps imply.
- What's the recent tenant-quality profile in this submarket — average credit score on applications, eviction rate, late-payment / NSF rate, and stable-employment percentage? A property-management company in the area should have these aggregated.
- How much new for-sale + rental construction is in the pipeline within 1–3 miles? Heavy new supply typically softens prices + rents 12–24 months out; constrained supply supports both.
Investment metrics
- 1% rule
- 1.18% ✓
- Cap rate
- 7.72%
- Cash-on-cash
- 5.11%
- DSCR
- 1.23
- GRM
- 7.1
CMA / ARV
- ARV (median comp)
- $199,160
- List price
- $189,995
- Delta
- -4.60%
- Verdict
- FAIR
- Comps
- 20 within 1.0 mi
Show comp detail 6 sales within ~0.75 mi
| Address | Dist | Beds/Ba | Sqft | Sold | Price | $/sf | Match |
|---|---|---|---|---|---|---|---|
| 5715 Walnutgate Dr | 0.29mi | 3/2.0 | 1,565 (+12%) | 4mo | $220,000 | $141 | 63 |
| 22731 Melham Ln | 0.25mi | 3/2.0 | 1,533 (+10%) | 13mo | $190,000 | $124 | 61 |
| 6422 Brookgate Dr | 0.70mi | 3/2.0 | 1,446 (+4%) | 12mo | $187,900 | $130 | 51 |
| 23114 Goodfellow Dr | 0.66mi | 3/2.0 | 1,541 (+10%) | 7mo | $210,000 | $136 | 46 |
| 5603 Rivergate Dr | 0.51mi | 3/2.0 | 1,537 (+10%) | 20mo | $190,000 | $124 | 43 |
| 23142 Calico Corners Ln | 0.57mi | 3/2.0 | 1,599 (+14%) | 19mo | $179,000 | $112 | 34 |
Match score weights: distance 35% · size 25% · config 20% · recency 20%. Top-matched comps best support the ARV.
Projected returns pro-forma
-3.0% appreciation · 0.0% rent growth · sell at horizon
- IRR
- -12.2%
- Equity multiple
- 0.57×
- Total profit
- $-22,758
- Equity at exit
- $28,329
- IRR
- -9.4%
- Equity multiple
- 0.51×
- Total profit
- $-25,914
- Equity at exit
- $16,427
Cash invested: $53,199 (down + closing). Projections, not guarantees.
Landlord ↔ Tenant lean methodology
- Overall (STATE)
- 87 Strongly Landlord-Friendly
- State Texas
- 87 Strongly Landlord-Friendly · R+5
- County
- — inherits STATE
- City
- — inherits STATE
ZIP-level market 77373
- Rents YoY
- -0.3%
- Active inventory
- 595
- Price-to-rent
- 7.1×
Monthly cashflow live
- Estimated rent
- $2,241 medium interval (Pro) →
- Mortgage (P&I)
- −$996
- Tax from tax record
- −$437 /mo · $5,248/yr
- Insurance
- −$79
- HOA
- −$31
- Vacancy / Maint / Mgmt
- −$471
- Net cashflow
- $226
Break-even live
UW: 25.0% down · 7.5% · 30yr · 1.5% tax · 5.0% vac · 8.0% maint · 8.0% mgmt
Financing live
Cash to close
- Down payment
- $47,499
- Closing costs
- $5,700
- Reserves months
- —
- Total cash needed
- —
Loan-product check · same deal, 3 products live
Conventional
25% down · 7.5% · 30yr
- Down + closing
- —
- Monthly P&I
- —
- Monthly cashflow
- —
- DSCR
- —
- Eligible?
- —
Personal DTI + credit; lowest rate.
DSCR
20% down · 8.5% · 30yr
- Down + closing
- —
- Monthly P&I
- —
- Monthly cashflow
- —
- DSCR
- —
- Eligible?
- —
No personal income docs; deal must DSCR.
Hard money
10% down · 12.0% · 12mo
- Down + closing
- —
- Monthly P&I
- —
- Monthly cashflow
- —
- DSCR
- —
- Eligible?
- —
Short-term bridge; refi at stabilization.
HOA detail
- Monthly dues
- $31 · $372/yr
Listing history 16 events
-
2026-06-09days on market $189,995 Active 25 DOM
-
2026-06-08days on market $189,995 Active 24 DOM
-
2026-06-07days on market $189,995 Active 23 DOM
-
2026-06-04days on market $189,995 Active 20 DOM
-
2026-06-03days on market $189,995 Active 19 DOM
-
2026-06-02days on market $189,995 Active 18 DOM
-
2026-06-01days on market $189,995 Active 17 DOM
-
2026-05-31days on market $189,995 Active 16 DOM
-
2026-05-15$189,995 Active 833-char remark
-
2018-06-06soldstatus
-
2018-06-01soldstatus Sold 383-char remark
Show marketing remark (383 chars)
This beautiful 3/bed 2/bath home is tucked away in the lovely cul-de-sac of Greengate Place. Interior features include a wood-burning fireplace, vaulted ceilings, and wood flooring. Exterior features include an amazing custom, covered wood deck, additional bonus patios, and impeccably landscaped and maintained yards - both the front and back! Come by and visit your new home today!
-
2018-05-05status Pending 383-char remark
Show marketing remark (383 chars)
This beautiful 3/bed 2/bath home is tucked away in the lovely cul-de-sac of Greengate Place. Interior features include a wood-burning fireplace, vaulted ceilings, and wood flooring. Exterior features include an amazing custom, covered wood deck, additional bonus patios, and impeccably landscaped and maintained yards - both the front and back! Come by and visit your new home today!
-
2018-04-29status Option Pending 383-char remark
Show marketing remark (383 chars)
This beautiful 3/bed 2/bath home is tucked away in the lovely cul-de-sac of Greengate Place. Interior features include a wood-burning fireplace, vaulted ceilings, and wood flooring. Exterior features include an amazing custom, covered wood deck, additional bonus patios, and impeccably landscaped and maintained yards - both the front and back! Come by and visit your new home today!
-
2018-04-26$129,900 Active 383-char remark
Show marketing remark (383 chars)
This beautiful 3/bed 2/bath home is tucked away in the lovely cul-de-sac of Greengate Place. Interior features include a wood-burning fireplace, vaulted ceilings, and wood flooring. Exterior features include an amazing custom, covered wood deck, additional bonus patios, and impeccably landscaped and maintained yards - both the front and back! Come by and visit your new home today!
-
1988-12-01soldstatus $31,600
-
1988-02-29soldstatus $31,600
ⓘ Source: listings_history table (triggers on properties + properties_extension) + one-shot
backfill from property_details.listing_events for pre-trigger history.
Tax reassessment forecast TX · Resets to sale price
- Current annual tax
- $5,248 · $437/mo
- Projected year-2 tax
- $5,248 · $437/mo
- Expected delta
- $0/yr ($0/mo · 0.0%)
ⓘ Screening estimate from a state-policy table — verify with the county assessor before closing.
Climate risk First Street
- Flood 1/10 Low FEMA zone X (unshaded) · 0% chance over 30 yrs
- Wildfire 2/10 Low
- Heat 9/10 Extreme 7 d/yr ≥111°F today · 25 d/yr by 30 yrs out
- Wind 8/10 Severe 99% chance of damaging wind over 30 yrs
- Air quality 3/10 Moderate 3 unhealthy d/yr today · 3 by 30 yrs out
Nearby sold comps map
Loading sold comps map…
Walkable amenities ~0.75 mi
Loading nearby amenities…
Taxation est. · year 1
- Rental income
- $26,891
- − Mortgage interest
- −$10,643
- − Property taxes
- −$5,248
- − Insurance
- −$950
- − Repairs & maintenance
- −$2,151
- − Management
- −$2,151
- − HOA
- −$372
- − Depreciation
- −$5,527
- Taxable loss
- −$152
- Est. tax savings @ 24.0%
- +$36
- After-tax cash flow
- $2,754/yr
For passive investors: Depreciation is non-cash, so a rental often shows a tax loss while cash-flowing — sheltering income. Rental losses are passive: they offset passive income freely, and up to $25,000/yr can offset ordinary (W-2) income if you actively participate and your MAGI is under $100k (phasing out to $0 by $150k); unused losses carry forward. On sale, claimed depreciation is recaptured at up to 25%, and gains may owe capital-gains tax (a 1031 exchange can defer both). Figures are a year-1 estimate at your 24.0% rate — not tax advice; consult a CPA.
Schools (NCES district)
- District
- Spring ISD
- NCES district ID
- 4841220
- Math proficiency
- 19% ▼ -13.00%
- Reading proficiency
- 26% ▼ -6.00%
- Median HH income
- $51,584
- Composite
- 20.12/100
- National rank
- #8643
- State rank
- #730 of 826 in TX
Livability — Spring
- Score
- 66/100
- State rank
- #635
- US rank
- #12101
Category grades
Schools grade is shown separately in the Schools card above.
Census & demographics
- Census place
- Spring, TX
- County
- Harris County · 4,702,590 people
- City population
- 430,529
- Metro
- Houston-The Woodlands-Sugar Land, TX
- Population (ZIP)
- 69,739
- Household income
- $88,617
- Rent vs Own
- Severe rent burden
- 1050.0
Population outlook (Harris County) Hauer SSP2
- Today (2025)
- 5,571,493 people
- By 2030
- 6,089,821 · +9.3%
- By 2040
- 7,142,806 · +28.2%
- By 2050
- 8,185,864 · +46.9%
- By 2075
- 10,574,329 · +89.8%
- By 2100
- 12,109,958 · +117.4%
Race, ethnicity, and origin ACS 2023
- Neighborhood character
- Diverse neighborhood (Simpson 0.69)
- Race & ethnicity
- Hispanic / Latino 40% White 30% Black 23% Two or more races 22% Asian 3%
- Hispanic origin (detail)
- Mexican 27% Puerto Rican 2% Cuban 2% Dominican 2%
- Common ancestry
- Lithuanian 2% Italian 1% Slovak 1%
- Foreign-born
- 17% · Canada, Jamaica, Vietnam
- Languages at home
- 64% English-only · Spanish 32% Vietnamese 1% Other Indo-European 1%
Political lean MEDSL · Harris
- 2024 margin
- Lean D (+5.5) · D 52.0% · R 46.4% · Other 1.6%
- 2008→2024 swing
- +3.9pp toward D · 2008: 1.6pp · 2024: 5.5pp
- All cycles
- 2024: D+5.5 2020: D+13.3 2016: D+12.4 2012: D+0.1 2008: D+1.6
Not yet ingested
- Civics
- —
Market trends
- HPI YoY
- ▼ -142.98%
- Current HPI
- 251.7231
- Rent YoY
- ▼ -0.30%
- Metro
- Houston-The Woodlands-Sugar Land, TX
- State GDP YoY
- ▲ 3.95%
- F500 in state
- 110
Industry mix (Fortune 500 HQ in TX)
| Industry | F500 HQs | Revenue |
|---|---|---|
| Energy | 16 | $1,198B |
|
||
| Technology | 5 | $198B |
|
||
| Engineering / Construction | 4 | $72B |
|
||
| Energy Services | 3 | $60B |
|
||
| Utilities | 3 | $41B |
|
||
| Healthcare | 2 | $330B |
|
||
Price history
+501.2% since first listed9 events — show timeline
- 2026-06-10 Listing Removed — HARMLS
- 2026-05-15 Listed $189,995 HARMLS
- 2018-06-06 Sold (Public Records) — Public Records
- 2018-06-01 Sold (MLS) — HARMLS
- 2018-05-05 Pending — HARMLS
- 2018-04-29 Pending — HARMLS
- 2018-04-26 Listed $129,900 HARMLS
- 1988-12-01 Sold (Public Records) $31,600 Public Records
- 1988-02-29 Sold (Public Records) $31,600 Public Records
Property tax history
+5.3%/yrLatest (2025): $5,248 · +9.8% YoY. Source: county tax records.
Cash-flow waterfall
monthlySold comps — $/sqft
last 12 mo · ≤1 miLoading sold comps…